cumulative plot
basic concept
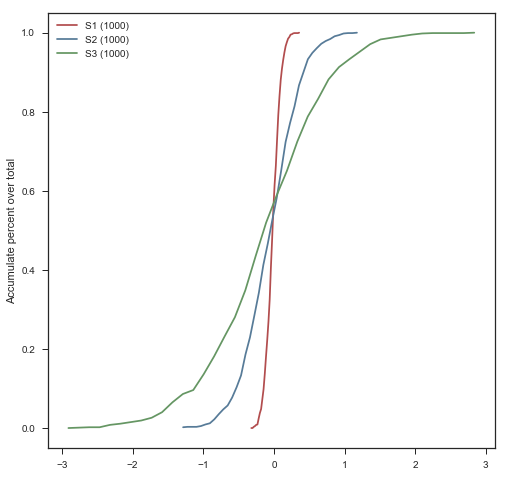
数据的累积分布,也即小于等于当前数据值的所有数据的概率分布,对于表示数据点在某个区间内出现的概率有很大的帮助。从数学上来说,累积分布函数(Cumulative Distribution Function, 简称CDF)是概率分布函数的积分。
python implementation
import numpy as np
import seaborn as sns

def sns_color_ls():
    return sns.color_palette("Set1", n_colors=8, desat=.5)*2

def cumulate_dist_plot(ls_ls,ls_ls_label,bins=40,title=None,ax=None,savefn=None,xlabel=None,ylabel=None,add_vline=None,add_hline=None,log2transform=0,xlim=None,ylim=None):
    if ax is None:
        with sns.axes_style("ticks"):
            fig,ax = plt.subplots(figsize=(8,8))

    color_ls = sns_color_ls()

    ls_ls_label = [j+' ('+str(len(i))+')' for i,j in zip(ls_ls,ls_ls_label)]

    if log2transform:
        ls_ls = [np.log2(i) for i in ls_ls]

    for n,ls in enumerate(ls_ls):
        values,base = np.histogram(ls,bins=bins)
        cumulative = np.cumsum(values)
        cumulative_norm = [i/float(len(ls)) for i in cumulative]
        ax.plot(base[:-1],cumulative_norm,color=color_ls[n],label=ls_ls_label[n])
        print "plot line num: %s"%(n)

    if xlabel is not None:
        ax.set_xlabel(xlabel)

    if ylabel is not None:
        ax.set_ylabel(ylabel)
    else:
        ax.set_ylabel("Accumulate percent over total")

    if title is not None:
        ax.set_title(title)

    if add_vline is not None:
        for vline in add_vline:
            ax.axvline(vline,ls="--", color='lightgrey')

    if add_hline is not None:
        for hline in add_hline:
            ax.axhline(hline,ls="--", color='lightgrey')

    if xlim is not None:
        ax.set_xlim(xlim[0], xlim[1])

    if ylim is not None:
        ax.set_ylim(ylim[0], ylim[1])

    ax.legend(loc="best")

    if savefn is not None:
        plt.savefig(savefn)
        plt.close()
mu1, sigma1 = 0, 0.1
mu2, sigma2 = 0, 0.4
mu3, sigma3 = 0, 0.8

s1 = np.random.normal(mu1, sigma1, 1000)
s2 = np.random.normal(mu2, sigma2, 1000)
s3 = np.random.normal(mu3, sigma3, 1000)

cumulate_dist_plot(ls_ls=[s1,s2,s3],ls_ls_label=['S1','S2','S3'],bins=40)
If you link this blog, please refer to this page, thanks!
Post link:https://tsinghua-gongjing.github.io/posts/accumulateplot.html
Previous:
Usage of grep command
Next:
读后感-克莱儿-麦克福尔《摆渡人》
Latest articles
Links
- ZhangLab , RISE database , THU life , THU info
- Data analysis: pandas , numpy , scipy
- ML/DL: sklearn , sklearn(中文) , pytorch
- Visualization: seaborn , matplotlib , gallery
- Github: me