plot use plt.bar
import matplotlib.pyplot as plt

xticklabels = ('A', 'B', 'C', 'D')
x_pos = range(len(xticklabels))
y_values = [1,2,3,4]

plt.bar(x_pos, y_values, align='center', alpha=0.5)
plt.xticks(x_pos, xticklabels)
plt.ylabel('value')

plt.show()
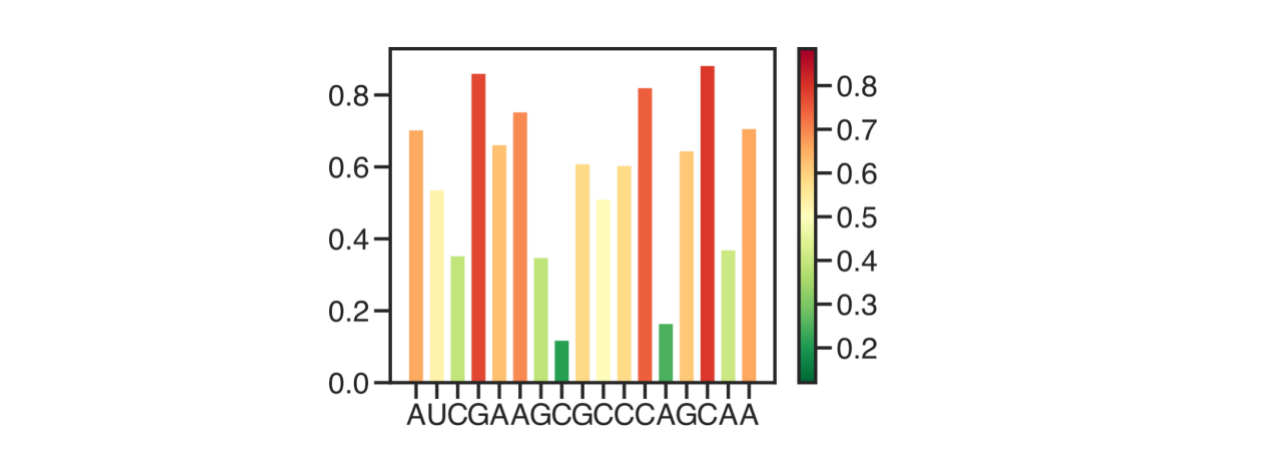
每个bar根据值上颜色,并画出colorbar
import random

from matplotlib import cm

def plot_bar(seq=None, shape_ls=None, colormap='RdYlGn_r', savefn=None):
    if shape_ls is None:
        shape_ls = [random.random() for i in range(len(seq))]
    shape_ls = np.array(shape_ls)
    if colormap == 'RdYlGn_r':
        colors = cm.RdYlGn_r(shape_ls, )
        plot = plt.scatter(shape_ls, shape_ls, c = shape_ls, cmap = colormap)
        plt.clf()
        plt.colorbar(plot)

    plt.bar(range(len(shape_ls)), shape_ls, color = colors)
    plt.xticks(range(len(seq)), list(seq))
    plt.tight_layout()
    plt.savefig(savefn)
    plt.close()

def main():
    ####################################################################
    ### define parser of arguments
    parser = argparse.ArgumentParser(description='Plot a list of .bed region signal dist')

    parser.add_argument('--seq', type=str, default='AUCGAAGCGCCCAGCAA', help='Sequence of the shape')
    parser.add_argument('--shape_ls', type=str, help='Shape value')
    parser.add_argument('--colormap', type=str, default='RdYlGn_r', help='colormap#choose from: https://matplotlib.org/3.1.0/tutorials/colors/colormaps.html')
    parser.add_argument('--savefn', type=str, default='/home/gongjing/project/shape_imputation/results/scheme_shape_bar.pdf', help='savefn')

    # get args
    args = parser.parse_args()
    plot_bar(seq=args.seq, shape_ls=args.shape_ls, colormap=args.colormap, savefn=args.savefn)

if __name__ == '__main__':
    main()
If you link this blog, please refer to this page, thanks!
Post link:https://tsinghua-gongjing.github.io/posts/barplot.html
Previous:
Usage of awk command
Next:
Usage of grep command
Latest articles
Links
- ZhangLab , RISE database , THU life , THU info
- Data analysis: pandas , numpy , scipy
- ML/DL: sklearn , sklearn(中文) , pytorch
- Visualization: seaborn , matplotlib , gallery
- Github: me