iris = sns.load_dataset("iris")
iris.head()

sepal_length	sepal_width	petal_length	petal_width	species
0	5.1	3.5	1.4	0.2	setosa
1	4.9	3.0	1.4	0.2	setosa
2	4.7	3.2	1.3	0.2	setosa
3	4.6	3.1	1.5	0.2	setosa
4	5.0	3.6	1.4	0.2	setosa
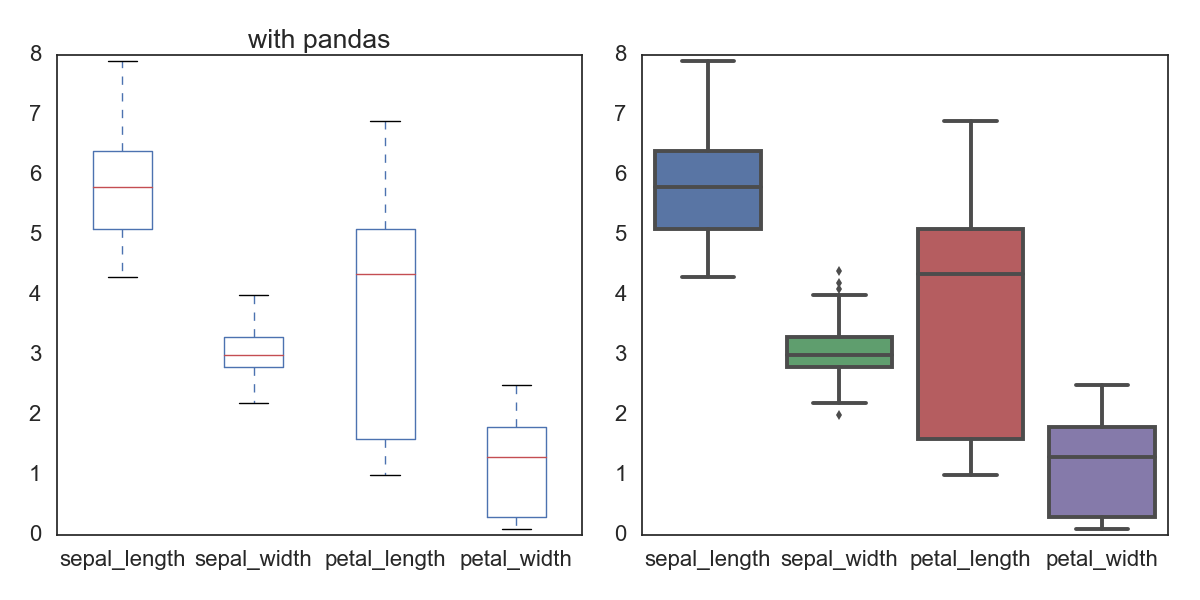
对一个data frame的每一列都画box,非数值的列(比如这里的species)不画;所以此时他们的数值数目可能是一样的。pandas和seaborn都可以直接画。
fig, ax= plt.subplots(1,2,figsize=(12,6))
iris.plot(kind='box', ax=ax[0], title='with pandas')
sns.boxplot(data=iris, ax=ax[1])
plt.tight_layout()
savefn = '/Users/gongjing/Dropbox/blog_codes/images/box_plot.png'
plt.savefig(savefn)
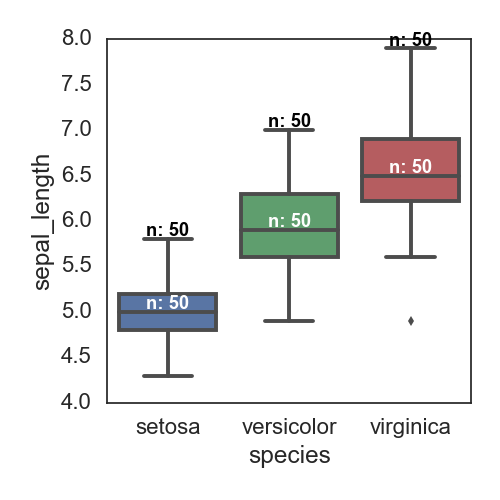
根据species进行分类,画某一列的数值的分布;这个只能是seaborn来画; 添加每个box对应的observation数目 参考这里
fig, ax= plt.subplots(figsize=(5,5))
sns.boxplot(x='species', y='sepal_length', data=iris)

# Calculate number of obs per group & median to position labels
medians = iris.groupby(['species'])['sepal_length'].median().values
maxs = iris.groupby(['species'])['sepal_length'].max().values
means = iris.groupby(['species'])['sepal_length'].mean().values
nobs = iris['species'].value_counts().values
nobs = [str(x) for x in nobs.tolist()]
nobs = ["n: " + i for i in nobs]

# add the number of observations on the top
pos = range(len(nobs))
for tick,label in zip(pos,ax.get_xticklabels()):
    ax.text(pos[tick], medians[tick] + 0.03, nobs[tick],
            horizontalalignment='center', size='x-small', color='w', weight='semibold')

    ax.text(pos[tick], maxs[tick] + 0.03, nobs[tick],
            horizontalalignment='center', size='x-small', color='black', weight='semibold')

plt.tight_layout()
savefn = '/Users/gongjing/Dropbox/blog_codes/images/box_plot2.png'
plt.savefig(savefn)
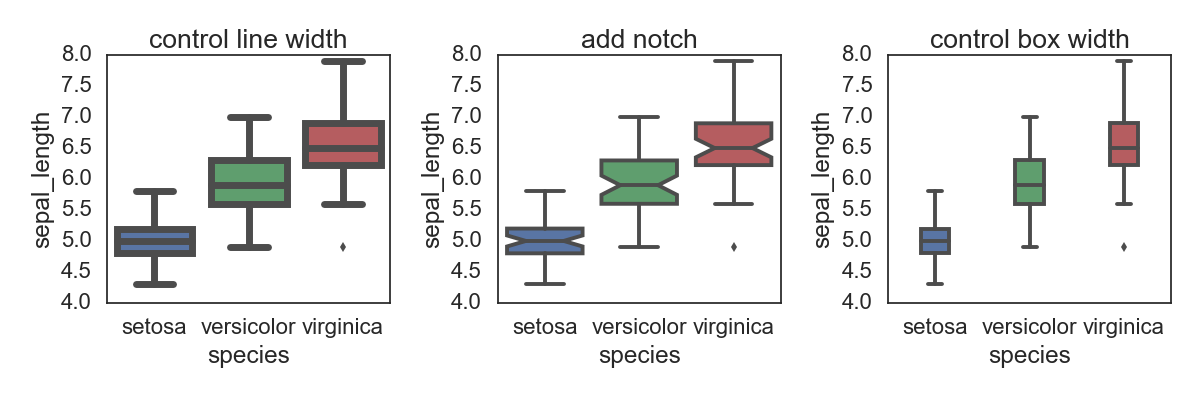
调整box图里面的部分元素:比如下面的line width, type(box or notch),box width
fig, ax = plt.subplots(1, 3, figsize=(12,4))
sns.boxplot( x="species", y="sepal_length", data=iris, linewidth=5, ax=ax[0])
sns.boxplot( x="species", y="sepal_length", data=iris, notch=True, ax=ax[1])
sns.boxplot( x="species", y="sepal_length", data=iris, width=0.3, ax=ax[2])
ax[0].set(title='control line width')
ax[1].set(title='add notch')
ax[2].set(title='control box width')
plt.tight_layout()
savefn = '/Users/gongjing/Dropbox/blog_codes/images/box_plot3.png'
plt.savefig(savefn)
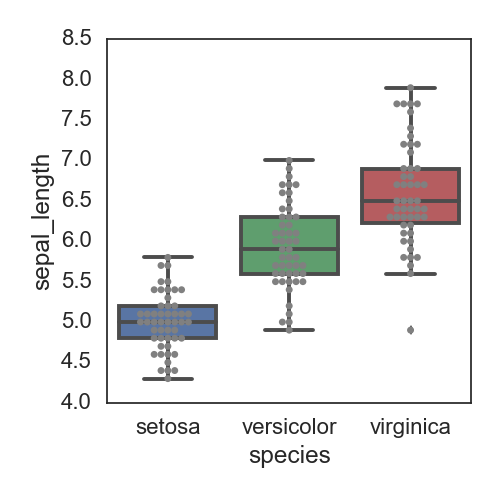
在box中添加具体的点的分布:
fig, ax= plt.subplots(figsize=(5,5))
ax = sns.boxplot(x='species', y='sepal_length', data=iris)
ax = sns.swarmplot(x='species', y='sepal_length', data=iris, color="grey")
plt.tight_layout()
savefn = '/Users/gongjing/Dropbox/blog_codes/images/box_plot4.png'
plt.savefig(savefn)
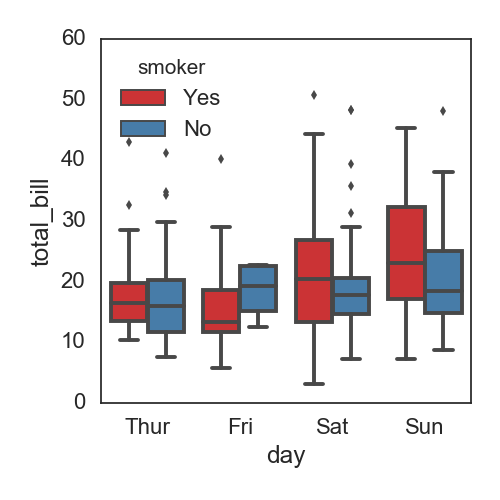
分组并列的box:
df = sns.load_dataset('tips')
print df.head()

 total_bill   tip     sex smoker  day    time  size
0       16.99  1.01  Female     No  Sun  Dinner     2
1       10.34  1.66    Male     No  Sun  Dinner     3
2       21.01  3.50    Male     No  Sun  Dinner     3
3       23.68  3.31    Male     No  Sun  Dinner     2
4       24.59  3.61  Female     No  Sun  Dinner     4

fig, ax= plt.subplots(figsize=(5,5))
sns.boxplot(x="day", y="total_bill", hue="smoker", data=df, palette="Set1")

plt.tight_layout()
savefn = '/Users/gongjing/Dropbox/blog_codes/images/box_plot5.png'
plt.savefig(savefn)
If you link this blog, please refer to this page, thanks!
Post link:https://tsinghua-gongjing.github.io/posts/boxplot.html
Previous:
观后感-《楚门的世界》
Next:
Distribution/hist plot
Latest articles
Links
- ZhangLab , RISE database , THU life , THU info
- Data analysis: pandas , numpy , scipy
- ML/DL: sklearn , sklearn(中文) , pytorch
- Visualization: seaborn , matplotlib , gallery
- Github: me
