Circos tableview tool to visualize interaction correlation or distribution
Tag: genomics, circos
Circos tableview
Circos can show the connections between different elements, e.g., genomic regions, RNA molecules and so on. Another userful tool tableviewer can be used to display the percentage of each crosslinks among multiple relationships. In RISE database we collected RNA-RNA interactions (RRIs) from various sources, and tableviewer are used for visualization of the landscape of RRIs. Here is the example:

Generate stats data from data frame
Generally we can read any txt file into pandas data frame, and use function groupby & count to count the entry for each pair of two variables. Here is the saved data frame:
[zhangqf5@loginview02 data]$ cat RRI_union_deduplicates.split_full.type_dis.human.txt
data proteinCoding lncRNA miRNA rRNA snoRNA snRNA tRNA NoncanonicalRNA others
proteinCoding 41863.0 4756.0 183.0 14128.0 115.0 721.0 66.0 3520.0 2762.0
lncRNA 9982.0 1080.0 1984.0 194.0 40.0 91.0 2.0 748.0 482.0
miRNA 35798.0 304.0 36.0 14.0 6.0 23.0 1.0 458.0 117.0
rRNA 1347.0 147.0 3.0 360.0 31.0 15.0 27.0 100.0 83.0
snoRNA 105.0 21.0 2.0 290.0 299.0 86.0 6.0 24.0 10.0
snRNA 969.0 170.0 1.0 41.0 29.0 851.0 1.0 70.0 52.0
tRNA 22.0 1.0 0.0 3.0 1.0 1.0 210.0 3.0 23.0
NoncanonicalRNA 6010.0 705.0 1076.0 69.0 104.0 69.0 1.0 1132.0 271.0
others 2850.0 384.0 328.0 74.0 12.0 43.0 5.0 262.0 400.0
Define color for your data
Then we can add header (more details can be found here) to define color for each element (RNA type here):
data 1 2 3 4 5 6 7 8 9
data 202,75,78 83,169,102 205,185,111 98,180,208 129,112,182 238,130,238 255,140,0 74,113,178 169,169,169
Concatenate data for plot
Once concatenate header and data frame, the combined data is ready for plot:
[zhangqf5@loginview02 data]$ cat RRI_union_deduplicates.split_full.type_dis.human.txt
data 1 2 3 4 5 6 7 8 9
data 202,75,78 83,169,102 205,185,111 98,180,208 129,112,182 238,130,238 255,140,0 74,113,178 169,169,169
data proteinCoding lncRNA miRNA rRNA snoRNA snRNA tRNA NoncanonicalRNA others
proteinCoding 41863.0 4756.0 183.0 14128.0 115.0 721.0 66.0 3520.0 2762.0
lncRNA 9982.0 1080.0 1984.0 194.0 40.0 91.0 2.0 748.0 482.0
miRNA 35798.0 304.0 36.0 14.0 6.0 23.0 1.0 458.0 117.0
rRNA 1347.0 147.0 3.0 360.0 31.0 15.0 27.0 100.0 83.0
snoRNA 105.0 21.0 2.0 290.0 299.0 86.0 6.0 24.0 10.0
snRNA 969.0 170.0 1.0 41.0 29.0 851.0 1.0 70.0 52.0
tRNA 22.0 1.0 0.0 3.0 1.0 1.0 210.0 3.0 23.0
NoncanonicalRNA 6010.0 705.0 1076.0 69.0 104.0 69.0 1.0 1132.0 271.0
others 2850.0 384.0 328.0 74.0 12.0 43.0 5.0 262.0 400.0
Calling tableviewer to plot
I wrote a python script to call tableviewer:
import subprocess, os
import sys

def tableview(txt=None, parse_table=None, make_conf=None, conf_dir=None, circos_conf=None, save_dir=None, parsed_conf=None):
        if parse_table is None:
                parse_table = '/Share/home/zhangqf5/gongjing/software/circos-tools-0.22/tools/tableviewer/bin/parse-table'
        if make_conf is None:
                make_conf = '/Share/home/zhangqf5/gongjing/software/circos-tools-0.22/tools/tableviewer/bin/make-conf'
        if conf_dir is None:
                conf_dir = '/Share/home/zhangqf5/gongjing/software/circos-tools-0.22/tools/tableviewer2/data'
        if circos_conf is None:
                circos_conf = '/Share/home/zhangqf5/gongjing/software/circos-tools-0.22/tools/tableviewer2/etc/circos.conf'
        if save_dir is None:
                save_dir = os.path.dirname(txt)
        if parsed_conf is None:
                #parsed_conf = '/Share/home/zhangqf5/gongjing/software/circos-tools-0.22/tools/tableviewer/samples/parse-table-02a.conf'
                parsed_conf = '/Share/home/zhangqf5/gongjing/software/circos-tools-0.22/tools/tableviewer2/etc/parse-table.conf'
        print "[tableview start] file: %s"%(txt)
        subprocess.call(["cat {txt} | {parse_table} -conf {parsed_conf} -segment_order=ascii,size_desc -placement_order=row,col -interpolate_type count -col_order_row -use_col_order_row -col_color_row -use_col_color_row -ribbon_layer_order=size_asc | {make_conf} -dir {conf_dir}".format(txt=txt, parse_table=parse_table, parsed_conf=parsed_conf, make_conf=make_conf, conf_dir=conf_dir)],shell=True)
        #subprocess.call(["cat {txt} | {parse_table} -conf {parsed_conf} | {make_conf} -dir {conf_dir}".format(txt=txt, parse_table=parse_table, parsed_conf=parsed_conf, make_conf=make_conf, conf_dir=conf_dir)],shell=True)
        file_png = txt.split('/')[-1].replace('txt', 'png')
        subprocess.call(["circos -conf {circos_conf} -outputdir {save_dir} -outputfile {file_png} -param random_string=zgvickusamp| grep created".format(circos_conf=circos_conf, save_dir=save_dir, file_png=file_png)],shell=True)
        print "[tableview end] file: %s"%(txt)

def main():
        #tableview(txt='/Share/home/zhangqf5/gongjing/software/circos-tools-0.22/tools/tableviewer/samples/RRI_union_deduplicates.split_full.type_dis.txt')
        if len(sys.argv) == 1:
            txt = '/Share/home/zhangqf5/gongjing/software/circos-tools-0.22/tools/tableviewer2/samples/RRI_union_deduplicates.split_full.type_dis.txt'
        else:
            txt = sys.argv[1]
        tableview(txt)

if __name__ == '__main__':
        main()
Run the script with previous data:
[zhangqf5@loginview02 tableviewer2]$ pwd
/Share/home/zhangqf5/gongjing/software/circos-tools-0.22/tools/tableviewer2
[zhangqf5@loginview02 tableviewer2]$ ll
total 40K
drwxr-x--- 2 zhangqf5 zhangqf 4.0K Jul  6  2017 batch
drwxr-x--- 2 zhangqf5 zhangqf 4.0K Aug  2  2017 bin
drwxr-x--- 2 zhangqf5 zhangqf 4.0K May 19 02:21 data
drwxr-x--- 2 zhangqf5 zhangqf 4.0K May 19 02:21 etc
drwxr-x--- 2 zhangqf5 zhangqf 4.0K Jul  6  2017 img
drwxr-x--- 2 zhangqf5 zhangqf 4.0K Jul  6  2017 lib
-rwxr----- 1 zhangqf5 zhangqf 2.4K Jul  6  2017 makeimage.py
drwxr-x--- 2 zhangqf5 zhangqf 4.0K Jul  6  2017 results
drwxr-x--- 2 zhangqf5 zhangqf 4.0K Jul  6  2017 samples
drwxr-x--- 2 zhangqf5 zhangqf 4.0K Jul  6  2017 uploads

[zhangqf5@loginview02 tableviewer2]$ python makeimage.py /Share/home/zhangqf5/gongjing/DNA-RNA-Protein-interaction-correlation-12-18/data/RRI_union_deduplicates.split_full.type_dis.human.txt
We get plot like this:

Issue: link direction ?
However, there is a issue. The connection between RNAs actually has no direction, thus the ribbon color from RNA1 to RNA2 must be the same as from RNA2 to RNA1. In the graph above, for example, there are two bands connect mRNA (red) and others (grey), but these two colors are different. In this case, we need to parse the data table to make all count values apear in only one side of the diagonal (upper or lower).
Data format conversion
Here is the function to transform the data format:
from nested_dict import nested_dict

def read_txt(txt='/Share/home/zhangqf5/gongjing/DNA-RNA-Protein-interaction-correlation-12-18/data/type_dis/RRI_union_deduplicates.split_full.type_dis.human.txt'):
	dis_dict = nested_dict(2, int)
	dis_revise_dict = nested_dict(2, int)
	with open(txt, 'r') as TXT:
		for n,line in enumerate(TXT):
			line = line.strip()
			print n,line
			if n == 0:
				dis_dict['row_order'] = line
			elif n == 1:
				dis_dict['row_color'] = line
			elif n == 2:
				dis_dict['row_rnas'] = line
				col_rna_ls = line.split()[1:]
			else:
				row_rna = line.split()[0]
				val_ls = map(float, line.split()[1:])
				for col_rna, val in zip(col_rna_ls, val_ls):
					dis_dict[row_rna][col_rna] = val
	print dis_dict

	rna_pair_ls = []
	for row_rna in col_rna_ls:
		for col_rna in col_rna_ls:
			dis_revise_dict[row_rna][col_rna] = 0

	for row_rna in col_rna_ls:
		for col_rna in col_rna_ls:
			rna_pair1 = row_rna + '-' + col_rna
			rna_pair2 = col_rna + '-' + row_rna
			if rna_pair1 in rna_pair_ls:
				continue
			if rna_pair2 in rna_pair_ls:
				continue
			rna_pair_ls.append(rna_pair1)
			rna_pair_ls.append(rna_pair2)
			dis_revise_dict[row_rna][col_rna] += dis_dict[row_rna][col_rna]
			if row_rna == col_rna:
				continue
			dis_revise_dict[row_rna][col_rna] += dis_dict[col_rna][row_rna]
	print dis_revise_dict

	savefn = txt.replace('txt', 'revise.txt')
	with open(savefn, 'w') as SAVEFN:
		print >>SAVEFN, dis_dict['row_order']
		print >>SAVEFN, dis_dict['row_color']
		print >>SAVEFN, dis_dict['row_rnas']
		for row_rna in col_rna_ls:
			row_rna_ls = [dis_revise_dict[row_rna][col_rna] for col_rna in col_rna_ls]
			print >>SAVEFN,row_rna+' '+' '.join(map(str, row_rna_ls))

	return savefn
After converting, we get the data with all value on upper triangle:
[zhangqf5@loginview02 data]$ cat RRI_union_deduplicates.split_full.type_dis.human.revise.txt
data 1 2 3 4 5 6 7 8 9
data 202,75,78 83,169,102 205,185,111 98,180,208 129,112,182 238,130,238 255,140,0 74,113,178 169,169,169
data proteinCoding lncRNA miRNA rRNA snoRNA snRNA tRNA NoncanonicalRNA others
proteinCoding 41863.0 14738.0 35981.0 15475.0 220.0 1690.0 88.0 9530.0 5612.0
lncRNA 0 1080.0 2288.0 341.0 61.0 261.0 3.0 1453.0 866.0
miRNA 0 0 36.0 17.0 8.0 24.0 1.0 1534.0 445.0
rRNA 0 0 0 360.0 321.0 56.0 30.0 169.0 157.0
snoRNA 0 0 0 0 299.0 115.0 7.0 128.0 22.0
snRNA 0 0 0 0 0 851.0 2.0 139.0 95.0
tRNA 0 0 0 0 0 0 210.0 4.0 28.0
NoncanonicalRNA 0 0 0 0 0 0 0 1132.0 533.0
others 0 0 0 0 0 0 0 0 400.0
Comparison of original & transformed data frame
That is:
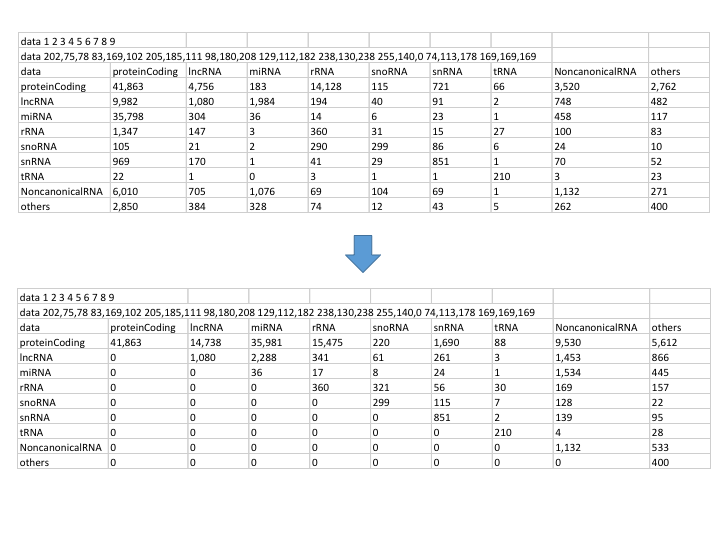
Then using these data we can visualize the links without direction as below:
If you link this blog, please refer to this page, thanks!
Post link:https://tsinghua-gongjing.github.io/posts/circos_tableview.html
Latest articles
Links
- ZhangLab , RISE database , THU life , THU info
- Data analysis: pandas , numpy , scipy
- ML/DL: sklearn , sklearn(中文) , pytorch
- Visualization: seaborn , matplotlib , gallery
- Github: me