目录
聚类的含义和类型
聚类(clustering):将相似的对象归到同一个簇中,将不相似对象归到不同簇,有点像全自动分类,是一种无监督的学习。sklearn提供了一个常见聚类算法的比较: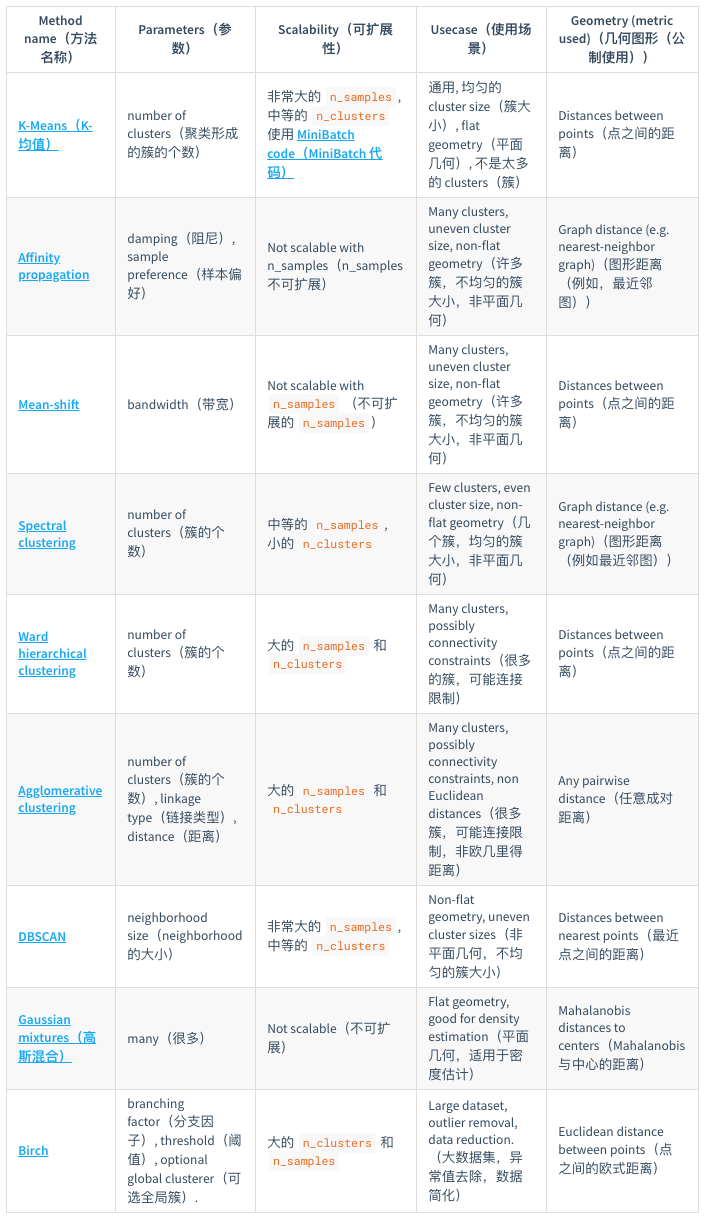
k-均值聚类
- K-均值聚类(K-means clustering):发现k个不同的簇,且每个簇的中心采用簇中所含值的均值计算而成(因此成为K-均值)。
- 簇识别(cluster identification):给出聚类结果的含义。
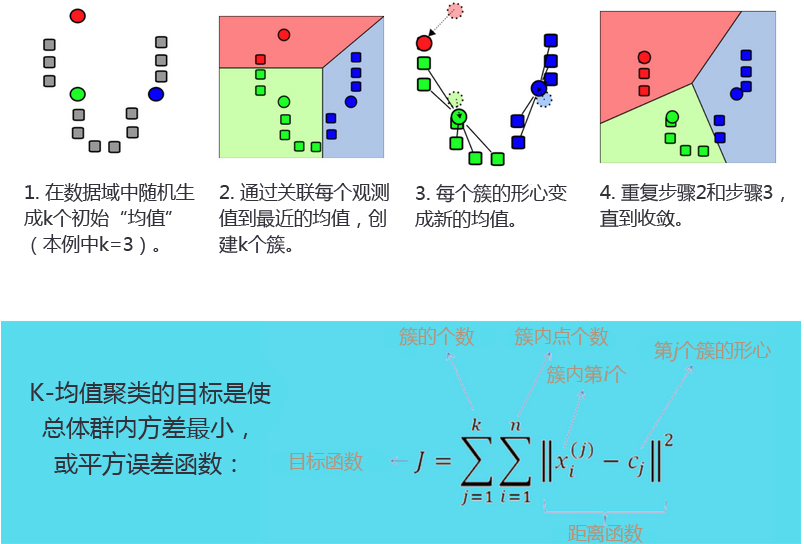
- K-均值聚类过程:
K-均值聚类的后处理
- 可能提高分类性能
- k的选择是否正确?误差和可用于评估聚类质量
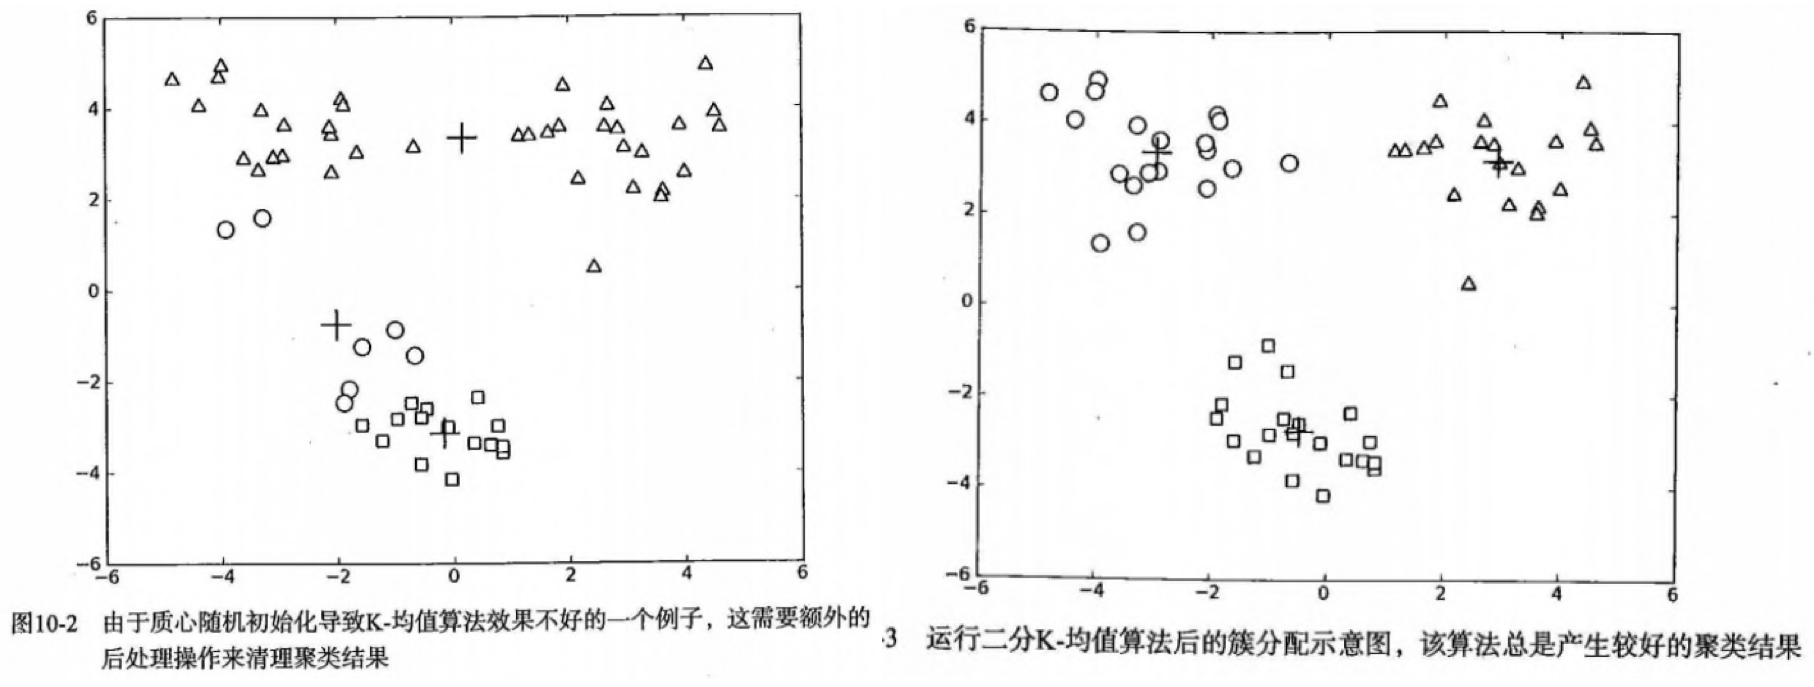
- 问题:聚类结果可能不准确,收敛于局部最优,而非全局最优。下面是一个例子:
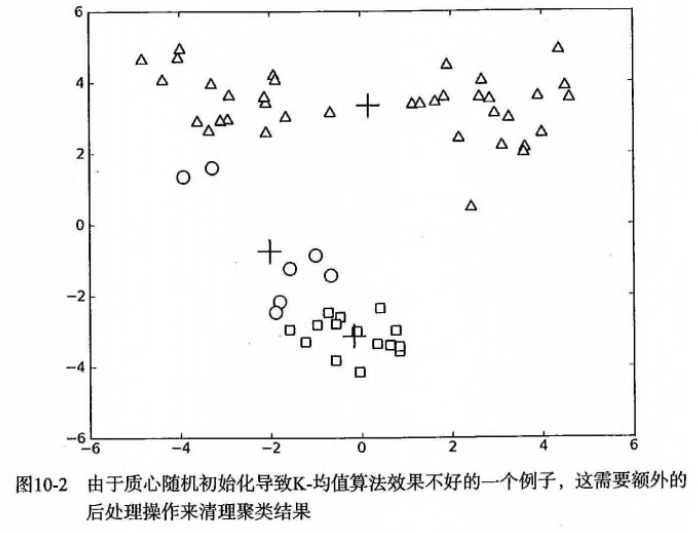
- 方案1:多尝试不同的随机初始化中心,看结果是否一致。【初始化的随机性会对结果产生影响】
- 方案2(二维):人为合并簇,比如上图中下面的两个簇(圆圈+方块)
- 方案2(高维):1)合并最近的质心,2)合并两个使得SSE增幅最小的质心。
二分K-均值聚类
- 二分K-均值(bisecting K-means):克服K-均值算法收敛于局部最小的问题
- 过程:1)将所有点看成一个簇,2)当簇数目小于指定数k时,对每个簇:计算总误差,进行k-均值聚类(k=2),计算将该簇一分为二后的总误差,3)选择使得误差最小的那个簇进行划分操作。
- 上面第(3)步是选择使得误差最小的那个簇进行划分操作。,也可以是所对误差平方和最大的簇(似乎更容易理解)进行再一次的划分,因为误差平方和越大,表示该簇聚类越不好,越有可能是多个簇被当成一个簇了,所以我们首先需要对这个簇进行划分。
- 属于层次聚类的一种,是分裂的想法:先是所有的都属于一类,再慢慢的分为更细的不同的类别。
- 效果:运行多次后会收敛到全局最小,比如在上面的数据集中效果更好。
Python源码版本
K-均值聚类:
def distEclud(vecA, vecB):
	""" 计算两数据点之间的距离,这里是欧式距离
	"""
    return sqrt(sum(power(vecA - vecB, 2))) #la.norm(vecA-vecB)

def randCent(dataSet, k):
	""" 随机初始化选取k个中心,注意这些点不是原来有的数据点
	"""
    n = shape(dataSet)[1]
    centroids = mat(zeros((k,n)))#create centroid mat
    for j in range(n):#create random cluster centers, within bounds of each dimension
        minJ = min(dataSet[:,j])
        rangeJ = float(max(dataSet[:,j]) - minJ)
        centroids[:,j] = mat(minJ + rangeJ * random.rand(k,1))
    return centroids

def kMeans(dataSet, k, distMeas=distEclud, createCent=randCent):
    m = shape(dataSet)[0]
    clusterAssment = mat(zeros((m,2)))#create mat to assign data points
                                      #to a centroid, also holds SE of each point
    centroids = createCent(dataSet, k)
    clusterChanged = True
    while clusterChanged:
        clusterChanged = False
        for i in range(m):#for each data point assign it to the closest centroid
            minDist = inf; minIndex = -1
            for j in range(k):
                distJI = distMeas(centroids[j,:],dataSet[i,:])
                if distJI < minDist:
                    minDist = distJI; minIndex = j
            if clusterAssment[i,0] != minIndex: clusterChanged = True
            clusterAssment[i,:] = minIndex,minDist**2
        print centroids
        for cent in range(k):#recalculate centroids
            ptsInClust = dataSet[nonzero(clusterAssment[:,0].A==cent)[0]]#get all the point in this cluster
            centroids[cent,:] = mean(ptsInClust, axis=0) #assign centroid to mean
    return centroids, clusterAssment
二分 K-均值聚类:
def biKmeans(dataSet, k, distMeas=distEclud):
    m = shape(dataSet)[0]
    clusterAssment = mat(zeros((m,2)))
    centroid0 = mean(dataSet, axis=0).tolist()[0]
    centList =[centroid0] #create a list with one centroid
    for j in range(m):#calc initial Error
        clusterAssment[j,1] = distMeas(mat(centroid0), dataSet[j,:])**2
    while (len(centList) < k):
        lowestSSE = inf
        for i in range(len(centList)):
            ptsInCurrCluster = dataSet[nonzero(clusterAssment[:,0].A==i)[0],:]#get the data points currently in cluster i
            centroidMat, splitClustAss = kMeans(ptsInCurrCluster, 2, distMeas)
            sseSplit = sum(splitClustAss[:,1])#compare the SSE to the currrent minimum
            sseNotSplit = sum(clusterAssment[nonzero(clusterAssment[:,0].A!=i)[0],1])
            print "sseSplit, and notSplit: ",sseSplit,sseNotSplit
            if (sseSplit + sseNotSplit) < lowestSSE:
                bestCentToSplit = i
                bestNewCents = centroidMat
                bestClustAss = splitClustAss.copy()
                lowestSSE = sseSplit + sseNotSplit
        bestClustAss[nonzero(bestClustAss[:,0].A == 1)[0],0] = len(centList) #change 1 to 3,4, or whatever
        bestClustAss[nonzero(bestClustAss[:,0].A == 0)[0],0] = bestCentToSplit
        print 'the bestCentToSplit is: ',bestCentToSplit
        print 'the len of bestClustAss is: ', len(bestClustAss)
        centList[bestCentToSplit] = bestNewCents[0,:].tolist()[0]#replace a centroid with two best centroids
        centList.append(bestNewCents[1,:].tolist()[0])
        clusterAssment[nonzero(clusterAssment[:,0].A == bestCentToSplit)[0],:]= bestClustAss#reassign new clusters, and SSE
    return mat(centList), clusterAssment
sklearn版本
对二维数据点进行聚类:
from sklearn.cluster import KMeans
import numpy as np
X = np.array([[1, 2], [1, 4], [1, 0],
              [10, 2], [10, 4], [10, 0]])
kmeans = KMeans(n_clusters=2, random_state=0).fit(X)
kmeans.labels_
# array([1, 1, 1, 0, 0, 0], dtype=int32)

kmeans.predict([[0, 0], [12, 3]])
# array([1, 0], dtype=int32)

kmeans.cluster_centers_
# array([[10.,  2.],
#       [ 1.,  2.]])
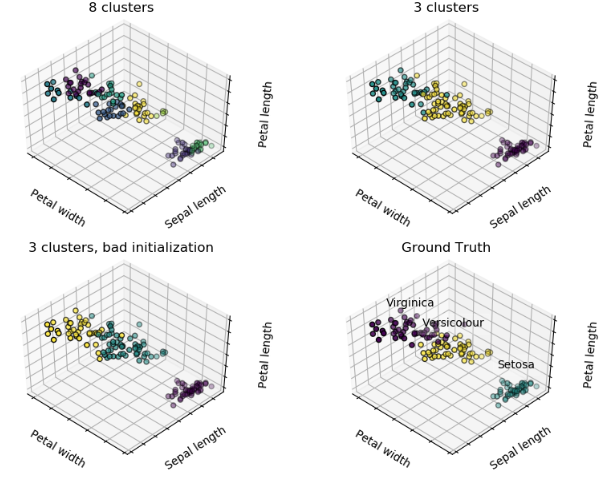
对iris数据集进行聚类并与真实的进行可视化比较:
# Code source: Gaël Varoquaux
# Modified for documentation by Jaques Grobler
# License: BSD 3 clause

import numpy as np
import matplotlib.pyplot as plt
# Though the following import is not directly being used, it is required
# for 3D projection to work
from mpl_toolkits.mplot3d import Axes3D

from sklearn.cluster import KMeans
from sklearn import datasets

np.random.seed(5)

iris = datasets.load_iris()
X = iris.data
y = iris.target

estimators = [('k_means_iris_8', KMeans(n_clusters=8)),
              ('k_means_iris_3', KMeans(n_clusters=3)),
              ('k_means_iris_bad_init', KMeans(n_clusters=3, n_init=1,
                                               init='random'))]

fignum = 1
titles = ['8 clusters', '3 clusters', '3 clusters, bad initialization']
for name, est in estimators:
    fig = plt.figure(fignum, figsize=(4, 3))
    ax = Axes3D(fig, rect=[0, 0, .95, 1], elev=48, azim=134)
    est.fit(X)
    labels = est.labels_

    ax.scatter(X[:, 3], X[:, 0], X[:, 2],
               c=labels.astype(np.float), edgecolor='k')

    ax.w_xaxis.set_ticklabels([])
    ax.w_yaxis.set_ticklabels([])
    ax.w_zaxis.set_ticklabels([])
    ax.set_xlabel('Petal width')
    ax.set_ylabel('Sepal length')
    ax.set_zlabel('Petal length')
    ax.set_title(titles[fignum - 1])
    ax.dist = 12
    fignum = fignum + 1

# Plot the ground truth
fig = plt.figure(fignum, figsize=(4, 3))
ax = Axes3D(fig, rect=[0, 0, .95, 1], elev=48, azim=134)

for name, label in [('Setosa', 0),
                    ('Versicolour', 1),
                    ('Virginica', 2)]:
    ax.text3D(X[y == label, 3].mean(),
              X[y == label, 0].mean(),
              X[y == label, 2].mean() + 2, name,
              horizontalalignment='center',
              bbox=dict(alpha=.2, edgecolor='w', facecolor='w'))
# Reorder the labels to have colors matching the cluster results
y = np.choose(y, [1, 2, 0]).astype(np.float)
ax.scatter(X[:, 3], X[:, 0], X[:, 2], c=y, edgecolor='k')

ax.w_xaxis.set_ticklabels([])
ax.w_yaxis.set_ticklabels([])
ax.w_zaxis.set_ticklabels([])
ax.set_xlabel('Petal width')
ax.set_ylabel('Sepal length')
ax.set_zlabel('Petal length')
ax.set_title('Ground Truth')
ax.dist = 12

fig.show()
选择合适的K,可参考这里:
from sklearn.cluster import KMeans
from sklearn import metrics
from nested_dict import nested_dict

silhouette_score_dict = nested_dict(1, int)
for k in range(3, 15):
    kmeans_model = KMeans(n_clusters=k, random_state=0).fit(df_select_01)
    silhouette_score = metrics.silhouette_score(df_select_01, kmeans_model.labels_,metric='euclidean')
    print(k, silhouette_score)
    silhouette_score_dict[k] = silhouette_score
参考
- 机器学习实战第10章
- K-means Clustering@sklearn
If you link this blog, please refer to this page, thanks!
Post link:https://tsinghua-gongjing.github.io/posts/K-means.html
Previous:
树回归算法
Next:
Apriori关联分析
Latest articles
Links
- ZhangLab , RISE database , THU life , THU info
- Data analysis: pandas , numpy , scipy
- ML/DL: sklearn , sklearn(中文) , pytorch
- Visualization: seaborn , matplotlib , gallery
- Github: me
