Data Structure Visualizations
- link: https://www.cs.usfca.edu/~galles/visualization/Algorithms.html
- 优点:
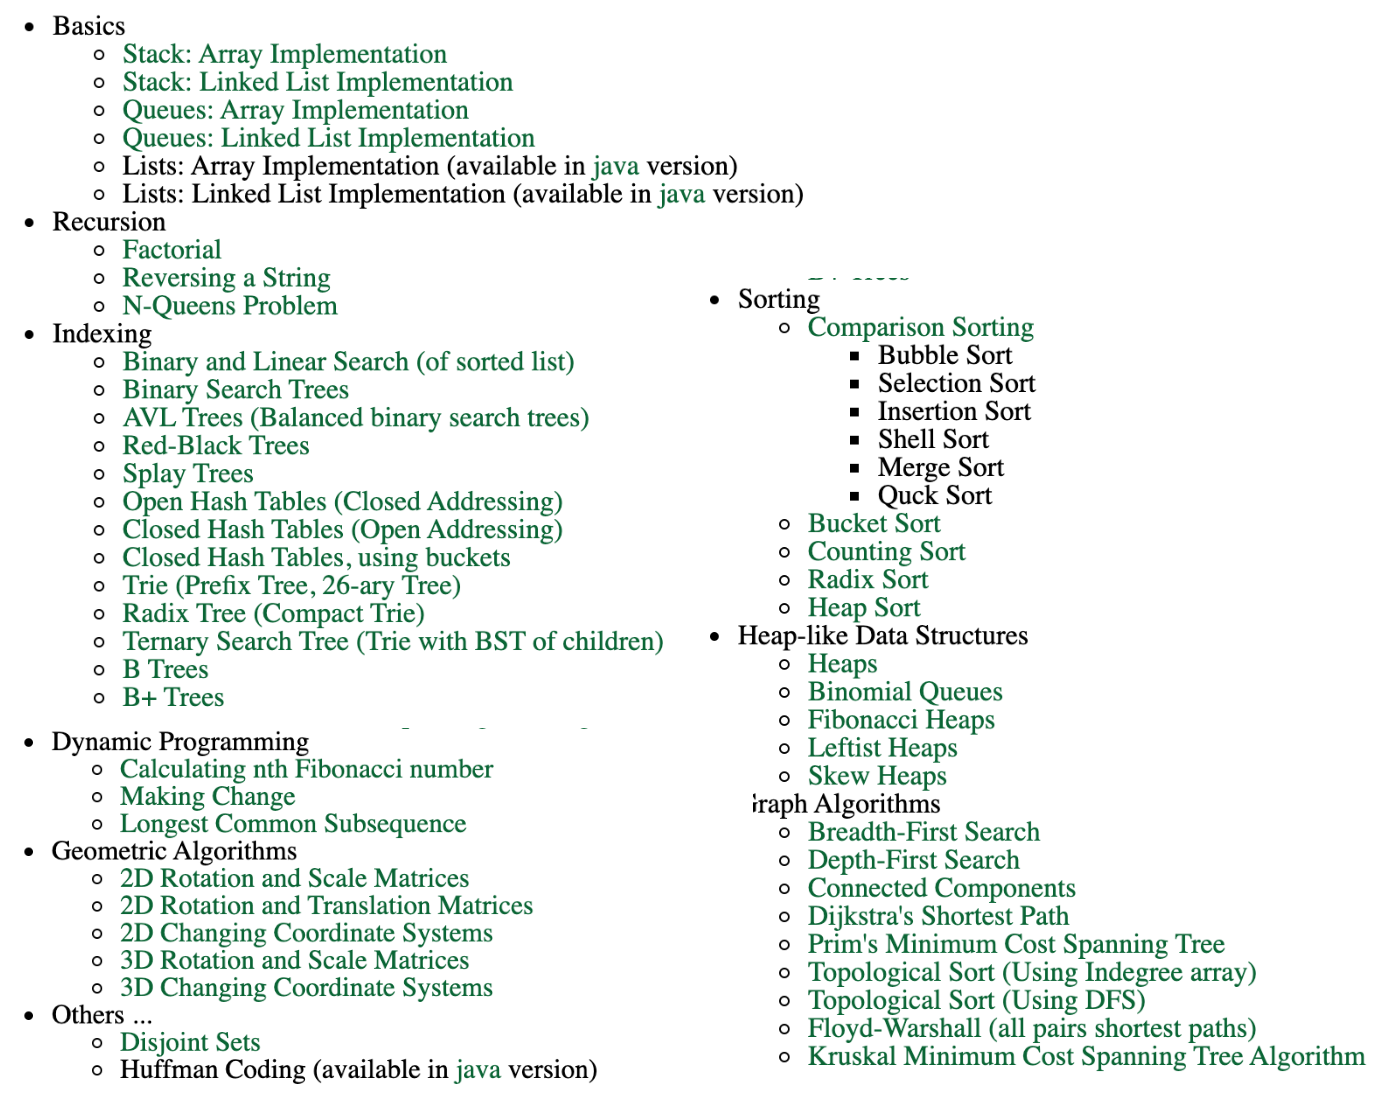
- 这是比较全面的包含了,基本的数据结构和算法的演示
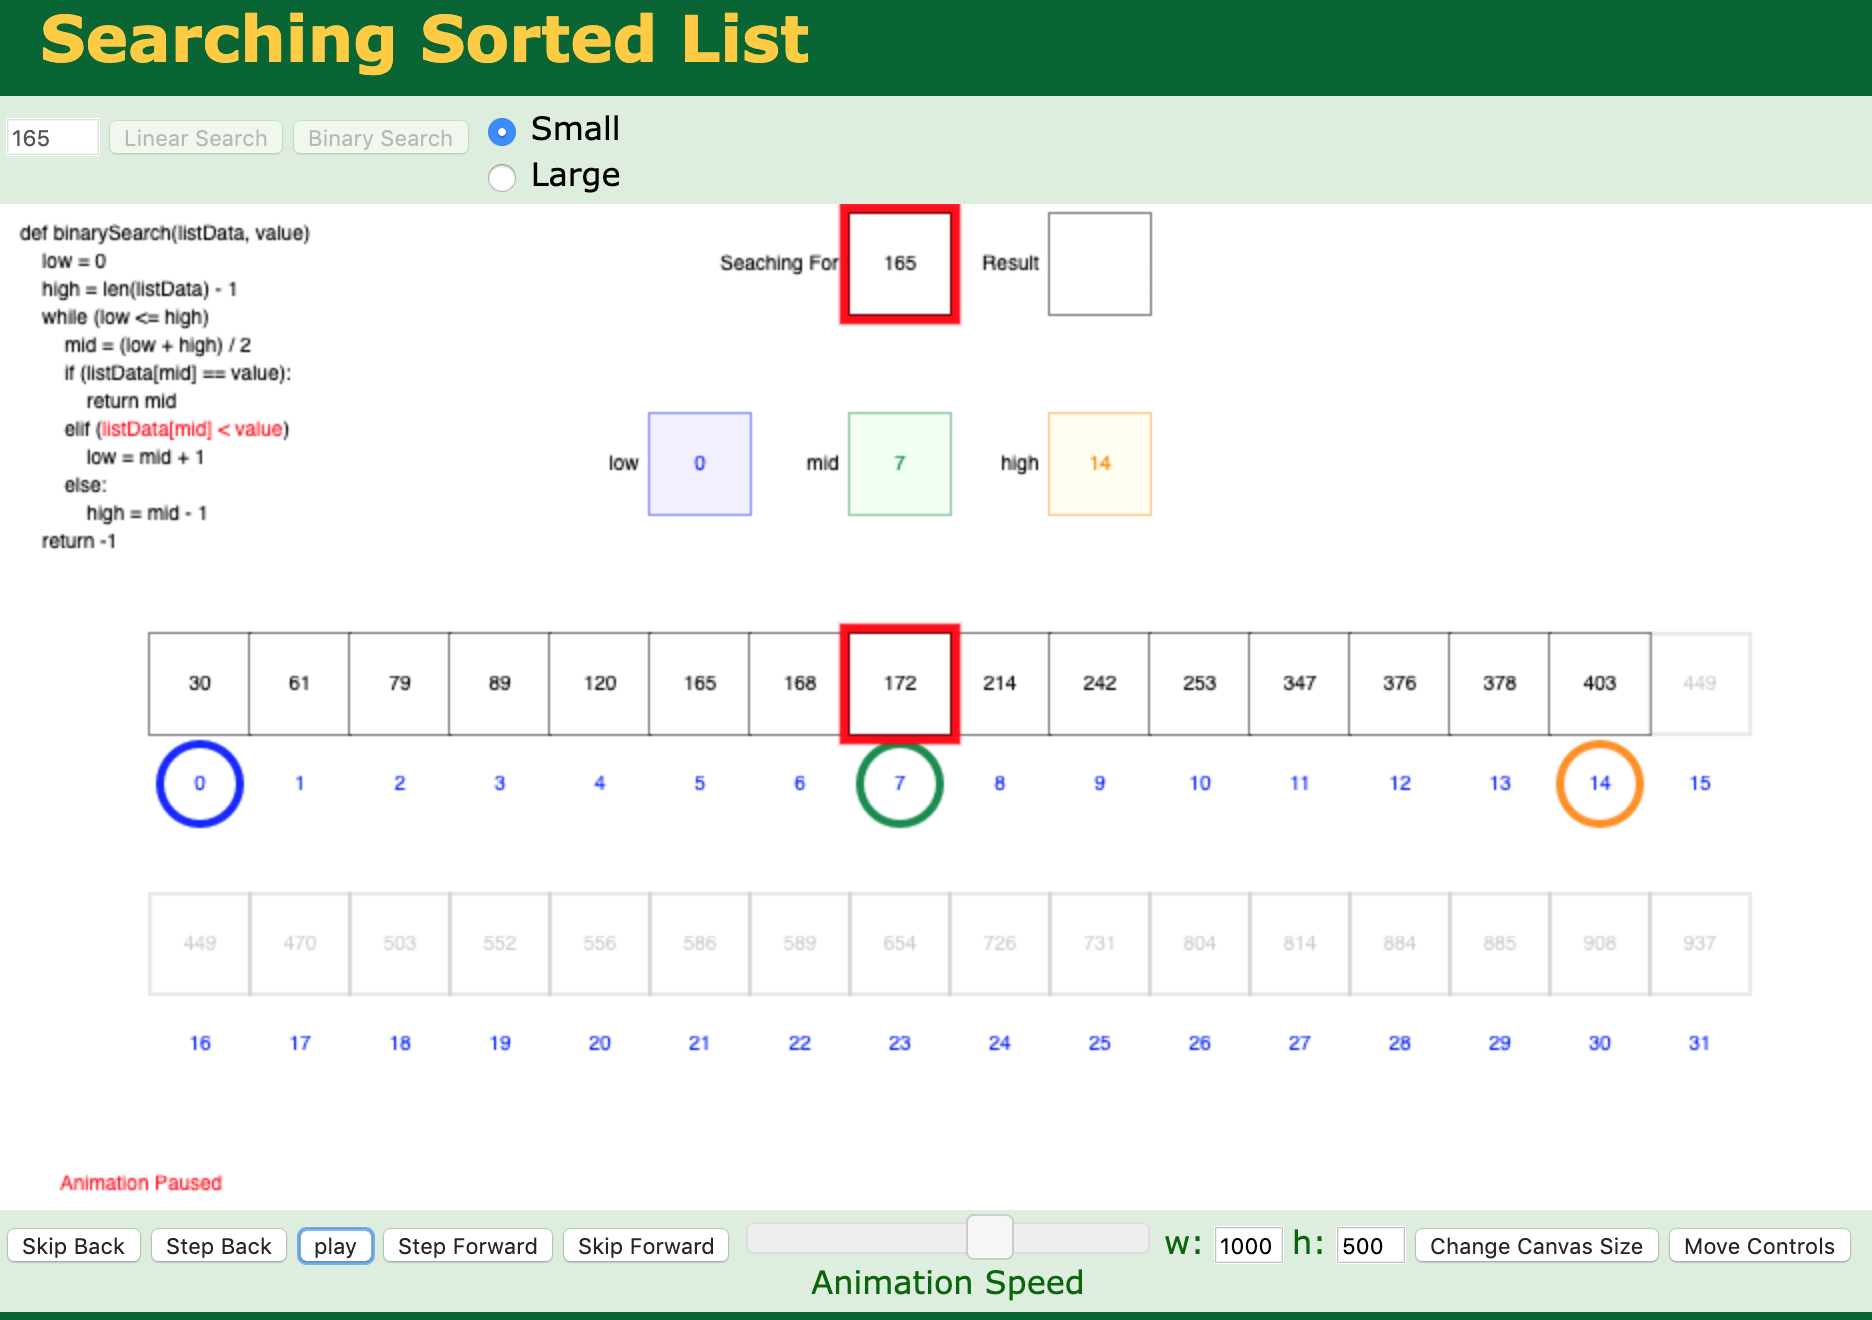
- 演示的界面包含python写的代码
- 缺点:界面比较古老
- 内容列表:
- 二分查找演示界面:
algorithm-visualizer
- link: https://algorithm-visualizer.org/
- 优点:
- 内容全面
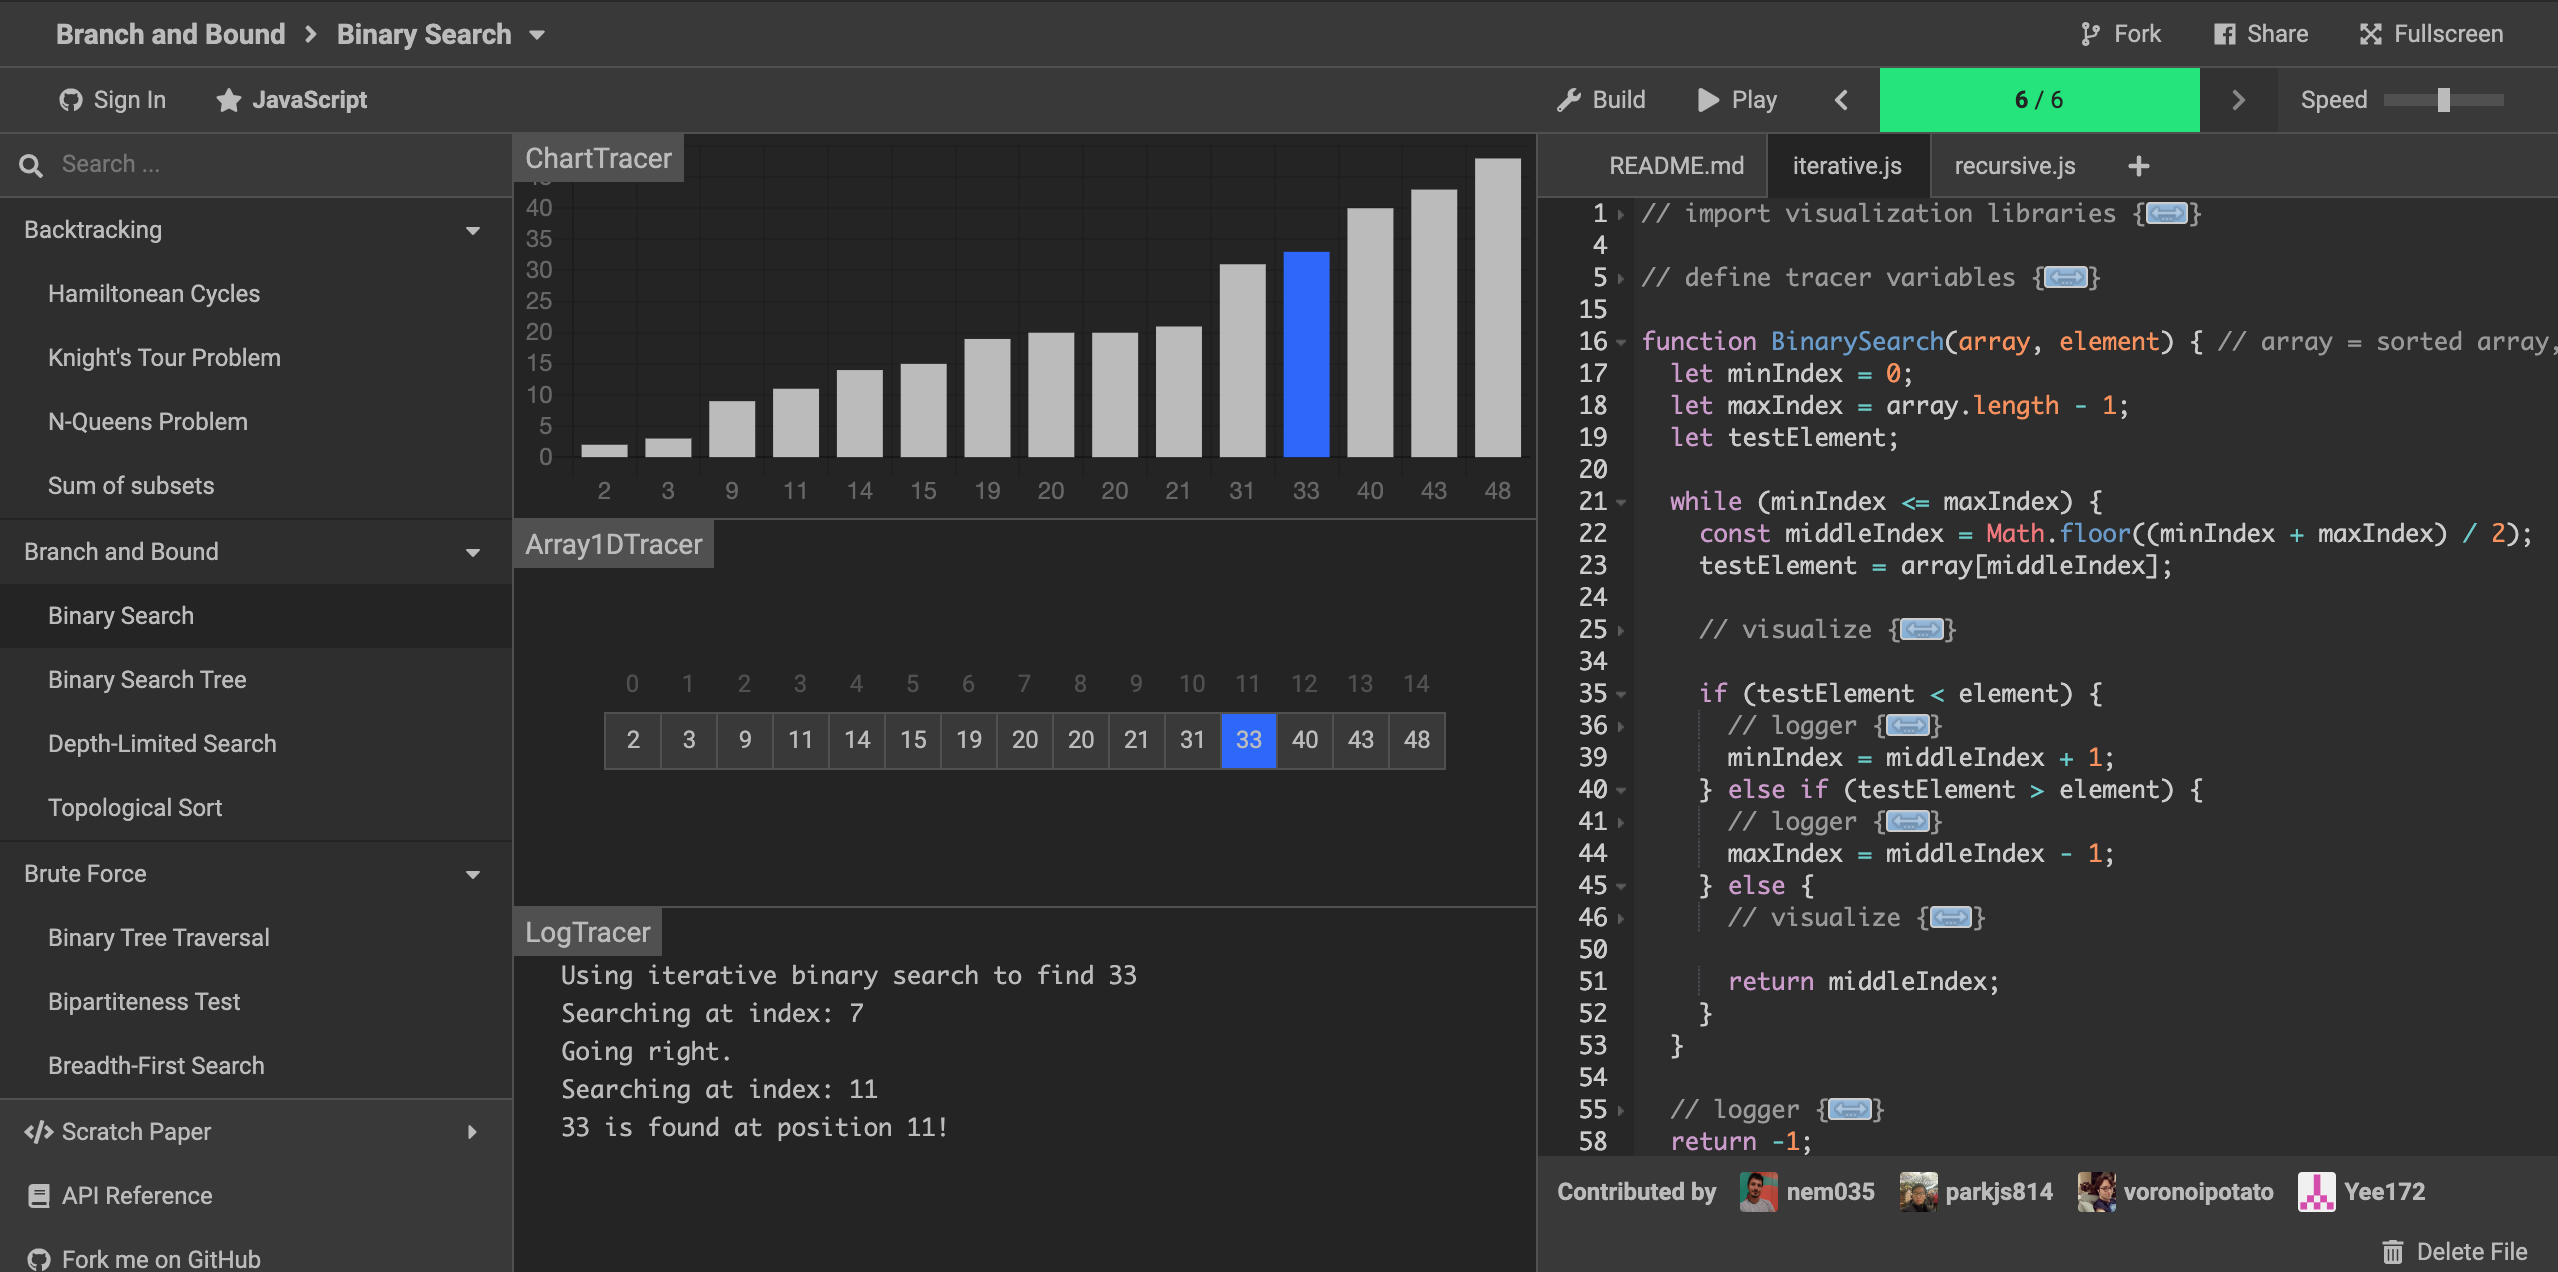
- 界面现代化程度高,比较精美
- 缺点:
- 代码支持三种:Java,C++,JavaScript
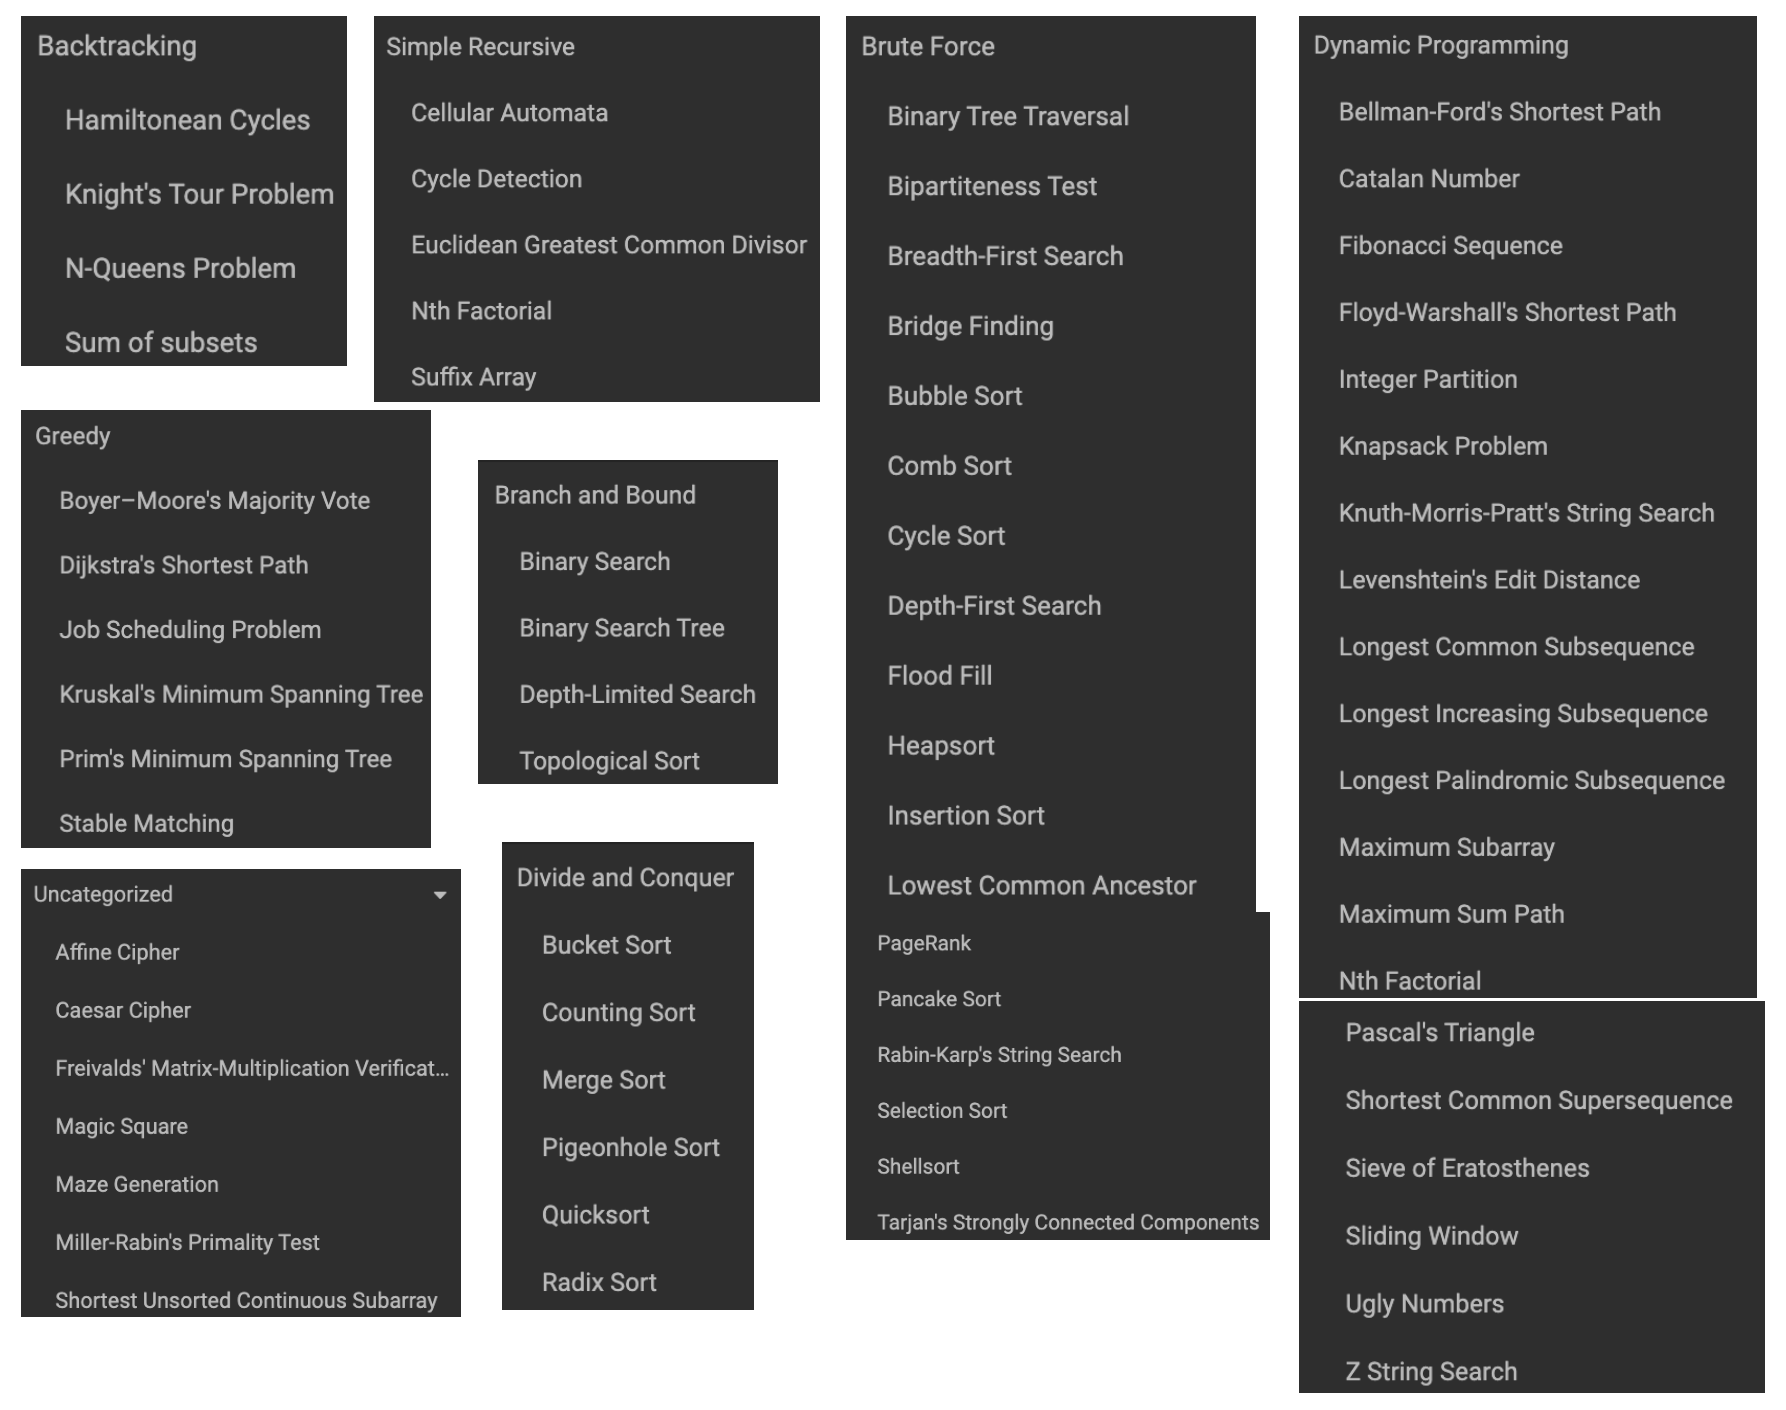
- 内容列表:
- 二分查找演示界面:
VisuAlgo
- link: https://visualgo.net/en
- 优点:
- 支持多种语言的界面,英文+中文等
- 涉及的内存全面
- 缺点:
- 主要包含算法,缺少数据结构的演示
- 基本的算法没有,比如二分查找
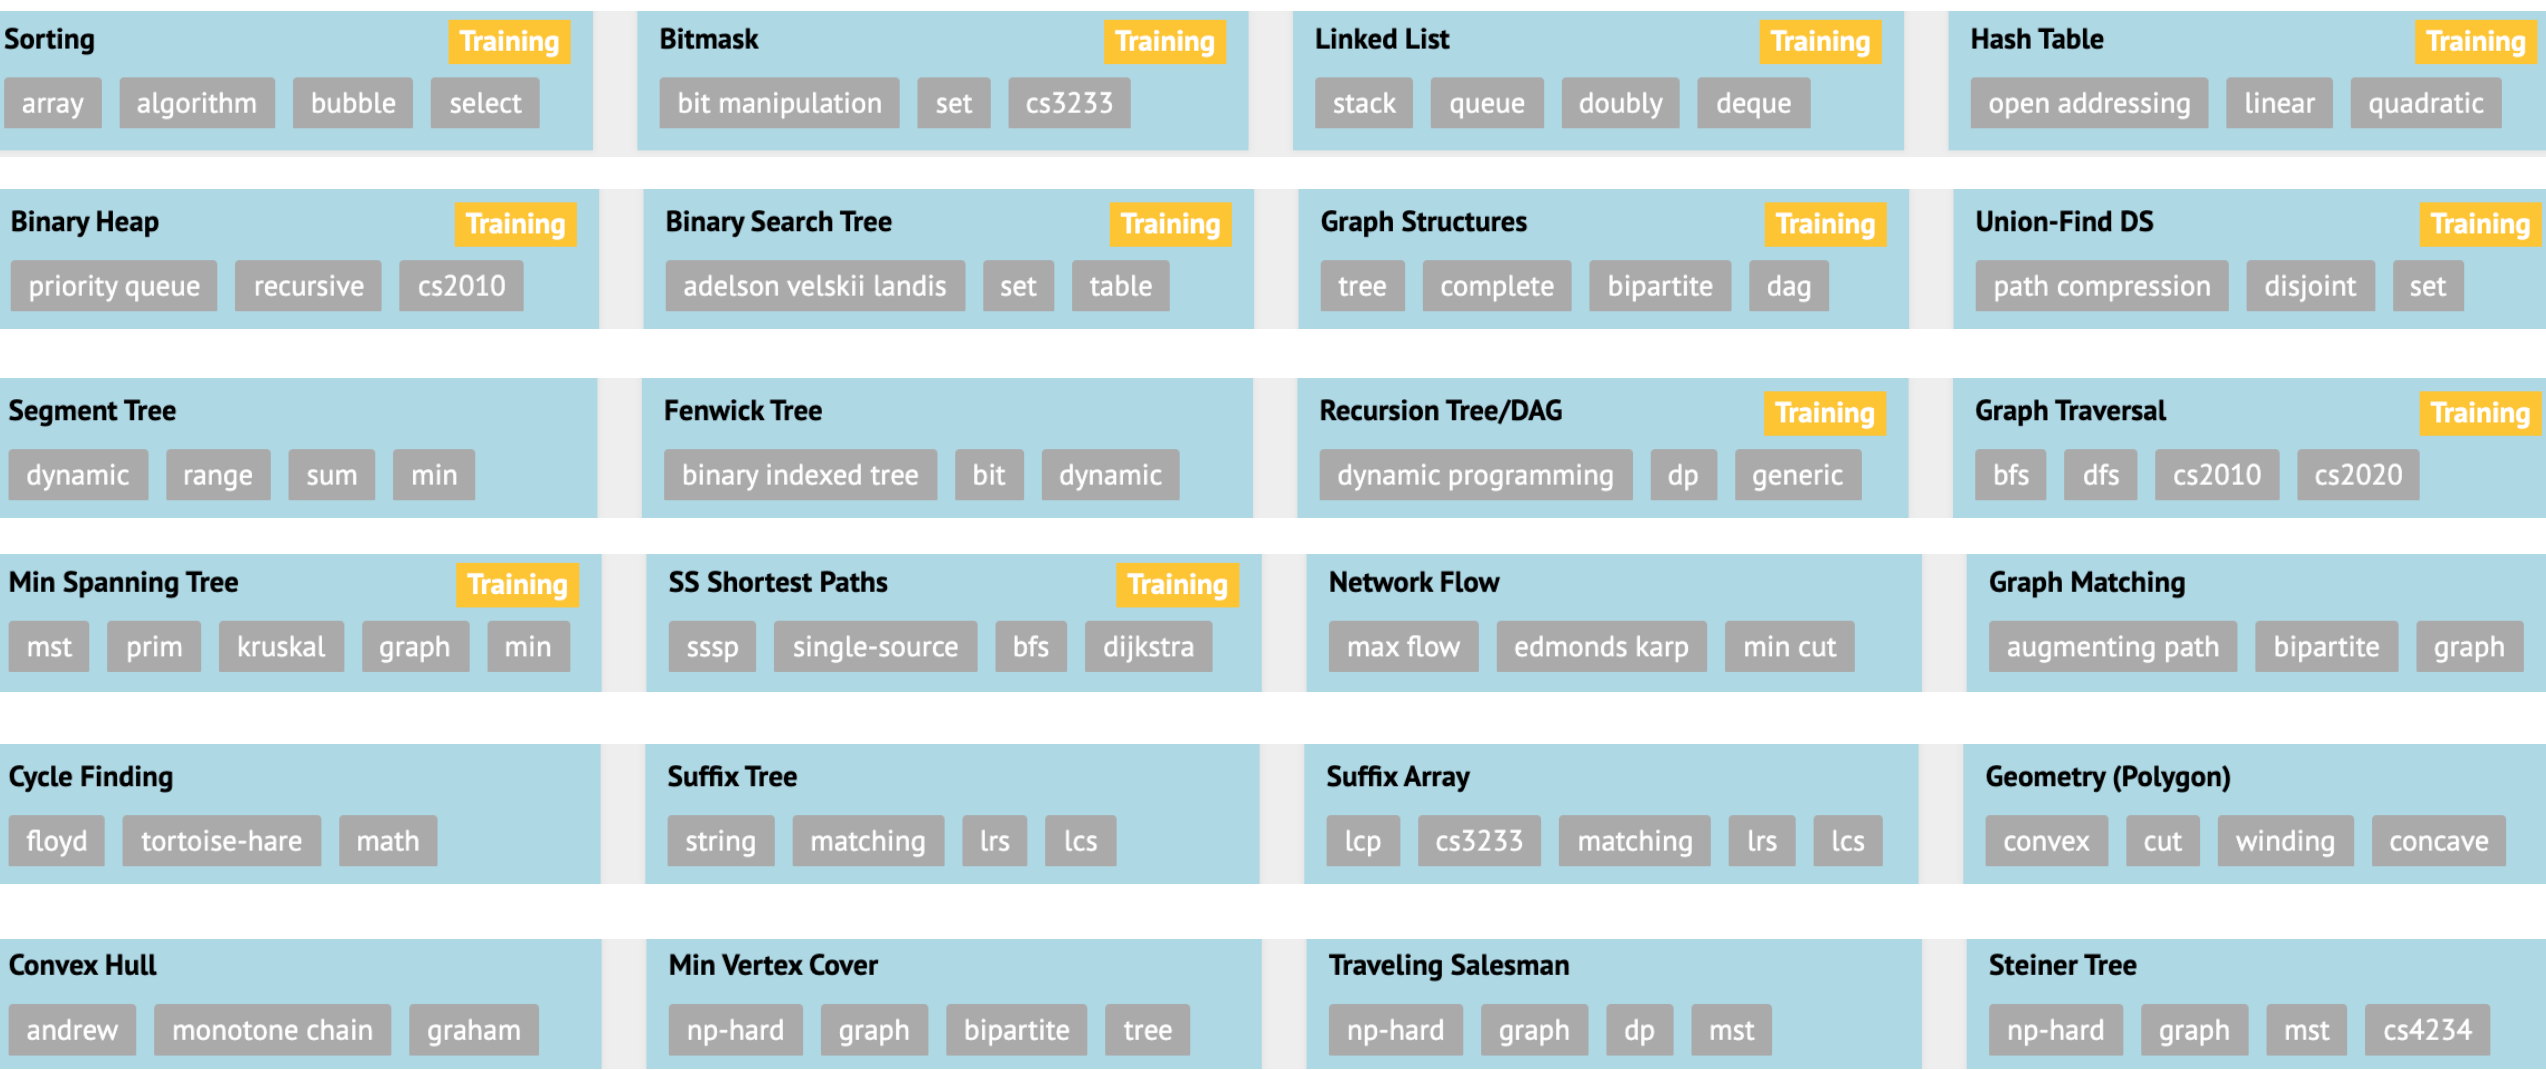
- 内容列表:
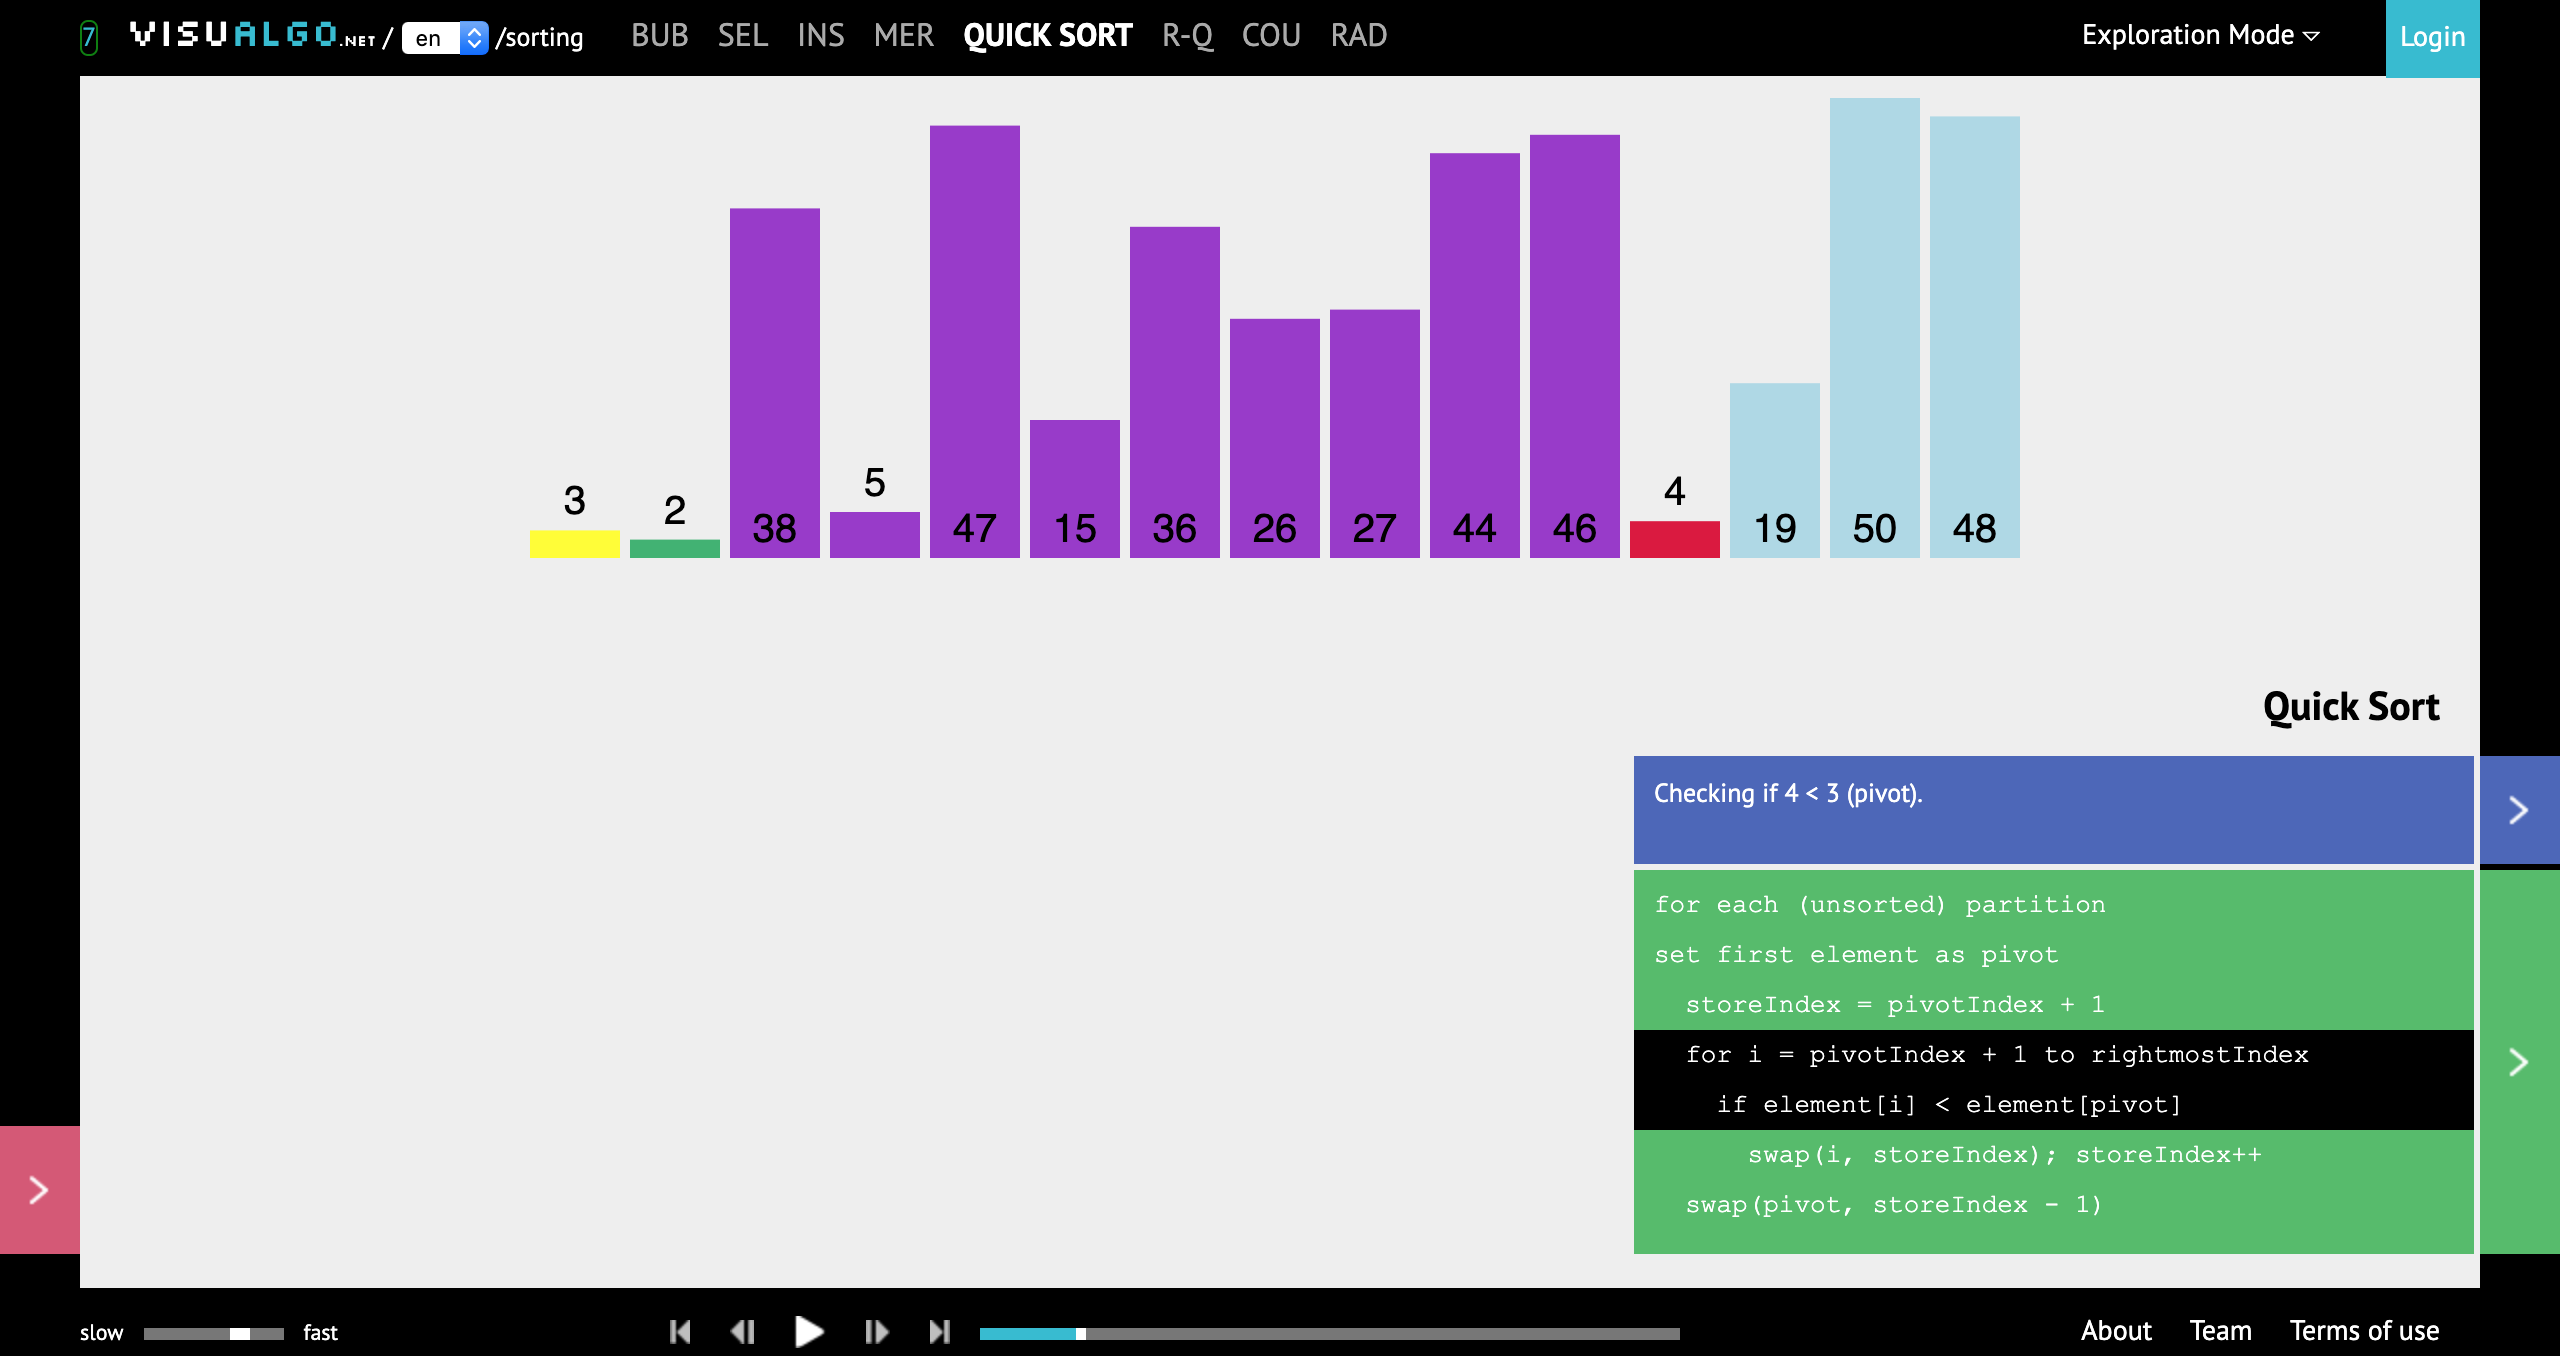
- 快速排序演示界面:
If you link this blog, please refer to this page, thanks!
Post link:https://tsinghua-gongjing.github.io/posts/algorithm-visualization.html
Previous:
Set up config for jupyter notebook
Next:
Line plot
Latest articles
Links
- ZhangLab , RISE database , THU life , THU info
- Data analysis: pandas , numpy , scipy
- ML/DL: sklearn , sklearn(中文) , pytorch
- Visualization: seaborn , matplotlib , gallery
- Github: me