jupyter notebook的配置
新建配置文件
参考这篇文章,对自己的notebook进行配置,方便快捷。比如可以在打开notebook时直接先加载一些模块等。
# creat新建配置文件
gongjing@MBP ~/.ipython/profile_default % ipython profile create
[ProfileCreate] Generating default config file: u'/Users/gongjing/.ipython/profile_default/ipython_config.py'
[ProfileCreate] Generating default config file: u'/Users/gongjing/.ipython/profile_default/ipython_kernel_config.py'
gongjing@MBP ~/.ipython/profile_default % ll
total 16304
drwxr-xr-x  2 gongjing  staff    68B Jun 18  2016 db
-rw-r--r--  1 gongjing  staff   7.9M Feb 10 09:42 history.sqlite
-rw-r--r--  1 gongjing  staff    22K Feb 10 09:43 ipython_config.py
-rw-r--r--  1 gongjing  staff    18K Feb 10 09:43 ipython_kernel_config.py
drwxr-xr-x  2 gongjing  staff    68B Jun 18  2016 log
drwx------  2 gongjing  staff    68B Jun 18  2016 pid
drwx------  2 gongjing  staff    68B Jun 18  2016 security
drwxr-xr-x  3 gongjing  staff   102B Jun 18  2016 startup
ipython_config.py 这个文件是配置ipython的;
ipython_kernel_config.py 这个文件是配置notebook的;
编辑配置文件
加载常用模块,matplot设置成inline
# Configuration file for ipython-kernel.

c = get_config()

c.InteractiveShellApp.exec_lines = [
        "import pandas as pd",
        "import numpy as np",
        "import scipy.stats as spstats",
        "import scipy as sp",
        "import matplotlib.pyplot as plt",
        "import seaborn as sns",
        "sns.set(style='white')",
        "sns.set_context('poster')",
        ]

c.IPKernelApp.matplotlib = 'inline'
Connect notebook server
# login the server
$ ssh -X -p 12000 zhangqf7@166.111.152.116

$ export PYTHONPATH=~/anaconda2/lib/python2.7/site-packages

# specify a port
$ jupyter-notebook --port 9988

# local
$ ssh -N -f -L localhost:9987:localhost:9988 zhangqf7@166.111.152.116 -p 12000

# type url: localhost:9987
# may need token
自动生成目录
主要是参考这里 为Jupyter Notebook添加目录:
# 安装后重启
~/anaconda3/bin/conda install -c conda-forge jupyter_contrib_nbextensions
添加R kernel
install.packages(c('repr', 'IRdisplay', 'evaluate', 'crayon', 'pbdZMQ', 'devtools', 'uuid', 'digest'))
devtools::install_github('IRkernel/IRkernel')

# 只在当前用户下安装(在集群上安装)
IRkernel::installspec()
# 或者是在系统下安装
IRkernel::installspec(user = FALSE)
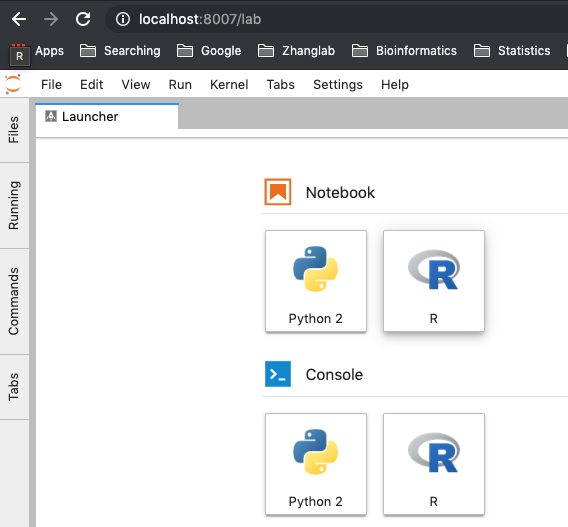
比如是在集群上安装的,之后打开jupyter-lab后,可以看到启动界面多了一个R的选择:
df禁用科学计数法
有时在显示df(比如head,describe),数字会以科学计数法的方式展现,而不知道具体的比如百分比数字大小,可以设置禁用科学计数法表示:
pd.set_option('display.float_format',lambda x : '%.2f' % x)
显示df而不是print
通过下面的display命令可以将df显示为带有表格的table,而不是直接打印print(df)的效果:
from IPython.display import display
display(df)
快捷键
- code block左缩进:
shift+tab,参考这里 - 切换不同的notebook tab:
ctl+shift+[左切,ctl+shift+]右切 - 设置:
C+arrowUp将cell上移动,C+arrowDown将cell上移动,O将cell的输出collapse,OO将cell的输出拓展开。首先要使用esc退出编辑模式,进入命令模式。{ // Move cell up "shortcuts": [ { "selector": ".jp-Notebook:focus", "command": "notebook:move-cell-up", "keys": [ "C", "ArrowUp" ] }, // Move cell down { "selector": ".jp-Notebook:focus", "command": "notebook:move-cell-down", "keys": [ "C", "ArrowDown" ] }, { "command": "notebook:hide-cell-outputs", "keys": [ "O" ], "selector": ".jp-Notebook:focus" }, { "command": "notebook:show-cell-outputs", "keys": [ "O", "O" ], "selector": ".jp-Notebook:focus" }, ] }
df显示时指定千分位符号
参考这里:
# for all columns
df.head().style.format("{:,.0f}")

# per column
df.head().style.format({"col1": "{:,.0f}", "col2": "{:,.0f}"})
If you link this blog, please refer to this page, thanks!
Post link:https://tsinghua-gongjing.github.io/posts/jupyter_notebook.html
Previous:
Bubble plot
Next:
Algorithm: 数据结构和算法的可视化
Latest articles
Links
- ZhangLab , RISE database , THU life , THU info
- Data analysis: pandas , numpy , scipy
- ML/DL: sklearn , sklearn(中文) , pytorch
- Visualization: seaborn , matplotlib , gallery
- Github: me