plot use sns.jointplot
tips = sns.load_dataset("tips")
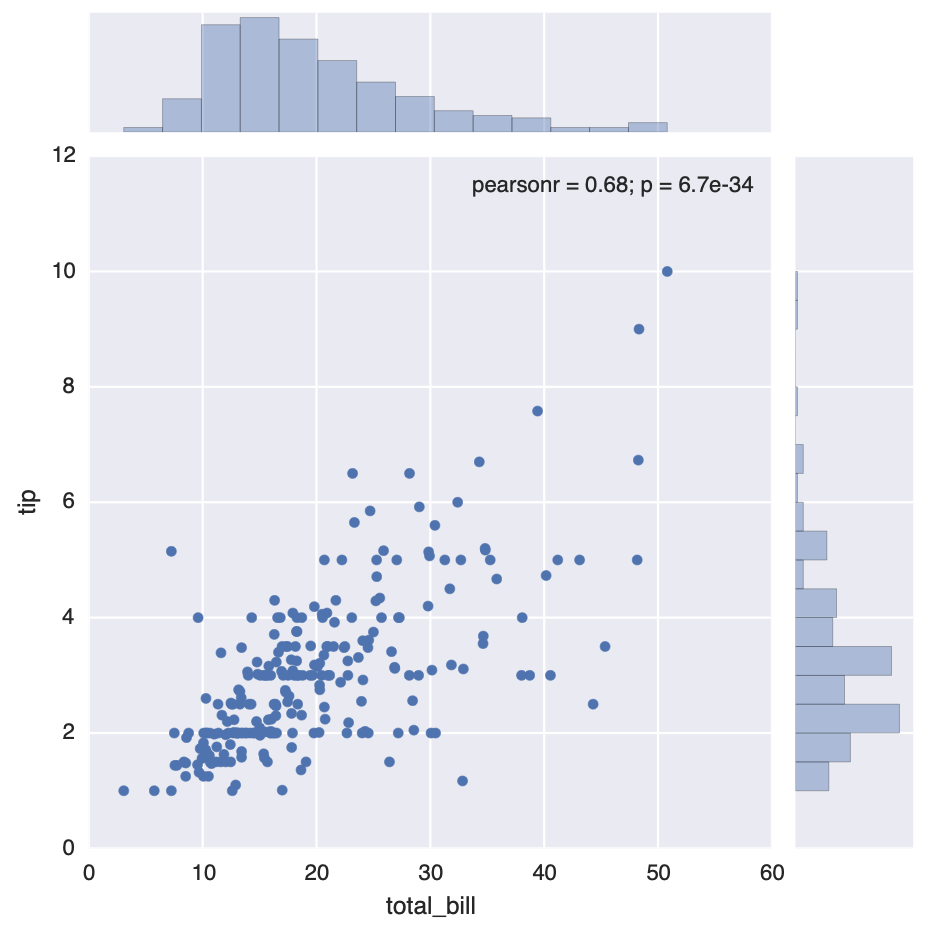
g = sns.jointplot(x="total_bill", y="tip", data=tips)
If you link this blog, please refer to this page, thanks!
Post link:https://tsinghua-gongjing.github.io/posts/jointplot.html
Previous:
Use IGV to load .bed track file
Next:
Volcano plot
Latest articles
Links
- ZhangLab , RISE database , THU life , THU info
- Data analysis: pandas , numpy , scipy
- ML/DL: sklearn , sklearn(中文) , pytorch
- Visualization: seaborn , matplotlib , gallery
- Github: me