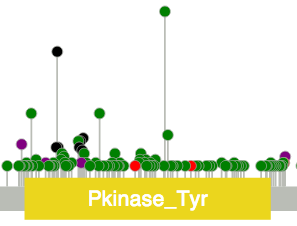
A lollipop(棒糖) plot is an hybrid between a scatter plot and a barplot, which is used to show amino acid mutation along a protein sequence. An example as below:

lillopop gally also show the basic usage of python to achieve this.
# library
 import matplotlib.pyplot as plt
 import numpy as np

# create data
 x=range(1,41)
 values=np.random.uniform(size=40)

# stem function: first way
 plt.stem(x, values)
 plt.ylim(0, 1.2)
 #plt.show()

# stem function: If no X provided, a sequence of numbers is created by python:
 plt.stem(values)
 #plt.show()

# stem function: second way
 (markerline, stemlines, baseline) = plt.stem(x, values)
 plt.setp(baseline, visible=False)
 #plt.show()

If you link this blog, please refer to this page, thanks!
Post link:https://tsinghua-gongjing.github.io/posts/lollipopplot.html
Previous:
Coordinate systems in different file formats
Next:
Area plot
Latest articles
Links
- ZhangLab , RISE database , THU life , THU info
- Data analysis: pandas , numpy , scipy
- ML/DL: sklearn , sklearn(中文) , pytorch
- Visualization: seaborn , matplotlib , gallery
- Github: me