Explore overlapping landscape between multiple data sets
- Interactive set visualization for more than three sets
- R: UpSetR manual
- Python: py-upset manual
- Overlap multiple bed: HOMER_mergePeaks_venn_UpSetR, biostar
UpSetR input file format:
# 每一行代表一个entry,每一列代表所在集合是否出现,1(出现),0(不出现)
$ head all.base.0.1.set.test.txt
NM_212989-2160  0       0       0       0       1
NM_200657-769   0       1       1       1       0
NM_200657-768   1       1       1       1       0
NM_200657-765   0       1       1       0       0
NM_200657-764   0       1       1       0       0
NM_200657-767   1       0       1       1       0
NM_200657-766   0       1       1       1       0
NM_200657-761   1       1       0       1       0
NM_200657-760   0       1       1       1       0
NM_200657-763   0       1       0       0       0
Define parameters and run UpSetR:
library("UpSetR")

t = './all.base.set.txt'
savefn = paste(t, '.pdf', sep='')

df = read.table(t, sep='\t', header=FALSE, row.names=1)
names(df) = c('set1', 'set2', 'set3', 'set4', 'set5')
print(head(df))


pdf(savefn, width=24, height=16)

upset(df, sets=c('set1', 'set2', 'set3', 'set4', 'set5'),
		sets.bar.color = "grey",
		order.by = "degree",
		decreasing = "F",
		empty.intersections = NULL, # on: show empty intersect
		keep.order=TRUE,
		number.angles=0,
		point.size = 8.8,
		line.size = 3,
		scale.intersections="identity",
		mb.ratio = c(0.7, 0.3),
		nintersects=NA,
		text.scale=c(5,5,5,3,5,5),
		show.numbers="no",
		set_size.angles=90
		)
An example output like this:

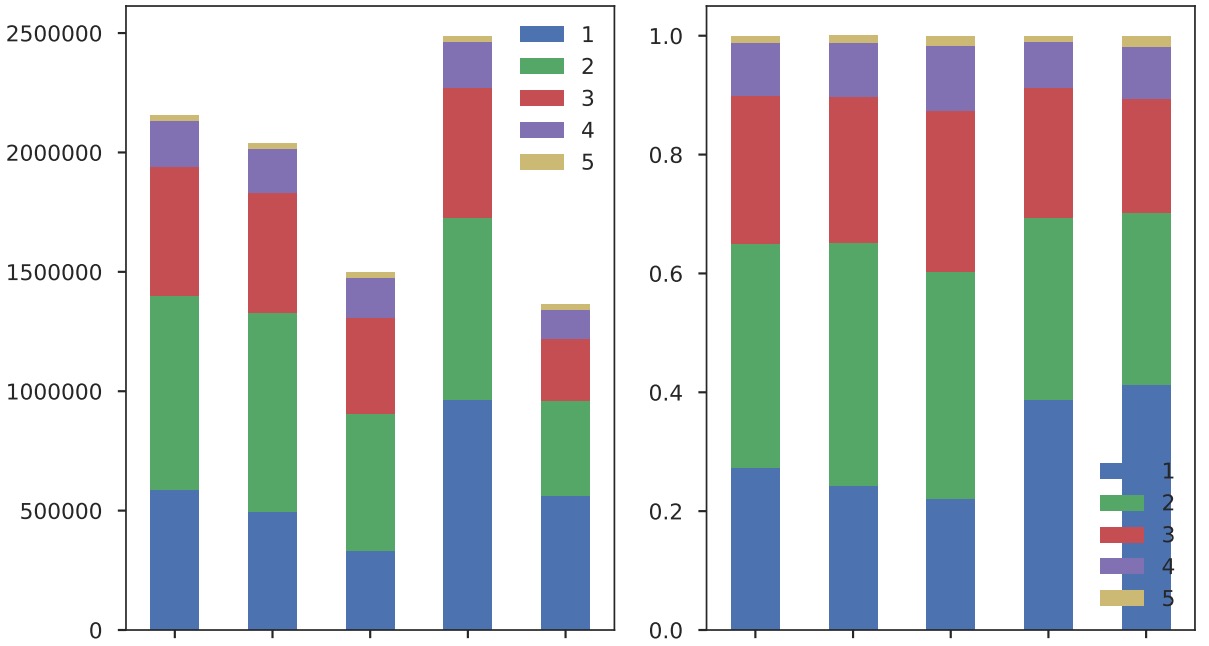
Display cross-way percentage for each set:
import pandas as pd
from nested_dict import nested_dict
import matplotlib as mpl
mpl.use('Agg')
import matplotlib.pyplot as plt
import seaborn as sns
import matplotlib.colors as mcolors
sns.set(style="ticks")
sns.set_context("poster")

def load_upset_file(txt=None, header_ls=None,):
	if txt is None:
		txt = 'all.base.set.txt'
	if header_ls is None:
		header_ls = ['set1', 'set2', 'set3', 'set4', 'set5']
	set_category_stat_dict = nested_dict(2, int)
	with open(txt, 'r') as TXT:
		for n,line in enumerate(TXT):
			line = line.strip()
			if not line or line.startswith('#'):
				continue
			arr = line.split('\t')
			entry_in = sum(map(int, arr[1:]))
			for i,j in zip(arr[1:], header_ls):
				if int(i) == 1:
					set_category_stat_dict[j][entry_in] += 1
	set_category_stat_df = pd.DataFrame.from_dict(set_category_stat_dict, orient='index')
	set_category_stat_df = set_category_stat_df.loc[header_ls, :]
	print set_category_stat_df

	set_category_stat_df_ratio = set_category_stat_df.div(set_category_stat_df.sum(axis=1), axis=0)
	print set_category_stat_df_ratio

	fig, ax = plt.subplots(1, 2)
	set_category_stat_df.plot(kind='bar', stacked=True, ax=ax[0])
	set_category_stat_df_ratio.plot(kind='bar', stacked=True, ax=ax[1])
	plt.tight_layout()
	savefn = txt.replace('.txt', '.ratio.pdf')
	plt.savefig(savefn)
	plt.close()

def main():
	load_upset_file()

if __name__ == '__main__':
	main()
If you link this blog, please refer to this page, thanks!
Post link:https://tsinghua-gongjing.github.io/posts/upset_overlap.html
Previous:
Google ML excercises
Next:
计算学习理论
Latest articles
Links
- ZhangLab , RISE database , THU life , THU info
- Data analysis: pandas , numpy , scipy
- ML/DL: sklearn , sklearn(中文) , pytorch
- Visualization: seaborn , matplotlib , gallery
- Github: me
