目录
集成算法
例子:股票推荐
问题:多个朋友推荐股票的走势,分别是\(g_1, g_2, ..., g_t\),如何选择(如何确定\(g_t(x)\))?
方案:
| 编号 | 做法 | 类别 |
|---|---|---|
| 1 | 从T个选择最信任的对股票预测能力最强的一个 | validation,犯错最小模型 |
| 2 | 都比较厉害,同时考虑T个朋友建议,投票表决 | uniformly |
| 3 | 水平不一,同时考虑T个朋友建议,投票表决,但是投票权重不一样 | non-uniformly |
| 4 | 水平不一,同时考虑T个朋友建议,投票表决,但是投票权重不固定 | conditionally |
以上每种选择其实对应一个模型:
集成算法效果更好
例子:平面上有需分类的点,如果只用一条水平或竖直直线进行分类,无论如何达不到最佳分类效果。可使用集体智慧,及多条线的组合,比如图中的折线(一条水平线+两条竖直线),即可将点完全分开。
为什么效果更好:
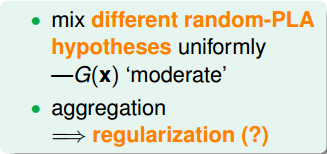
- 将不同的模型均匀结合,提高power,相当于特征转换
- 正则化效果:比如有多个模型选择,但是各种组合最后得到的是比较中庸、合适的(比如下图有很多不同的选择,但是黑色的是组合后最好的)
| 特征转换 | 正则化 |
|---|---|
 |
 |
好的集成需要基学习器“好而不同”
问题:一般经验中,如果把好坏的东西掺和在一起,通常会是比最坏的要好一些,比最好的要坏一些。集成学习为什么能比最好的单一学习器效果更好呢?
例子:
- (a)中每个分类器66.6%精度,集成的模型100%
- (b)中3个分类器没有差别,集成的也是一样的
- (c)每个分类器只有33.3%,集成后结果更糟糕

- 说明:好的集成,需要满足“好而不同”
- 个体学习器要有一定的准确性,不能太坏(c)
- 学习器之间具有差异(b)
理论分析:
- 二分类问题y={-1,1},基分类器错误率为\(\epsilon\)
- 每个基分类器\(h_i\)有:\(P(h_i(x) \neq f(x))=\epsilon\)
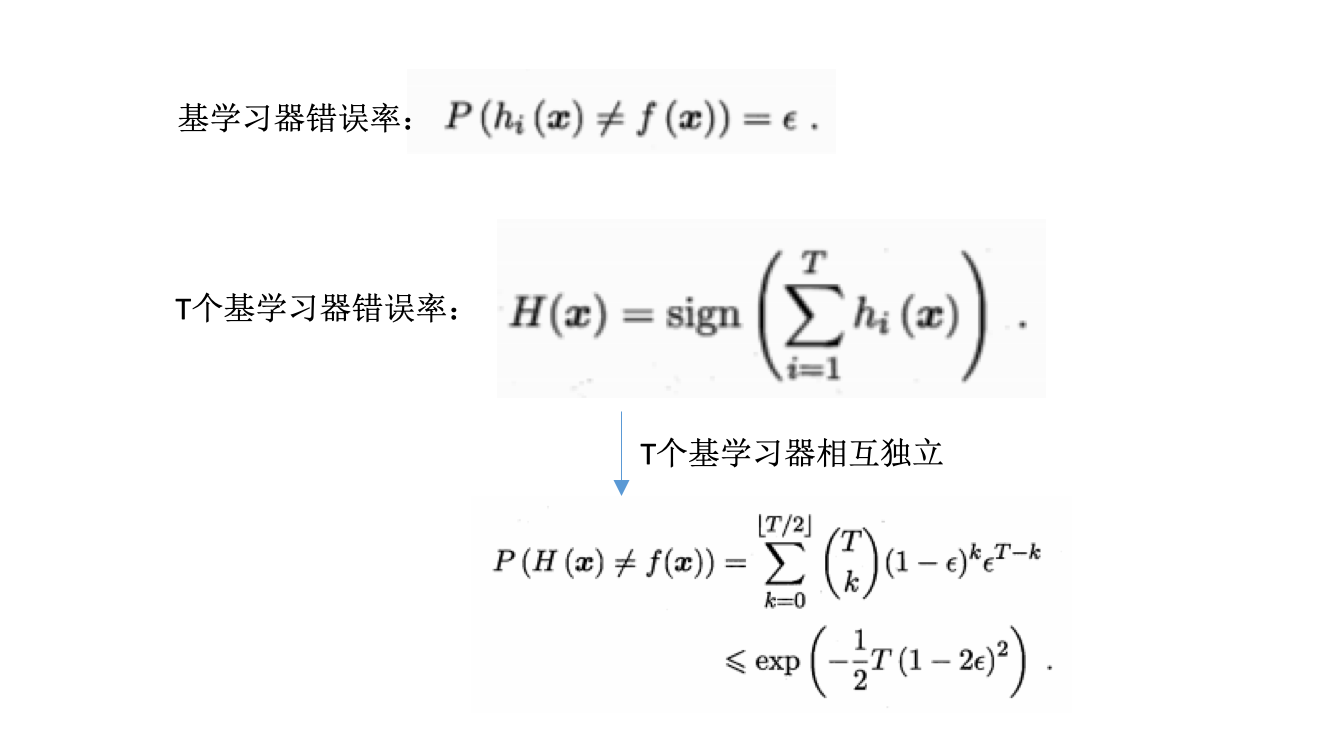
- 随着集成中个体分类器数目T的增大,集成的错误率将指数级下降,最终趋向于0.
误差-分歧(ambiguity)分解:
- 好:误差大小
-
不同:模型之间的分歧或者单个模型与整体模型的分歧
- 分歧:个体学习器在样本x上的不一致性
- 单个学习器的分歧:\(A(h_i\|x)=(h_i(x)-H(x))^2\)
-
集成学习器的分歧:\(\overline{A}(h\|x)=\sum_{i=1}^Tw_i(h_i\|x)=\sum_{i=1}^Tw_i(h_i(x)-H(x))^2\)
- 误差
- 单个学习器的误差:\(E(h_i\|x)=(f(x)-h_i(x))^2\)
-
集成学习器的误差:\(E(H\|x)=(f(x)-H(x))^2\)
- 个体学习器泛化误差的加权平均:\(\overline{E}=\sum_{i=1}^Tw_iE_i\)
- 个体学习器的加权分歧值:\(\overline{A}=\sum_{i=1}^Tw_iA_i\)
- 集成泛化误差:\(E=\overline{E} - \overline{A}\)
- 个体学习器的准确性越高(上面的\(\overline{E}\)越小)、多样性越大(上面的\(\overline{A}\)越大),则集成越好(上面的\(E\)越小)
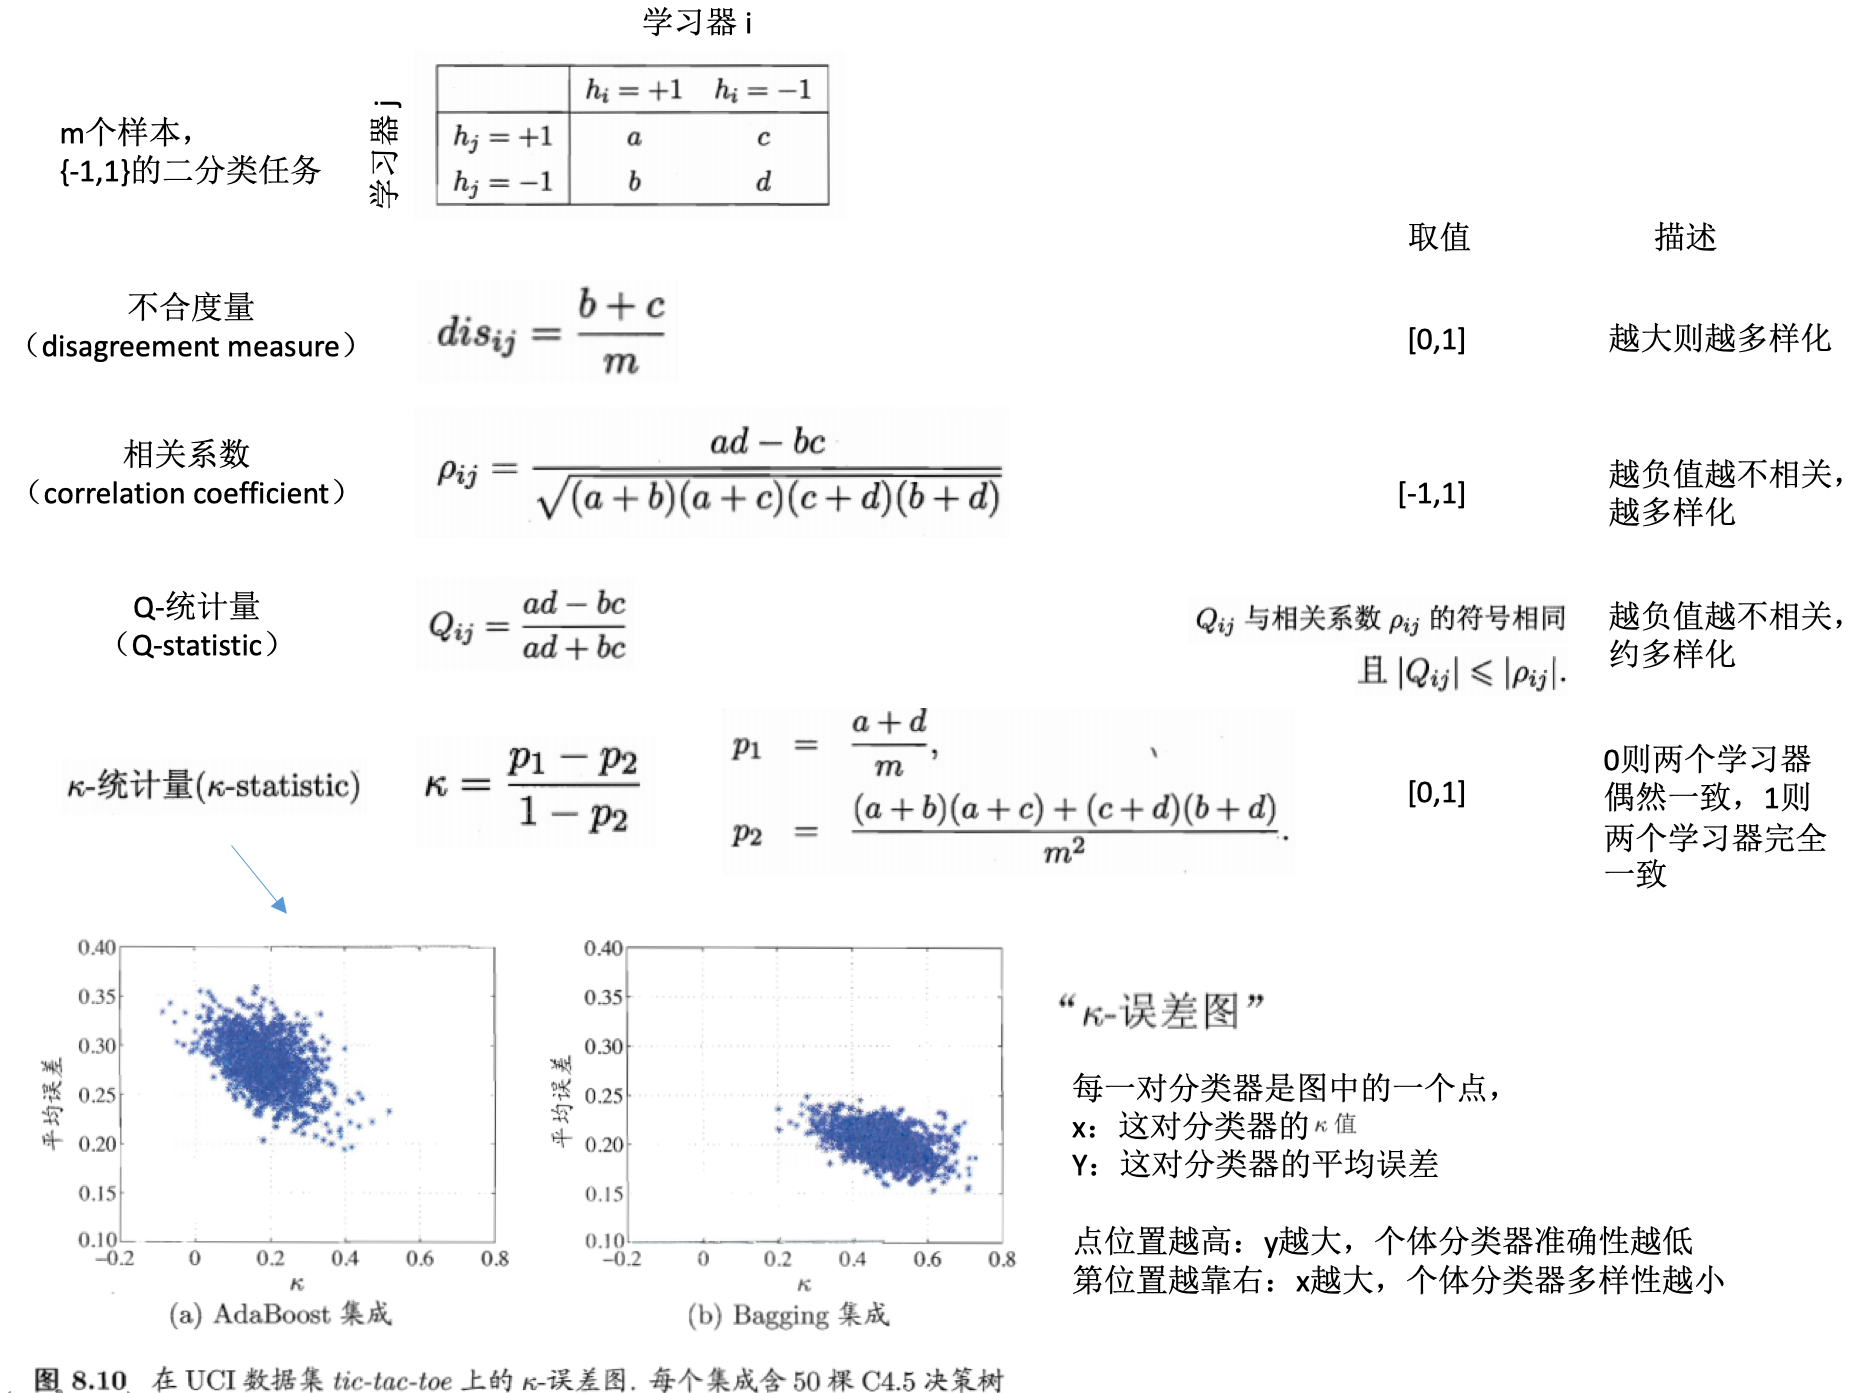
学习器多样性的度量
学习器多样性的增强
有不同的方法可以增强学习器的多样性:
- 核心思路:引入随机性
- 数据样本扰动:采样法
- 输入属性扰动:不同的子空间提供不同视角,随机子空间算法
- 输出表示扰动:对输出表示进行操纵,比如变动类标记,或者调制转换等
-
算法参数扰动:学习算法的参数设置差异
- 随机森林:使用了数据样本扰动和输入属性扰动
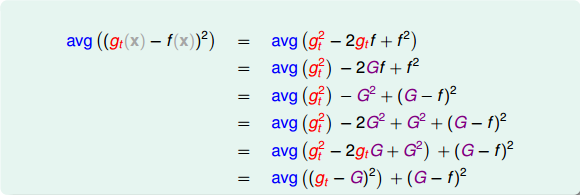
回归:多模型平均比单一模型效果更好的证明
在回归问题中,计算单个模型与真实值的差异,经过换算,可以表示为如下,即单个模型的差距是总的模型的差距,再加一个大于0的项,所以总的模型的差距是更小的:
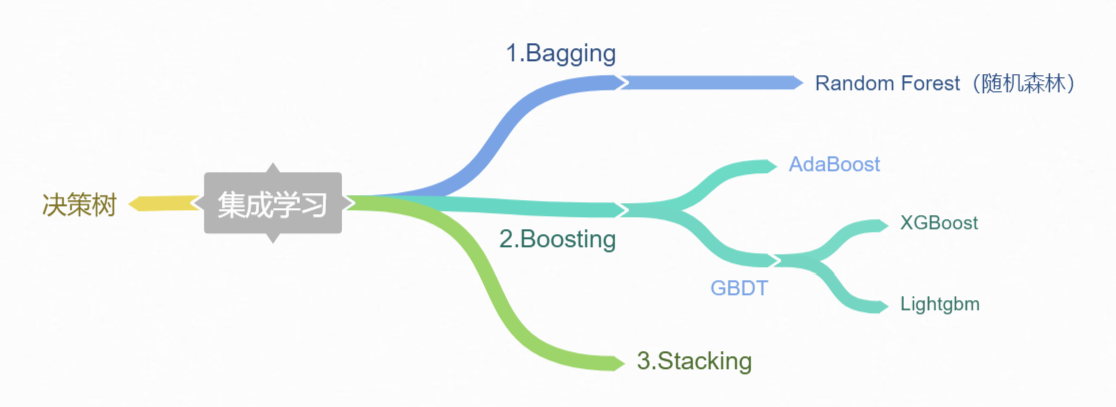
不同类别的集成算法
集成算法(ensemble method):又叫元算法(meta-algorithm),将不同的分类器组合起来。
- 个体学习器的生成方式进行分类:
- 集成方式进行分类:
- 集成不同的算法
- 同一算法在不同设置下的集成
- 数据集不同部分分配给不同分类器之后的集成
uniform blending:权重相同
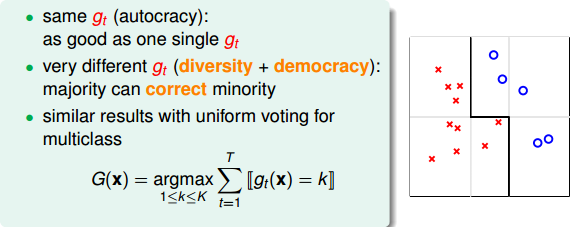
- 分类:每个模型权重为1,投票表决
- 每个\(g_t\)是一样的,此时跟选任意一个\(g_t\)效果一样
- 每个\(g_t\)有一些差别,投票表决
- 多分类,票数最多的一类
- 回归:所有的预测值求均值
- 每个\(g_t\)是一样的,此时跟选任意一个\(g_t\)计算是一样的
- 每个\(g_t\)有一些差别,求平均能消除不同的模型效果差异很大的情况
linear blending: 权重不同的线性组合

- 每个 g(t)的权重不同
- 如何确定权重?误差最小化思想

stacking(any blending):非线性组合
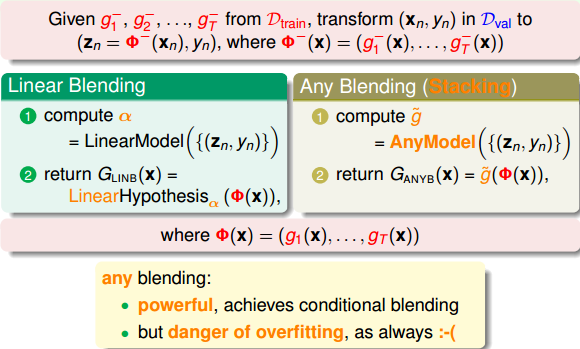
- G(t)是g(t)的任意组合:可以是非线性的
- 优点:提高模型复杂度,更好的预测模型
- 缺点:过拟合的危险。采用正则化。
如何得到不同的\(g_t\)
- 如何得到不同的\(g_t\),以用于模型的融合
- 不同的方法:
- 选取不同的模型
- 设置同一模型的不同参数
- 算法的随机性
- 选择不同的数据样本

\(g_t\)的结合策略
- 平均法:数值型输出(回归类型)
- 简单平均:每个学习器认为权重是一样的
- 加权平均:每个学习器有一个权重
- 投票法(voting):类别输出(分类任务)
- 绝对多数投票法:若某标记得票过半数,则预测为该标记;否则拒绝预测。
- 相对多数投票法:预测为得票最多的标记,若同时多个标记有相同最高票,随机选择一个。
-
加权投票法:类似加权平均,每个学习器有自己的权重,预测为得票最多的标记,若同时多个标记有相同最高票,随机选择一个。
- 每个学习器的输出类型
- 类标记:属于0或1类别,硬投票
- 类概率:输出某类的概率,软投票
- 学习法
- 训练数据很多
- 学习法:通过另一个学习器来进行结合
- 代表:stacking
- 初级学习器:个体学习器。相同则是同质的,不同则是异质的。
- 次级学习器(元学习器):用于结合的学习器
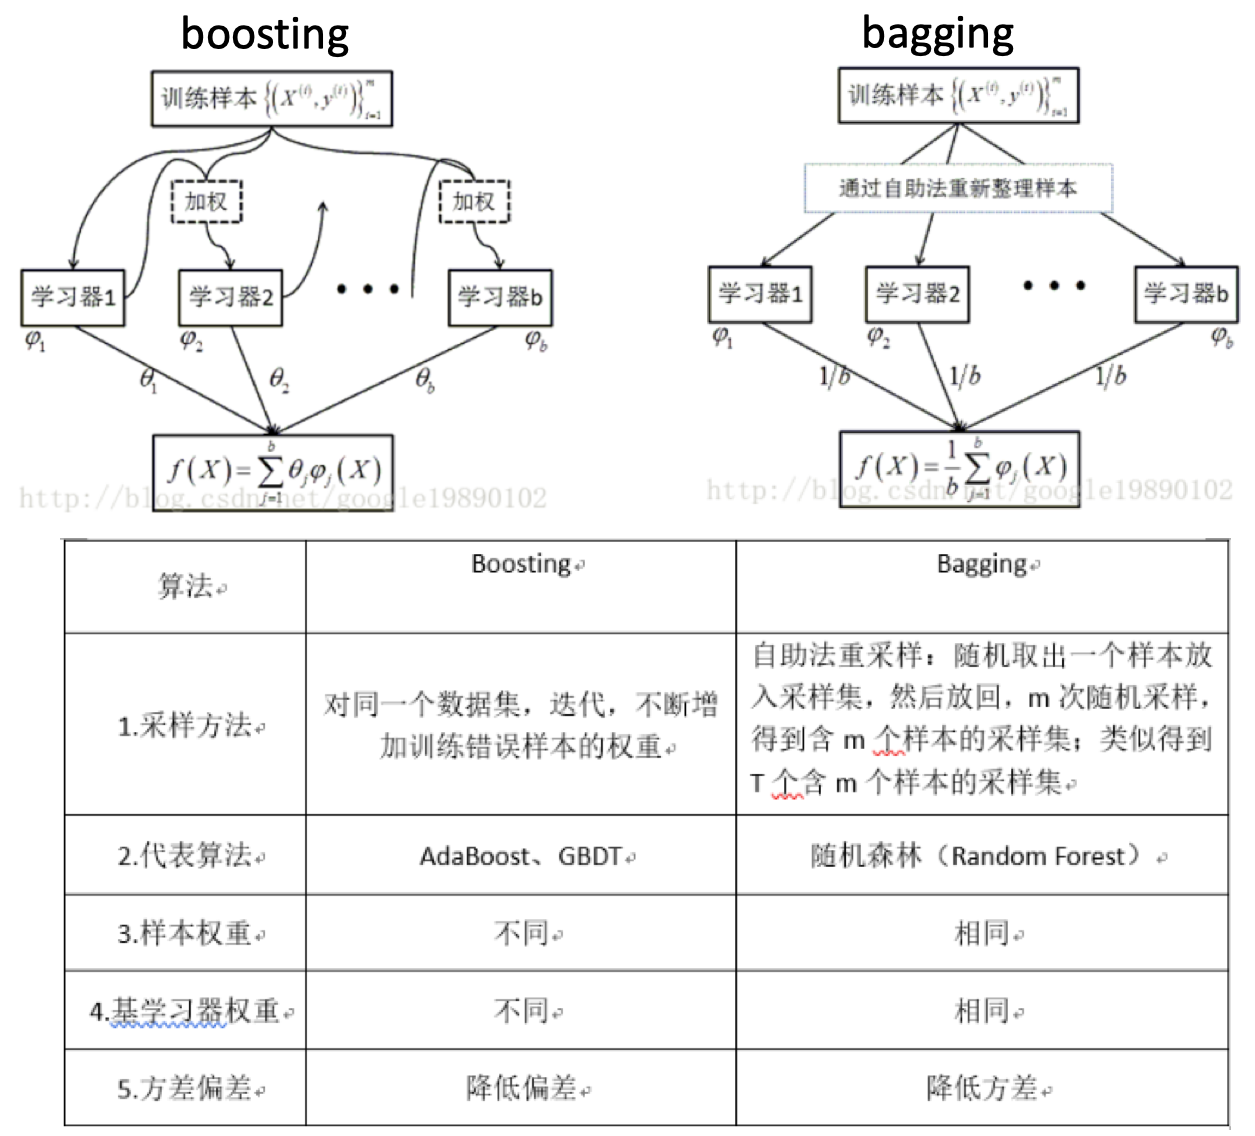
bagging vs random forest vs boosting
- bagging:
- 自举汇聚法(Bootstrap aggregating):从原始数据集选择S次以得到S个数据集。
- 每个数据集与原数据集大小相等,可以重复抽取。
- 训练:每个数据集训练一个模型,得到S个分类器模型。
- 预测:对于新数据,用S个分类器进行分类,然后投票,最多的分类即为最后的分类结果。若分类预测时出现两个类同样的票,最简单的做法是随机选择一个。
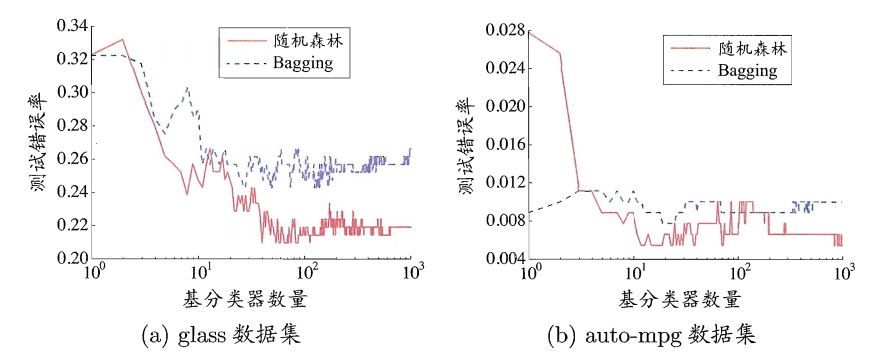
- bagging vs 随机森林:
- boosting:
AdaBoosting
- AdaBoosting:
- 加性模型(additive model):集学习器的线性组合
- 问题:使用弱分类器和数据集构建一个强分类器?弱是说模型的效果不太好,比随机好一点。
- AdaBoosting算法过程:
- 权重等值初始化:每个训练样本赋值一个权重,构成向量D;
- 第一次训练:训练一个弱分类器
- 第二次训练:在同一数据集上进行训练,只是此时的权重会发生改变。降低第一次分类对的样本的权重,增加分类错的权重。样本权重值更新的公式如下:
 。从这里可以看到,如果某个样本被分错了,则\(y_i * G_m(x_i)\)为负,负负得正,取指数后数值大于1,所以次样本权重值相对上一轮是增大的;如果某个样本被分对了,则\(y_i * G_m(x_i)\)为正,负正得负,取指数后数值小于1,所以次样本权重值相对上一轮是减小的。
 - ……
-
第n次训练:此时得到的模型是前n-1个模型的权重线性组合。当模型的分类错误率达到指定阈值(一般为0)时,即可停止训练,采用此时的分类器模型。比如3次训练即达到要求的模型最终是:\(G(x)=sign[f_3(x)]=sign[\alpha_1 * G_1(x) + \alpha_2 * G_2(x) + \alpha_3 * G_3(x)]\)

- 训练得到多个分类器,每个分类器的权重不等,权重值与其错误率相关。
- 错误率:\(\theta_m = \frac{分类错误的样本数目}{所有样本数目}\),其中\(m\)是第几次的训练。错误率是每一次训练结束后,此次的分类器的错误率,需要计算,因为这关乎到此分类器在最终的分类器里的权重。
- 分类器权重:\(\alpha_m = \frac{1}{2} ln(\frac{1-\theta_m}{\theta_m})\)。
- AdaBoosting算法示例:
- 这里以一个10个样本的数据集(每个样本1个特征),详细的解释了如何训练AdoBoost算法,及每一轮迭代中阈值的选取,样本权重值的更新,分类器错误率的计算,分类器权重值的计算等过程,可以参考。
- AdaBoosting算法损失函数:
- 这里的\(\theta_m\)就是分类器的权重值(即上面的\(\alpha_m\))
 。要求解使得该函数最小化,可以采用前向分步算法(forward stagewise)策略:从前向后,每一步只学习一个基函数及其系数。
- 这里的\(\theta_m\)就是分类器的权重值(即上面的\(\alpha_m\))
AdaBoost:Python源码版本
构建多个单层决策树的例子,比如对于一组数据样本(包含两个类别),具有两个特征,如何区分开来?
stumpClassify:对于样本指定的特征,基于一个阈值,对样本进行分类,比如高于这个阈值的设置为-1(取决于判断符号threshIneq)buildStump:对于样本、类别、权重D,构建一个多决策树。对样本的每一个特征进行查看,在每一个特征的取值范围内不断的尝试不同的阈值进行分类,同时不停的更新权重矩阵D,最终的目的是找到使得分类错误率最小时的特征、特征阈值、判断符号(大于还是小于,为啥这个会有影响?)。
def stumpClassify(dataMatrix,dimen,threshVal,threshIneq):#just classify the data
    retArray = ones((shape(dataMatrix)[0],1))
    if threshIneq == 'lt':
        retArray[dataMatrix[:,dimen] <= threshVal] = -1.0
    else:
        retArray[dataMatrix[:,dimen] > threshVal] = -1.0
    return retArray

def buildStump(dataArr,classLabels,D):
    dataMatrix = mat(dataArr); labelMat = mat(classLabels).T
    m,n = shape(dataMatrix)
    numSteps = 10.0; bestStump = {}; bestClasEst = mat(zeros((m,1)))
    minError = inf #init error sum, to +infinity
    for i in range(n):#loop over all dimensions
        rangeMin = dataMatrix[:,i].min(); rangeMax = dataMatrix[:,i].max();
        stepSize = (rangeMax-rangeMin)/numSteps
        for j in range(-1,int(numSteps)+1):#loop over all range in current dimension
            for inequal in ['lt', 'gt']: #go over less than and greater than
                threshVal = (rangeMin + float(j) * stepSize)
                predictedVals = stumpClassify(dataMatrix,i,threshVal,inequal)#call stump classify with i, j, lessThan
                errArr = mat(ones((m,1)))
                errArr[predictedVals == labelMat] = 0
                weightedError = D.T*errArr  #calc total error multiplied by D
                #print "split: dim %d, thresh %.2f, thresh ineqal: %s, the weighted error is %.3f" % (i, threshVal, inequal, weightedError)
                if weightedError < minError:
                    minError = weightedError
                    bestClasEst = predictedVals.copy()
                    bestStump['dim'] = i
                    bestStump['thresh'] = threshVal
                    bestStump['ineq'] = inequal
    return bestStump,minError,bestClasEst
AdaBoost:sklearn版本
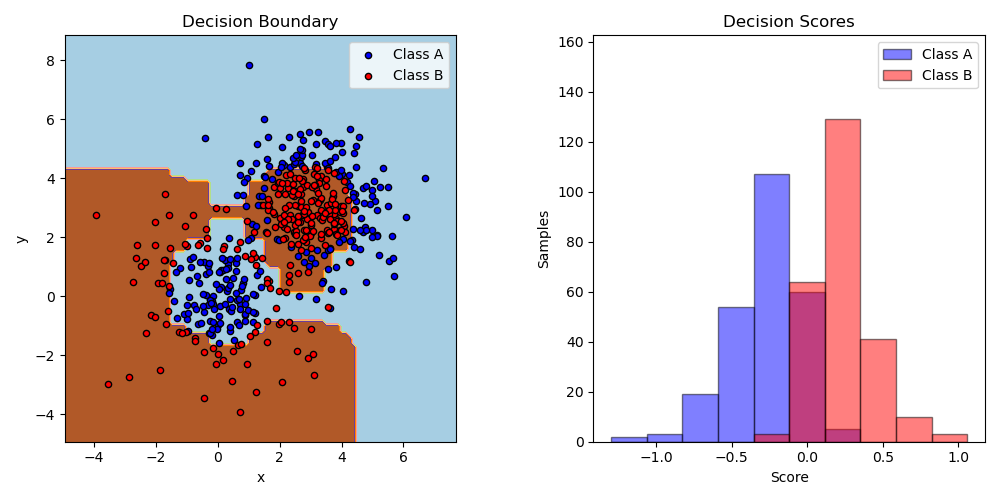
sklearn给出了一个二分类的例子,首先生成了一个数据集,两个高斯分布混合而成的。这些样本是线性不可分的,使用AdaBoost算法,构建基于决策树的分类器,可以很好的区分开来:
import numpy as np
import matplotlib.pyplot as plt

from sklearn.ensemble import AdaBoostClassifier
from sklearn.tree import DecisionTreeClassifier
from sklearn.datasets import make_gaussian_quantiles


# Construct dataset
X1, y1 = make_gaussian_quantiles(cov=2.,
                                 n_samples=200, n_features=2,
                                 n_classes=2, random_state=1)
X2, y2 = make_gaussian_quantiles(mean=(3, 3), cov=1.5,
                                 n_samples=300, n_features=2,
                                 n_classes=2, random_state=1)
X = np.concatenate((X1, X2))
y = np.concatenate((y1, - y2 + 1))

# Create and fit an AdaBoosted decision tree
bdt = AdaBoostClassifier(DecisionTreeClassifier(max_depth=1),
                         algorithm="SAMME",
                         n_estimators=200)

bdt.fit(X, y)

plot_colors = "br"
plot_step = 0.02
class_names = "AB"

plt.figure(figsize=(10, 5))

# Plot the decision boundaries
plt.subplot(121)
x_min, x_max = X[:, 0].min() - 1, X[:, 0].max() + 1
y_min, y_max = X[:, 1].min() - 1, X[:, 1].max() + 1
xx, yy = np.meshgrid(np.arange(x_min, x_max, plot_step),
                     np.arange(y_min, y_max, plot_step))

Z = bdt.predict(np.c_[xx.ravel(), yy.ravel()])
Z = Z.reshape(xx.shape)
cs = plt.contourf(xx, yy, Z, cmap=plt.cm.Paired)
plt.axis("tight")

# Plot the training points
for i, n, c in zip(range(2), class_names, plot_colors):
    idx = np.where(y == i)
    plt.scatter(X[idx, 0], X[idx, 1],
                c=c, cmap=plt.cm.Paired,
                s=20, edgecolor='k',
                label="Class %s" % n)
plt.xlim(x_min, x_max)
plt.ylim(y_min, y_max)
plt.legend(loc='upper right')
plt.xlabel('x')
plt.ylabel('y')
plt.title('Decision Boundary')
参考
- 机器学习实战第7章
- 机器学习周志华第8章
- 决策树、GBDT、XGBoost和LightGBM之GBDT
- Adaboost 算法的原理与推导
- Boosting algorithm: AdaBoost
If you link this blog, please refer to this page, thanks!
Post link:https://tsinghua-gongjing.github.io/posts/AdaBoost.html
Latest articles
Links
- ZhangLab , RISE database , THU life , THU info
- Data analysis: pandas , numpy , scipy
- ML/DL: sklearn , sklearn(中文) , pytorch
- Visualization: seaborn , matplotlib , gallery
- Github: me

