目录
- 目录
- Extract clusters from seaborn clustermap stackoverflow
- 指定运行的CPU数目
- 数据并行时报错:NN module weights are not part of single contiguous chunk of memory
- 为什么RNN/LSTM很慢
- 异常值处理:Tukey’s Method
- PCA
- Python3.7sklearn包中缺失Imputer函数
- 保存模型到pickle并后续load
Extract clusters from seaborn clustermap stackoverflow
### direct call from clustermap
df = pd.read_csv(txt, header=0, sep='\t', index_col=0)
fig, ax = plt.subplots(figsize=(25,40))
sns.clustermap(df, standard_scale=False, row_cluster=True, col_cluster=True, figsize=(25, 40), yticklabels=False)
savefn = txt.replace('.txt', '.cluster.png')
plt.savefig(savefn)
plt.close()

### calc linkage in hierarchy
df_array = np.asarray(df)
row_linkage = hierarchy.linkage(distance.pdist(df), method='average')
col_linkage = hierarchy.linkage(distance.pdist(df.T), method='average')

fig, ax = plt.subplots(figsize=(25,40))
sns.clustermap(df, row_linkage=row_linkage, col_linkage=col_linkage, standard_scale=False, row_cluster=True, col_cluster=True, figsize=(25, 40), yticklabels=False, method="average")
savefn = txt.replace('.txt', '.cluster.png')
plt.savefig(savefn)
plt.close()
hierarchy.fcluster can be used to extract clusters based on max depth or cluster num as illustrated here:
### max depth
from scipy.cluster.hierarchy import fcluster
max_d = 50
clusters = fcluster(Z, max_d, criterion='distance')
clusters

array([2, 2, 2, 2, 2, 2, 2, 2, 2, 2, 2, 2, 2, 2, 2, 2, 2, 2, 2, 2, 2, 2, 2,
       2, 2, 2, 2, 2, 2, 2, 2, 2, 2, 2, 2, 2, 2, 2, 2, 2, 2, 2, 2, 2, 2, 2,
       2, 2, 2, 2, 2, 2, 2, 2, 2, 2, 2, 2, 2, 2, 2, 2, 2, 2, 2, 2, 2, 2, 2,
       2, 2, 2, 2, 2, 2, 2, 2, 2, 2, 2, 2, 2, 2, 2, 2, 2, 2, 2, 2, 2, 2, 2,
       2, 2, 2, 2, 2, 2, 2, 2, 1, 1, 1, 1, 1, 1, 1, 1, 1, 1, 1, 1, 1, 1, 1,
       1, 1, 1, 1, 1, 1, 1, 1, 1, 1, 1, 1, 1, 1, 1, 1, 1, 1, 1, 1, 1, 1, 1,
       1, 1, 1, 1, 1, 1, 1, 1, 1, 1, 1, 1], dtype=int32)

### user defined cluster number
k=2
fcluster(Z, k, criterion='maxclust')
Assign cluster id and plot (stackoverflow):
fcluster = hierarchy.fcluster(row_linkage, 10, criterion='maxclust')
lut = dict(zip(set(fcluster), sns.hls_palette(len(set(fcluster)), l=0.5, s=0.8)))
row_colors = pd.DataFrame(fcluster)[0].map(lut)

sns.clustermap(df, row_linkage=row_linkage, col_linkage=col_linkage,
				  standard_scale=False, row_cluster=True, col_cluster=False,
				  figsize=(50, 80), yticklabels=False, method="average",
				  cmap=cmap, row_colors=[row_colors])
指定运行的CPU数目
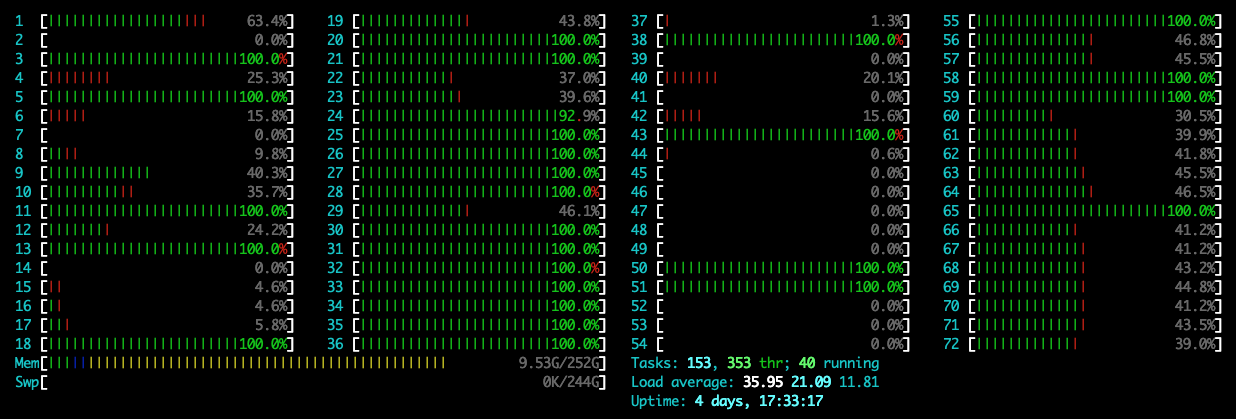
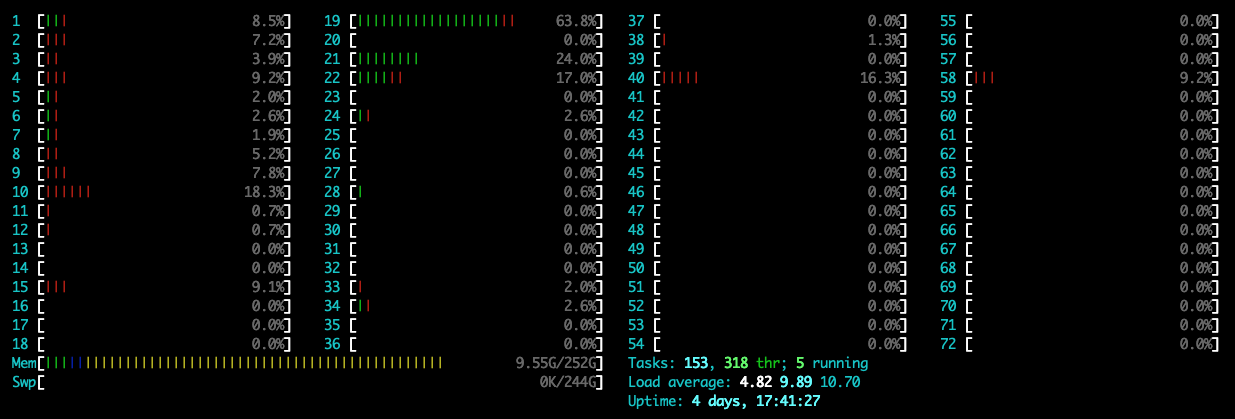
在新版本的pytorch里面,在运行程序时可能默认使用1个CPU的全部核,导致其他用户不能正常使用,可通过指定参数OMP_NUM_THREADS=1设置运行时使用的核数,下面是加和不加时的CPU监视截图:
不指定:
指定:
可以看到,在指定时,只使用了1个核,此时的CPU使用率是100%左右;在不指定时,CPU使用率到达了3600%,此时默认使用了36个核。具体命令如下:
# CUDA_VISIBLE_DEVICES: 指定GPU核
# OMP_NUM_THREADS: 指定使用的CPU核数
time CUDA_VISIBLE_DEVICES=0 OMP_NUM_THREADS=1 python $script_dir/main.py
数据并行时报错:NN module weights are not part of single contiguous chunk of memory
参考这里
# 之前
out1, _ = self.lstm(x, (h0, c0))

# 之后
self.lstm.flatten_parameters()
out1, _ = self.lstm(x, (h0, c0))
为什么RNN/LSTM很慢
在最近搭建的LSTM模型中,即使使用上了GPU,运行花费时间还是很长。模型不是很大,一个卷积层+一个resblock+一个LSTM,序列长度为100,使用双向的LSTM,两层、hidden size是128,基本运行需要10+h小时的时间,每一个epoch花费接近3min。有一些关于为什么LSTM运行很慢的文章(比如知乎帖子rnn为什么训练速度慢),可以参考一下,主要是:
- 每一个时间点的计算,依赖于上一时间点,不能并行
- 计算量大。计算复杂度:O(seq_len),序列越长越明显,且RNN内部使用的是全连接结构。
- 每个时间点还有1个memory I/O的操作
最近有个SRU的模块,可以实现如CNN级别的速度训练RNN网络,在github上star数目还挺高的,可以参考一下。
异常值处理:Tukey’s Method
- 计算异常值步进,即1.5倍的四分位数范围
- 所有IQR外超过异常值步进的数据定义为异常值并去除
for feature in log_data.keys():
    Q1 = np.percentile(log_data[feature], 25)
    Q3 = np.percentile(log_data[feature], 75)
    step = 1.5 * (Q3 - Q1)

    print("特征'{}'的异常值包括:".format(feature))
    display(log_data[~((log_data[feature] >= Q1 - step) & (log_data[feature] <= Q3 + step))])

outliers  = [95, 338, 86, 75, 161, 183, 154] # 选择需要删除的异常值index

good_data = log_data.drop(log_data.index[outliers]).reset_index(drop = True) #删除选择的异常值
PCA
参考这里:Feature/Variable importance after a PCA analysis,下面是一个完整的函数,并给出每个特征的重要性及可解释比例:
def PCA_df(df, n_components=6):
    from sklearn.decomposition import PCA
    pca = PCA(n_components=n_components)
    pca.fit(df)

    df_pc = pca.transform(df)

    # number of components
    n_pcs= pca.components_.shape[0]

    # get the index of the most important feature on EACH component
    # LIST COMPREHENSION HERE
    most_important = [np.abs(pca.components_[i]).argmax() for i in range(n_pcs)]
    # print('feature index of importance from 1st to last', most_important)

    initial_feature_names = df.columns
    # get the names
    most_important_names = [initial_feature_names[most_important[i]] for i in range(n_pcs)]

    # LIST COMPREHENSION HERE AGAIN
    dic = {'PC{}'.format(i): most_important_names[i] for i in range(n_pcs)}

    # build the dataframe
    feature_importance_df = pd.DataFrame(dic.items())

    feature_importance_df.columns = ['PC', 'Names']
    feature_importance_df['Column_index'] = most_important
    feature_importance_df['Explained_variance_ratio'] = pca.explained_variance_ratio_
    feature_importance_df['Singular_values'] = pca.singular_values_
    display(feature_importance_df)

    return feature_importance_df
Python3.7sklearn包中缺失Imputer函数
参考这里:
import numpy as np
import sklearn
from sklearn import preprocessing
from sklearn.preprocessing import Imputer
Traceback (most recent call last):
  File "<stdin>", line 1, in <module>
ImportError: cannot import name 'Imputer' from 'sklearn.preprocessing' (E:\python\lib\site-packages\sklearn\preprocessing\__init__.py)

# 现在
# https://scikit-learn.org/stable/modules/impute.html#impute
from sklearn.impute import SimpleImputer

imp = SimpleImputer()
imp.fit([[1, 2],
         [np.nan, 3],
         [7, 6]])
imp.transform([[np.nan, 2],
               [6, np.nan]])
保存模型到pickle并后续load
参考这里:
X_train, X_test, Y_train, Y_test = model_selection.train_test_split(X, Y, test_size=test_size, random_state=seed)
# Fit the model on training set
model = LogisticRegression()
model.fit(X_train, Y_train)
# save the model to disk
filename = 'finalized_model.sav'
pickle.dump(model, open(filename, 'wb'))

# some time later...

# load the model from disk
loaded_model = pickle.load(open(filename, 'rb'))
result = loaded_model.score(X_test, Y_test)
print(result)
If you link this blog, please refer to this page, thanks!
Post link:https://tsinghua-gongjing.github.io/posts/python-ML-tricks.html
Previous:
支持向量机
Next:
集成算法和AdaBoost
Latest articles
Links
- ZhangLab , RISE database , THU life , THU info
- Data analysis: pandas , numpy , scipy
- ML/DL: sklearn , sklearn(中文) , pytorch
- Visualization: seaborn , matplotlib , gallery
- Github: me

