概念
混淆矩阵(confusion matrix,also called error matrix):用于表征分类模型在一个测试集合上的效果的表格。
比如,对于一个二分类问题,其分类效果可用类似于下表表示,列是预测的类别,行是实际的类别,由此就可知道哪些类别容易预测,哪些容易预测错误(尤其是多分类问题的):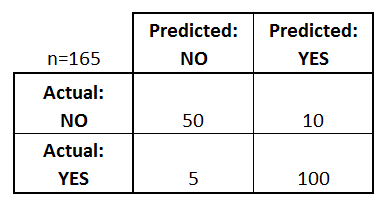
计算
当有一个预测的label后,实际的label是已知的,所以可以直接根据这些数值计算并可视化混淆矩阵,sklearn提供了一个代码,可以参考一下:
计算混淆矩阵:
from sklearn.metrics import confusion_matrix

# 数字类别
y_true = [2, 0, 2, 2, 0, 1]
y_pred = [0, 0, 2, 2, 0, 2]
confusion_matrix(y_true, y_pred)

array([[2, 0, 0],
       [0, 0, 1],
       [1, 0, 2]])

# 字符类别
y_true = ["cat", "ant", "cat", "cat", "ant", "bird"]
y_pred = ["ant", "ant", "cat", "cat", "ant", "cat"]
confusion_matrix(y_true, y_pred, labels=["ant", "bird", "cat"])

array([[2, 0, 0],
       [0, 0, 1],
       [1, 0, 2]])
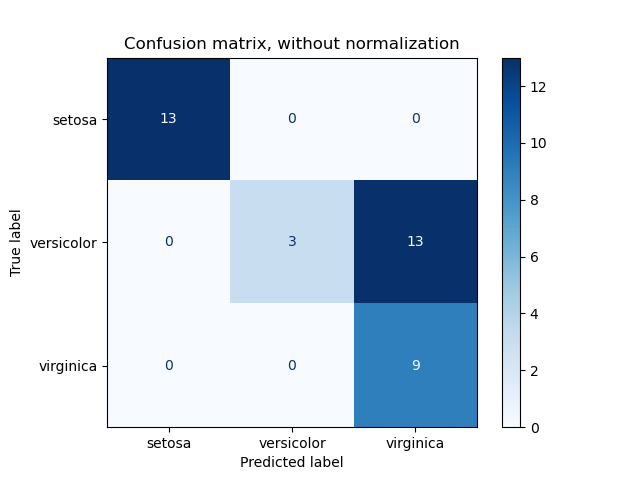
可视化
可视化,sklearn也提供了代码,注意的是,这里的classes如果是数字需要用np.array转换一下并设置数据类型(classes=np.array([0,1],dtype='<U10')):
def plot_confusion_matrix(y_true, y_pred, classes, normalize=False, title=None, cmap=plt.cm.Blues):
    """ plot_confusion_matrix(list(df_labels['cell_label']),
                              list(df_prediction_label['label']),
                              classes=np.array([0,1], dtype='<U10'), # use np to convert and set data type
                              title='Without normalization')
    """
    from sklearn.metrics import confusion_matrix
    from sklearn.utils.multiclass import unique_labels
    if not title:
        if normalize:
            title = 'Normalized confusion matrix'
        else:
            title = 'Confusion matrix, without normalization'
    cm = confusion_matrix(y_true, y_pred)
    classes = classes[unique_labels(y_true, y_pred)]
    if normalize:
        cm = cm.astype('float') / cm.sum(axis=1)[:, np.newaxis]
        print("Normalized confusion matrix")
    else:
        print('Confusion matrix, without normalization')

    print(cm)

    fig, ax = plt.subplots()
    im = ax.imshow(cm, interpolation='nearest', cmap=cmap)
    ax.figure.colorbar(im, ax=ax)
    ax.set(xticks=np.arange(cm.shape[1]),
           yticks=np.arange(cm.shape[0]),
           xticklabels=classes, yticklabels=classes,
           title=title,
           ylabel='True label',
           xlabel='Predicted label')
    plt.setp(ax.get_xticklabels(), rotation=45, ha="right",
             rotation_mode="anchor")
    fmt = '.2f' if normalize else 'd'
    thresh = cm.max() / 2.
    for i in range(cm.shape[0]):
        for j in range(cm.shape[1]):
            ax.text(j, i, format(cm[i, j], fmt),
                    ha="center", va="center",
                    color="white" if cm[i, j] > thresh else "black")
    fig.tight_layout()
    return ax

# Plot non-normalized confusion matrix
plot_confusion_matrix(y_test, y_pred, classes=class_names,
                      title='Confusion matrix, without normalization')

# Plot normalized confusion matrix
plot_confusion_matrix(y_test, y_pred, classes=class_names, normalize=True,
                      title='Normalized confusion matrix')
参考
If you link this blog, please refer to this page, thanks!
Post link:https://tsinghua-gongjing.github.io/posts/confusion-matrix.html
Latest articles
Links
- ZhangLab , RISE database , THU life , THU info
- Data analysis: pandas , numpy , scipy
- ML/DL: sklearn , sklearn(中文) , pytorch
- Visualization: seaborn , matplotlib , gallery
- Github: me