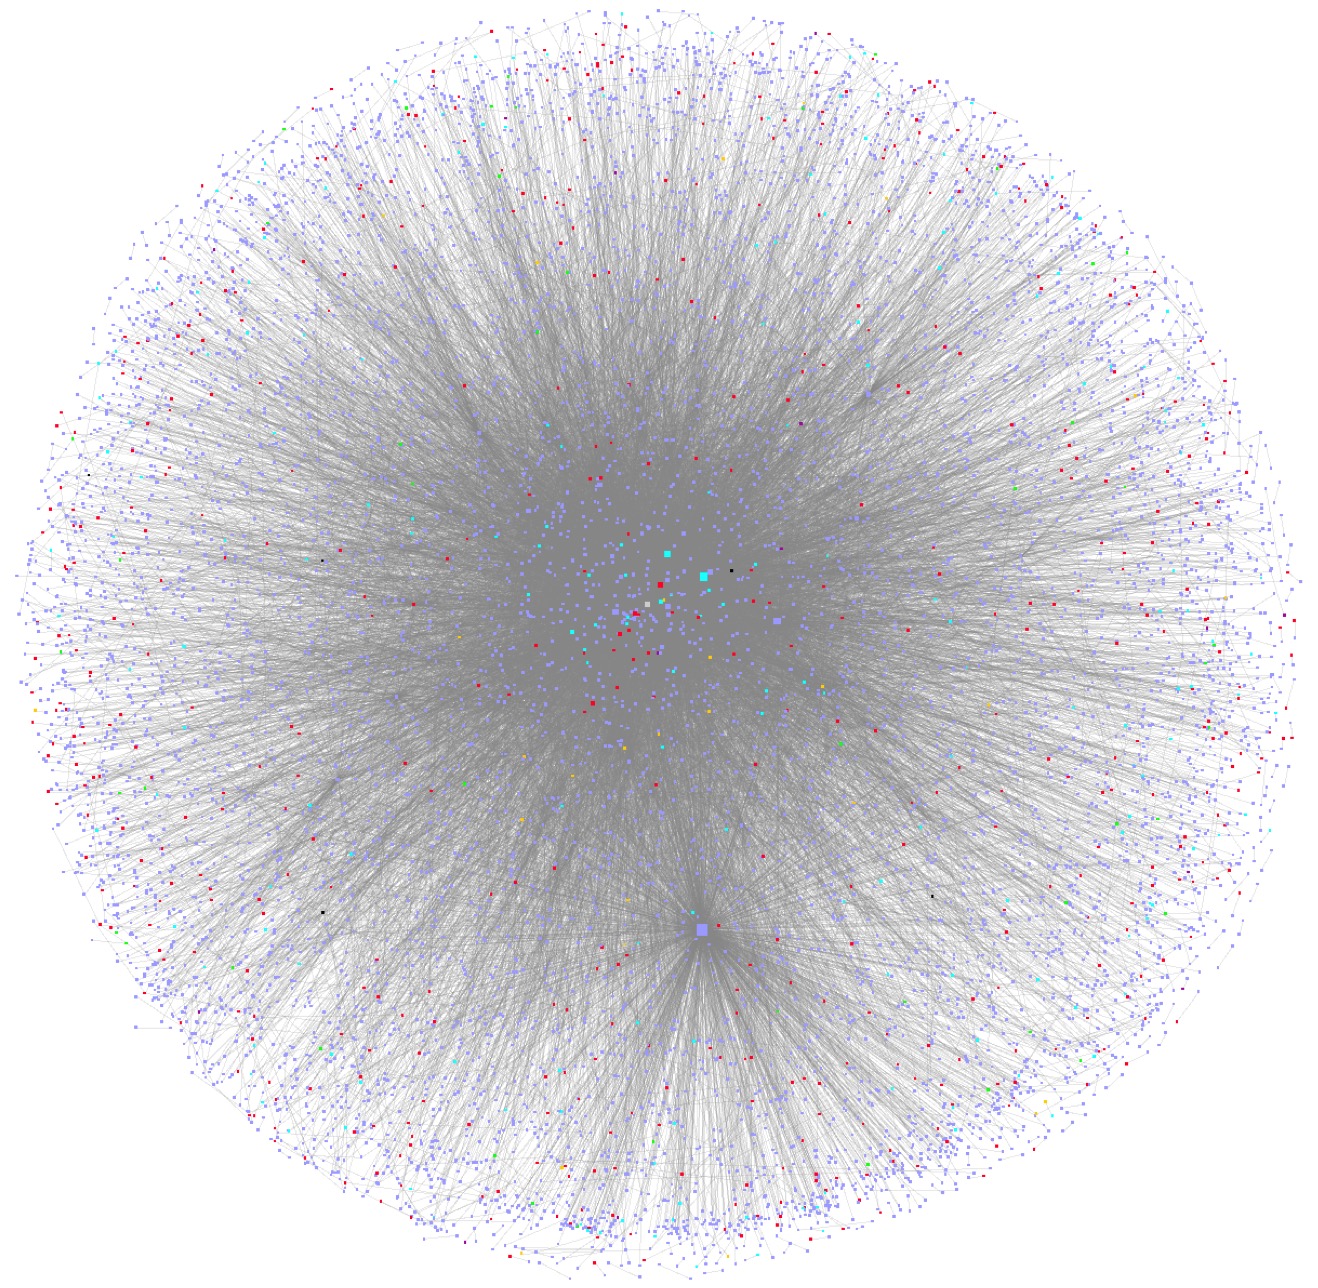
最近在使用Cytoscape做一些网络的可视化,作为一个老牌的工具,在性能和功能上确实很好。同时,其小组也开发了pycytoscape工具,通过REST访问客户端,实现编程式的网络可视化。通过结果其他的网络分析模块(比如networkx),添加对于节点的更多特征,以承载更多的信息。
导入相关的模块和基本的配置:
from py2cytoscape.data.cynetwork import CyNetwork
from py2cytoscape.data.cyrest_client import CyRestClient
from py2cytoscape.data.style import StyleUtil
import py2cytoscape.util.cytoscapejs as cyjs
import py2cytoscape.cytoscapejs as renderer

import networkx as nx
import pandas as pd
import json
import os
import imageio
import scipy
清空当前的session:
cy = CyRestClient()
cy.session.delete()
读入一个pandas dataframe:
f = '/Users/gongjing/Dropbox/Zebrafish_development/results/plots/cytoscape/nx_merge_12345.txt'
df = pd.read_csv(f, header=0, sep='\t')
df.head()

source	target	egg	1cell	4cell	64cell	1k
0	NM_212843	NM_183349	NO	YES	NO	NO	NO
1	NM_212840	NM_001114579	NO	NO	NO	YES	NO
2	NM_212840	NM_001098252	NO	NO	YES	NO	NO
3	NM_212841	NM_001017830	NO	YES	NO	YES	NO
4	NM_212846	NM_001190758	NO	NO	NO	YES	NO
从pandas dataframe读入为一个网络:
nx_inter_RRI = nx.from_pandas_dataframe(df, 'source', 'target', edge_attr=['egg', '1cell', '4cell','64cell', '1k'])

net_module = cy.network.create_from_networkx(nx_inter_RRI)
控制网络的layout:
cy.layout.apply(name='circular', network=net_module)
读入节点的注释数据:
node_anno = node_anno_dict['all']
df_node_anno = pd.read_csv(node_anno, header=0, sep='\t')
df_node_anno.head()

name	type	first_occur	node_degree	egg	1cell	4cell	64cell	1K
0	NM_212843	mRNA	1cell	1	NO	YES	NO	NO	NO
1	NM_212840	mRNA	4cell	2	NO	NO	YES	YES	NO
2	NM_212841	mRNA	1cell	1	NO	YES	NO	YES	NO
3	NM_212846	mRNA	egg	2	YES	YES	NO	YES	YES
4	NM_212844	mRNA	1K	1	NO	NO	NO	NO	YES
更新node table, 属性列用于后面网络特征的映射:
net_module.update_node_table(df=df_node_anno, network_key_col='name',data_key_col='name')
定义颜色集合:
RNA_type_ls = ['mRNA', 'lncRNA', 'miRNA', 'misc_RNA', 'pseudogene', 'rRNA', 'snRNA', 'snoRNA', 'other']
RNA_type_color_ls = ['202,75,78', '83,169,102', '205,185,111', '98,180,208', '129,112,182', '238,130,238',
                     '255,140,0', '74,113,178', '169,169,169']
RNA_type_color_dict = {i:j for i,j in zip(RNA_type_ls, RNA_type_color_ls)}
给不同类型的节点上不同的颜色:
my_module_style = cy.style.create('RRI Module Style')
my_module_style.create_discrete_mapping(column='type',vp='NODE_FILL_COLOR',
            col_type='String',mappings=RNA_type_color_dict)
cy.style.apply(my_module_style, n)
如果已经通过cytoscape的菜单,把某一次的操作保存为了.cys文件,也可以直接load进来,获取对应的网络,并更新node table, 应用新的配置等:
cy = CyRestClient()
cy.session.delete()

# 打开已有的文件
mysession = cy.session.open('/Users/gongjing/Dropbox/Zebrafish_development/results/plots/cytoscape/all_dynamic_network.cys')

# 获取当前网络的suid
all_suid = cy.network.get_all()

# 获取当前的网络,以操作
n = cy.network.create(all_suid[0])

# 更新当前网络的节点信息
n.update_node_table(df=df_node_anno, network_key_col='name',data_key_col='name')
If you link this blog, please refer to this page, thanks!
Post link:https://tsinghua-gongjing.github.io/posts/cytoscape.html
Previous:
Google machine learning
Next:
Frequently used tricks
Latest articles
Links
- ZhangLab , RISE database , THU life , THU info
- Data analysis: pandas , numpy , scipy
- ML/DL: sklearn , sklearn(中文) , pytorch
- Visualization: seaborn , matplotlib , gallery
- Github: me
