目录
概述
决策树算法:由一个决策图和可能的结果(包括资源成本和风险)组成, 用来创建到达目标的规划。
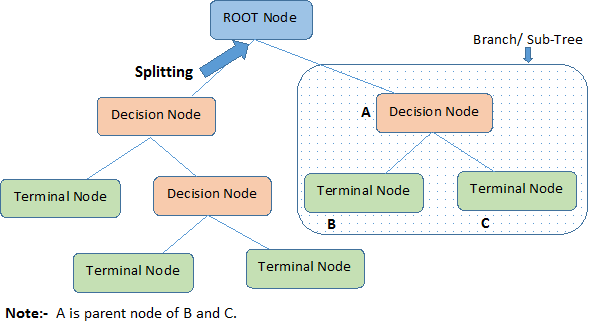
决策树流程图
- 判断模块(decision block/node)
- 终止模块(terminating block/node):已得出结论,可终止运行
- 分支(branch/sub-tree):从判断模块引出的左右箭头
建树步骤
决策树的构建通常包含3个步骤:
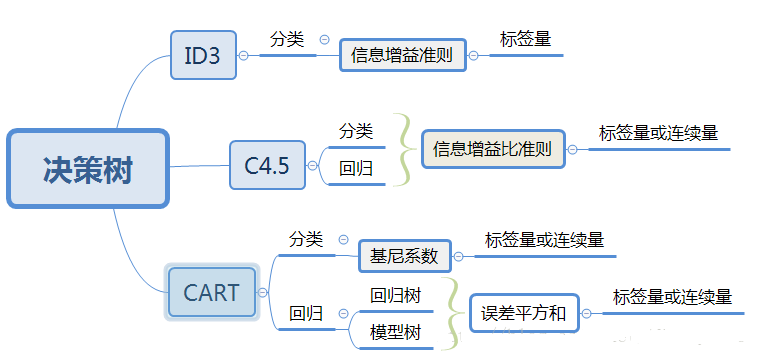
- 【1 特征选择】:选择什么特征进行分支,不同的算法采用不同的度量策略,比如ID3是基于信息增益最大的特征,C4.5则采用信息增益比,CART使用GINI系数
- 【2 生成决策树】:从从上至下递归的分支生成子节点
- 【3 剪枝】:决策树容易过拟合,所以需要缩小数的规模
建树的具体过程:
- 将所有的特征看成一个一个的节点(每次都是选取一个特征进行判断从而分支);
- 遍历每个特征,进行分割计算,计算每个特征划分前后的信息增值(比如熵值之差)。选取最好的特征(增益最大的、熵值最小的)进行分割,从而将数据划分为不同的子节点;
-
对子节点分别递归执行上一步,直到每个最终的子节点都足够’纯’或者都属于同一类别为止。
- 递归结束条件:1)遍历完所有的属性,2)每个分支下的所有实例归属同一类。

如何选取划分特征?
ID3
信息增益(Information Gain):划分数据集之前之后信息发生的变化,比如可以看熵值的变化,在每一个状态时具有一个熵值。
信息和熵值(Entropy)(参见下图的上半部分):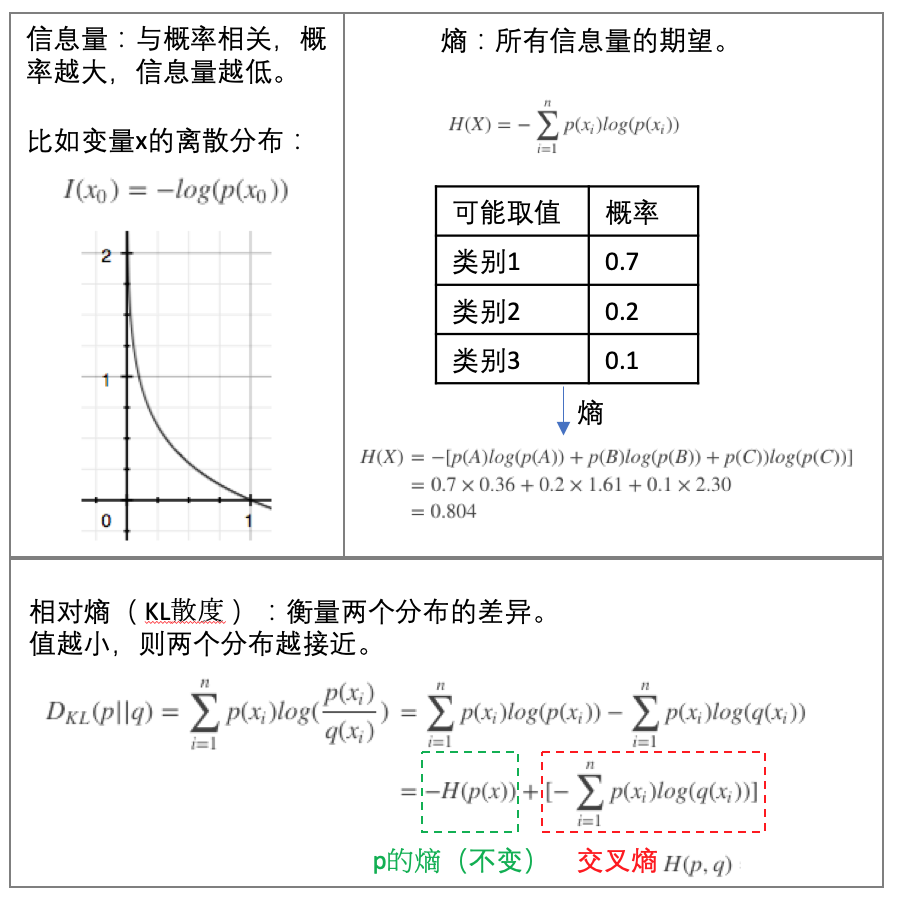
具体的计算如下: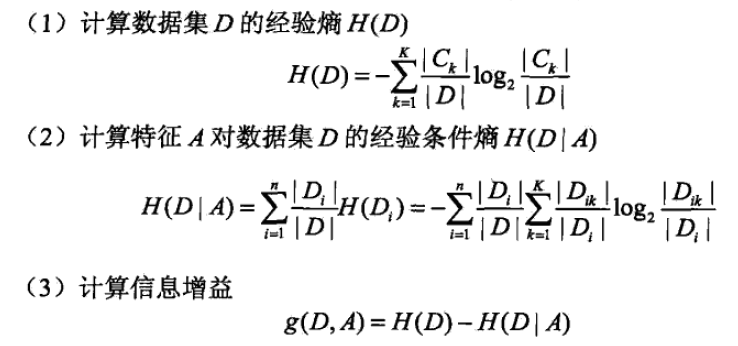
下面是一个例子,比较不同的特征进行数据分隔时的信息增益大小: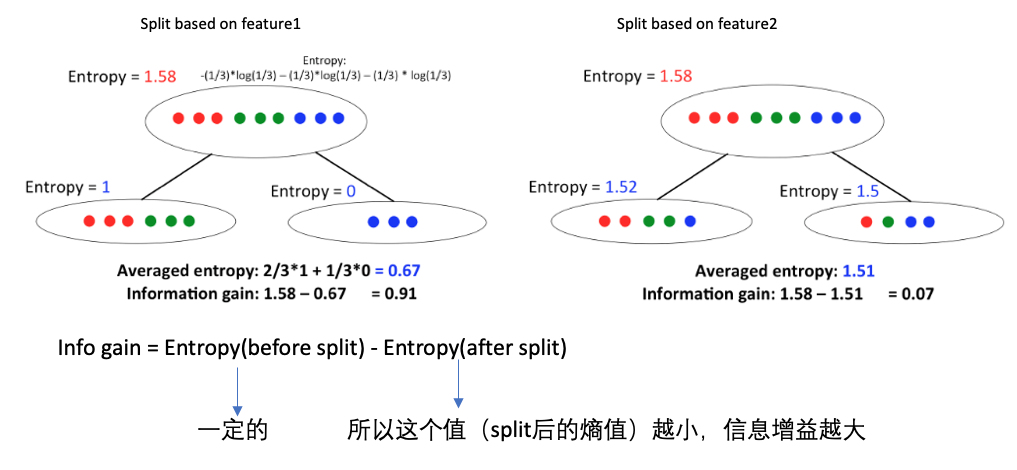
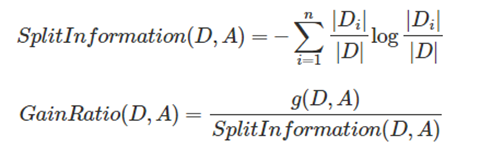
C4.5
ID3使用信息增益最大的特征作为分隔特征,这个对于特征是有偏向性的,具有多个值的特征其信息增益也容易大从而被选做分隔特征。为了消除这个,在C4.5中引入了信息增益比:
- 先计算某特征对于数据集的切割信息
- 然后用信息增益对于上述的切割信息进行归一化
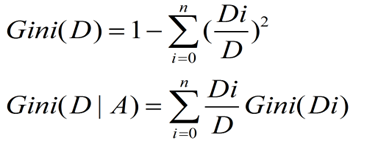
CART
ID3和C4.5构建的树规模较大,为了提高建树的效率,CART方法被开发出来,其使用的是GINI系数来知道特征的选择:
三种算法的比较:
损失函数
在经典的ID3中,每次选取的分隔特征都是信息增益最大的,这个可以保证最后的分类效果达到最好,其损失函数值也是最小的。具体的,其损失函数很像最大似然估计函数:
实现
Python源码版本
计算给定数据集的香秾熵值:1)统计数据集label的count数,2)转换为概率,3)概率乘以对数概率并加和:
def calcShannonEnt(dataSet):
    numEntries = len(dataSet)
    labelCounts = {}
    for featVec in dataSet: #the the number of unique elements and their occurance
        currentLabel = featVec[-1]
        if currentLabel not in labelCounts.keys(): labelCounts[currentLabel] = 0
        labelCounts[currentLabel] += 1
    shannonEnt = 0.0
    for key in labelCounts:
        prob = float(labelCounts[key])/numEntries
        shannonEnt -= prob * log(prob,2) #log base 2
    return shannonEnt
划分数据集:对于给定的数据集,循环其每一个特征,计算特征对应的香农熵,选取其中熵值最小(信息增益最大)的特征作为划分的特征:
def chooseBestFeatureToSplit(dataSet):
    numFeatures = len(dataSet[0]) - 1      #the last column is used for the labels
    baseEntropy = calcShannonEnt(dataSet)
    bestInfoGain = 0.0; bestFeature = -1
    for i in range(numFeatures):        #iterate over all the features
        featList = [example[i] for example in dataSet]#create a list of all the examples of this feature
        uniqueVals = set(featList)       #get a set of unique values
        newEntropy = 0.0
        for value in uniqueVals:
            subDataSet = splitDataSet(dataSet, i, value)
            prob = len(subDataSet)/float(len(dataSet))
            newEntropy += prob * calcShannonEnt(subDataSet)
        infoGain = baseEntropy - newEntropy     #calculate the info gain; ie reduction in entropy
        if (infoGain > bestInfoGain):       #compare this to the best gain so far
            bestInfoGain = infoGain         #if better than current best, set to best
            bestFeature = i
    return bestFeature                      #returns an integer
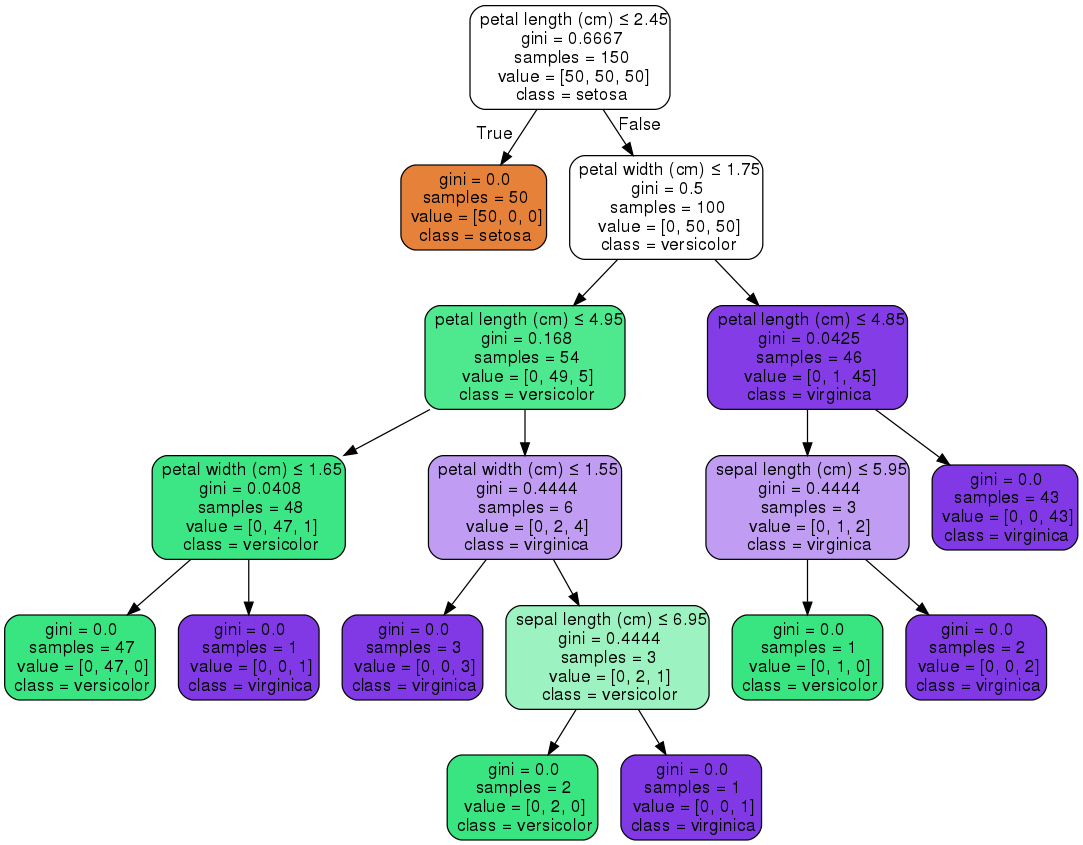
sklearn版本
对于iris数据集应用决策树,过程中会搜索选取不同的特征及其阈值,以作为分隔的特征(节点):
from sklearn.datasets import load_iris
from sklearn import tree

# Load in our dataset
iris_data = load_iris()

# Initialize our decision tree object
classification_tree = tree.DecisionTreeClassifier()

# Train our decision tree (tree induction + pruning)
classification_tree = classification_tree.fit(iris_data.data, iris_data.target)

import graphviz
dot_data = tree.export_graphviz(classification_tree, out_file=None,
                     feature_names=iris.feature_names,
                     class_names=iris.target_names,
                     filled=True, rounded=True,
                     special_characters=True)
graph = graphviz.Source(dot_data)
graph.render("iris")
参考
- 机器学习实战第3章
- Lecture 15: Tree-based Algorithms
- A Guide to Decision Trees for Machine Learning and Data Science
- 三种决策树算法(ID3, CART, C4.5)及Python实现
- 决策树模型 ID3/C4.5/CART算法比较
If you link this blog, please refer to this page, thanks!
Post link:https://tsinghua-gongjing.github.io/posts/decision_tree.html
Previous:
Think Stats: distribution calculation
Next:
随机森林
Latest articles
Links
- ZhangLab , RISE database , THU life , THU info
- Data analysis: pandas , numpy , scipy
- ML/DL: sklearn , sklearn(中文) , pytorch
- Visualization: seaborn , matplotlib , gallery
- Github: me