目录
交叉验证:评估模型的表现
1. 计算交叉验证的指标(分数等):函数cross_val_score
>>> from sklearn.model_selection import cross_val_score
>>> clf = svm.SVC(kernel='linear', C=1)

# cv=5指重复5次交叉验证,默认每次是5fold
>>> scores = cross_val_score(clf, iris.data, iris.target, cv=5)
>>> scores
array([0.96..., 1.  ..., 0.96..., 0.96..., 1.        ])

# 计算平均得分、95%置信区间
>>> print("Accuracy: %0.2f (+/- %0.2f)" % (scores.mean(), scores.std() * 2))
Accuracy: 0.98 (+/- 0.03)
2. 可通过scoring参数指定计算特定的分数值
>>> from sklearn import metrics
>>> scores = cross_val_score(
...     clf, iris.data, iris.target, cv=5, scoring='f1_macro')
>>> scores
array([0.96..., 1.  ..., 0.96..., 0.96..., 1.        ])
3. 自行设定交叉验证器,更好的控制交叉验证过程
默认的情况下,cross_val_score不能直接指定划分的具体细节(比如训练集测试集的比例,初始化值,重复次数)等,可以自行设定好之后,传给其参数cv,这样能够获得更好的控制:
>>> from sklearn.model_selection import ShuffleSplit
>>> n_samples = iris.data.shape[0]
>>> cv = ShuffleSplit(n_splits=5, test_size=0.3, random_state=0)
>>> cross_val_score(clf, iris.data, iris.target, cv=cv)
array([0.977..., 0.977..., 1.  ..., 0.955..., 1.        ])
4. 获得多个度量值
默认的,cross_val_score只能计算一个类型的分数,要想获得多个度量值,可用函数cross_validate:
>>> from sklearn.model_selection import cross_validate
>>> from sklearn.metrics import recall_score
>>> scoring = ['precision_macro', 'recall_macro']
>>> clf = svm.SVC(kernel='linear', C=1, random_state=0)
>>> scores = cross_validate(clf, iris.data, iris.target, scoring=scoring,
...                         cv=5)

# 默认是运行和打分时间+测试集的指标
>>> sorted(scores.keys())
['fit_time', 'score_time', 'test_precision_macro', 'test_recall_macro']
>>> scores['test_recall_macro']
array([0.96..., 1.  ..., 0.96..., 0.96..., 1.        ])

# 可以指定return_train_score参数,同时返回训练集的度量指标值
>>> scores = cross_validate(clf, iris.data, iris.target, scoring=scoring,
...                         cv=5, return_train_score=True)
>>> sorted(scores.keys())
['fit_time', 'score_time', 'test_prec_macro', 'test_rec_macro',
 'train_prec_macro', 'train_rec_macro']
>>> scores['train_rec_macro']
array([0.97..., 0.97..., 0.99..., 0.98..., 0.98...])
5. 数据切分:k-fold & repeat k-fold
通常使用k-fold对数据进行切分:
>>> import numpy as np
>>> from sklearn.model_selection import KFold

>>> X = ["a", "b", "c", "d"]
>>> kf = KFold(n_splits=2)
>>> for train, test in kf.split(X):
...     print("%s  %s" % (train, test))
[2 3] [0 1]
[0 1] [2 3]
一般k-fold需要重复多次,下面是重复2次2-fold:
>>> import numpy as np
>>> from sklearn.model_selection import RepeatedKFold
>>> X = np.array([[1, 2], [3, 4], [1, 2], [3, 4]])
>>> random_state = 12883823
>>> rkf = RepeatedKFold(n_splits=2, n_repeats=2, random_state=random_state)
>>> for train, test in rkf.split(X):
...     print("%s  %s" % (train, test))
...
[2 3] [0 1]
[0 1] [2 3]
[0 2] [1 3]
[1 3] [0 2]
6. 留一法、留P法 交叉验证
每次一个样本用于测试:
>>> from sklearn.model_selection import LeaveOneOut

>>> X = [1, 2, 3, 4]
>>> loo = LeaveOneOut()
>>> for train, test in loo.split(X):
...     print("%s  %s" % (train, test))
[1 2 3] [0]
[0 2 3] [1]
[0 1 3] [2]
[0 1 2] [3]
每次P个样本用于测试:
>>> from sklearn.model_selection import LeavePOut

>>> X = np.ones(4)
>>> lpo = LeavePOut(p=2)
>>> for train, test in lpo.split(X):
...     print("%s  %s" % (train, test))
[2 3] [0 1]
[1 3] [0 2]
[1 2] [0 3]
[0 3] [1 2]
[0 2] [1 3]
[0 1] [2 3]
作为一般规则,大多数作者和经验证据表明, 5- 或者 10- 交叉验证应该优于 留一法交叉验证。
7. 随机排列交叉验证
函数ShuffleSplit,先将样本打散,再换分为一对训练测试集合,这也是上面的3. 自行设定交叉验证器,更好的控制交叉验证过程提到的,更好的控制交叉验证所用到的函数:
>>> from sklearn.model_selection import ShuffleSplit
>>> X = np.arange(5)
>>> ss = ShuffleSplit(n_splits=3, test_size=0.25,
...     random_state=0)
>>> for train_index, test_index in ss.split(X):
...     print("%s  %s" % (train_index, test_index))
...
[1 3 4] [2 0]
[1 4 3] [0 2]
[4 0 2] [1 3]
8. 具有标签的分层交叉验证
分层k-fold:每个fold里面,各类别样本比例大致相当:
>>> from sklearn.model_selection import StratifiedKFold

>>> X = np.ones(10)
>>> y = [0, 0, 0, 0, 1, 1, 1, 1, 1, 1]
>>> skf = StratifiedKFold(n_splits=3)
>>> for train, test in skf.split(X, y):
...     print("%s  %s" % (train, test))
[2 3 6 7 8 9] [0 1 4 5]
[0 1 3 4 5 8 9] [2 6 7]
[0 1 2 4 5 6 7] [3 8 9]
9. 分组数据的交叉验证
分组k-fold:同一组在测试和训练中不被同时表示,某一个组的数据,要么出现在训练集,要么出现在测试集:
>>> from sklearn.model_selection import GroupKFold

>>> X = [0.1, 0.2, 2.2, 2.4, 2.3, 4.55, 5.8, 8.8, 9, 10]
>>> y = ["a", "b", "b", "b", "c", "c", "c", "d", "d", "d"]
>>> groups = [1, 1, 1, 2, 2, 2, 3, 3, 3, 3]

>>> gkf = GroupKFold(n_splits=3)
>>> for train, test in gkf.split(X, y, groups=groups):
...     print("%s  %s" % (train, test))
[0 1 2 3 4 5] [6 7 8 9]
[0 1 2 6 7 8 9] [3 4 5]
[3 4 5 6 7 8 9] [0 1 2]
分组:留一组
>>> from sklearn.model_selection import LeaveOneGroupOut

>>> X = [1, 5, 10, 50, 60, 70, 80]
>>> y = [0, 1, 1, 2, 2, 2, 2]
>>> groups = [1, 1, 2, 2, 3, 3, 3]
>>> logo = LeaveOneGroupOut()
>>> for train, test in logo.split(X, y, groups=groups):
...     print("%s  %s" % (train, test))
[2 3 4 5 6] [0 1]
[0 1 4 5 6] [2 3]
[0 1 2 3] [4 5 6]
分组:留P组:
>>> from sklearn.model_selection import LeavePGroupsOut

>>> X = np.arange(6)
>>> y = [1, 1, 1, 2, 2, 2]
>>> groups = [1, 1, 2, 2, 3, 3]
>>> lpgo = LeavePGroupsOut(n_groups=2)
>>> for train, test in lpgo.split(X, y, groups=groups):
...     print("%s  %s" % (train, test))
[4 5] [0 1 2 3]
[2 3] [0 1 4 5]
[0 1] [2 3 4 5]
10. 时间序列分割
>>> from sklearn.model_selection import TimeSeriesSplit

>>> X = np.array([[1, 2], [3, 4], [1, 2], [3, 4], [1, 2], [3, 4]])
>>> y = np.array([1, 2, 3, 4, 5, 6])
>>> tscv = TimeSeriesSplit(n_splits=3)
>>> print(tscv)
TimeSeriesSplit(max_train_size=None, n_splits=3)
>>> for train, test in tscv.split(X):
...     print("%s  %s" % (train, test))
[0 1 2] [3]
[0 1 2 3] [4]
[0 1 2 3 4] [5]
超参数调整
1. 参数 vs 超参数
参考:手把手教你区分参数和超参数 其原英文版, 超参数优化
- 参数(model parameter):模型参数是模型内部的配置变量,其值可以根据数据进行估计。
- 模型在进行预测时需要它们。
- 它们的值定义了可使用的模型。
- 他们是从数据估计或获悉的。
- 它们通常不由编程者手动设置。
- 他们通常被保存为学习模型的一部分。
-
会随着训练进行更新,以优化从而减小损失函数值。
- 示例:
- 神经网络中的权重。
- 支持向量机中的支持向量。
- 线性回归或逻辑回归中的系数。
- 超参数(model hyperparameter):模型超参数是模型外部的配置,其值无法从数据中估计,一般是手动设置的,并且在过程中用于帮助估计模型参数。
- 它们通常用于帮助估计模型参数。
- 它们通常由人工指定。
- 他们通常可以使用启发式设置。
- 他们经常被调整为给定的预测建模问题。
- 不直接参与到训练过程,属于配置变量,往往是恒定的。
-
一般我们都是通过观察在训练过程中的监测指标如损失函数的值或者测试/验证集上的准确率来判断这个模型的训练状态,并通过修改超参数来提高模型效率。
- 示例:
- 训练神经网络的学习速率、优化器、迭代次数、激活函数等。
- 用于支持向量机的C和sigma超参数。
- K最近邻的K。
2. 超参数优化
构造估计器时被提供的任何参数或许都能被优化,搜索包括:
- 估计器(回归器或分类器,例如 sklearn.svm.SVC())
- 参数空间
- 搜寻或采样候选的方法
- 交叉验证方案
- 计分函数
3. 超参数优化:网格搜索
网格搜索函数:GridSearchCV,候选参数通过参数param_grid传入,参数值的所有可能组合都会被评估,以估计最佳组合。下面是文本特征提取的例子:
# 设定不同的pipeline
pipeline = Pipeline([
    ('vect', CountVectorizer()),
    ('tfidf', TfidfTransformer()),
    ('clf', SGDClassifier(tol=1e-3)),
])

# 设定要搜索的参数及值空间
parameters = {
    'vect__max_df': (0.5, 0.75, 1.0),
    # 'vect__max_features': (None, 5000, 10000, 50000),
    'vect__ngram_range': ((1, 1), (1, 2)),  # unigrams or bigrams
    # 'tfidf__use_idf': (True, False),
    # 'tfidf__norm': ('l1', 'l2'),
    'clf__max_iter': (20,),
    'clf__alpha': (0.00001, 0.000001),
    'clf__penalty': ('l2', 'elasticnet'),
    # 'clf__max_iter': (10, 50, 80),
}

if __name__ == "__main__":
    # find the best parameters for both the feature extraction and the classifier
    grid_search = GridSearchCV(pipeline, parameters, cv=5,
                               n_jobs=-1, verbose=1)
4. 超参数优化:随机参数优化
随机参数优化: - 实现了参数的随机搜索 - 从可能的参数值的分布中进行取样 - 可以选择独立于参数个数和可能值的预算 - 添加不影响性能的参数不会降低效率
# specify parameters and distributions to sample from
param_dist = {"max_depth": [3, None],
              "max_features": sp_randint(1, 11),
              "min_samples_split": sp_randint(2, 11),
              "bootstrap": [True, False],
              "criterion": ["gini", "entropy"]}

# run randomized search
n_iter_search = 20
random_search = RandomizedSearchCV(clf, param_distributions=param_dist,
                                   n_iter=n_iter_search, cv=5, iid=False)
5. 超参数搜索技巧
-
指定目标量度:可以使用不同的度量参数进行评估
-
指定多个指标:上面的网格搜索和随机搜索均允许指定多个评分指标
X, y = make_hastie_10_2(n_samples=8000, random_state=42)

scoring = {'AUC': 'roc_auc', 'Accuracy': make_scorer(accuracy_score)}

gs = GridSearchCV(DecisionTreeClassifier(random_state=42),
                  param_grid={'min_samples_split': range(2, 403, 10)},
                  scoring=scoring, cv=5, refit='AUC', return_train_score=True)
gs.fit(X, y)
results = gs.cv_results_
-
模型选择:开发和评估,评估时在hold-out数据集上进行
-
并发机制:参数设定
n_jobs=-1即可使得计算并行进行
6. 暴力搜索的替代
有一些优化的参数搜索方案被开发出来,比如:linear_model.ElasticNetCV, linear_model.LassoCV
量化模型预测质量
1. sklearn提供3种方法
- 估计器得分的方法(Estimator score method)
- 评分参数(Scoring parameter)
- 指标函数(Metric functions):
metrics模块实现了针对特定目的评估预测误差的函数
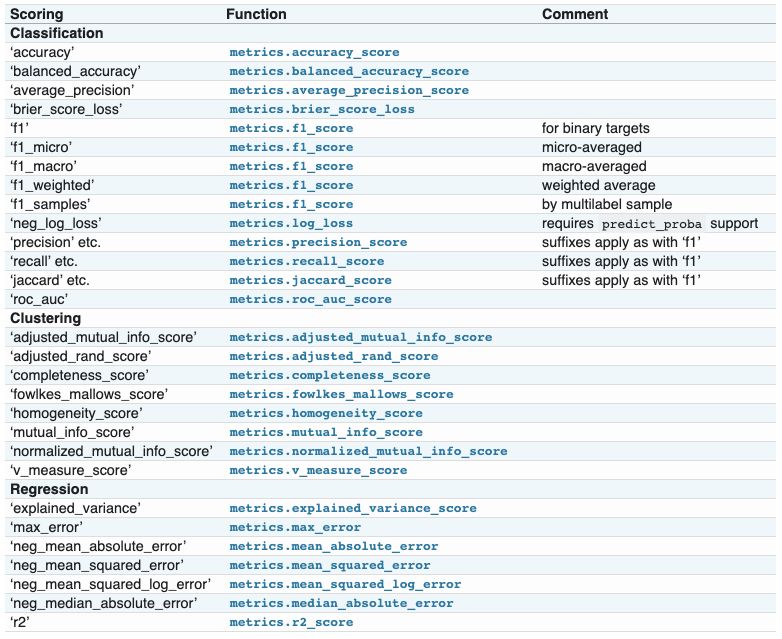
2. 评分参数(Scoring parameter): 分类、聚类、回归
在评估模型的效果时,可以指定特定的评分策略,通过参数scoring进行指定:
>>> from sklearn import svm, datasets
>>> from sklearn.model_selection import cross_val_score
>>> iris = datasets.load_iris()
>>> X, y = iris.data, iris.target
>>> clf = svm.SVC(probability=True, random_state=0)
>>> cross_val_score(clf, X, y, scoring='neg_log_loss')
array([-0.07..., -0.16..., -0.06...])
>>> model = svm.SVC()
>>> cross_val_score(model, X, y, scoring='wrong_choice')
3. 使用metric函数定义评分策略
sklearn.metrics模块可提供评估预测分数或者误差_score:预测分数值,越大越好_error,_loss:损失值,越小越好- 为什么不在上面的
scoring策略中指定?这些评价函数需要额外的参数,不是直接指定一个评估名称字符即可的!
4. metric函数:现有函数的非默认参数指定
需要调用make_scorer函数把评估的量值变成一个打分对象(scoring object):
>>> from sklearn.metrics import fbeta_score, make_scorer
>>> ftwo_scorer = make_scorer(fbeta_score, beta=2)
>>> from sklearn.model_selection import GridSearchCV
>>> from sklearn.svm import LinearSVC
>>> grid = GridSearchCV(LinearSVC(), param_grid={'C': [1, 10]}, scoring=ftwo_scorer)
5. metric函数:构建全新的自定义打分函数
>>> import numpy as np
>>> def my_custom_loss_func(y_true, y_pred):
...     diff = np.abs(y_true - y_pred).max()
...     return np.log1p(diff)

>>> score = make_scorer(my_custom_loss_func, greater_is_better=False)
>>> X = [[1], [1]]
>>> y = [0, 1]
>>> from sklearn.dummy import DummyClassifier
>>> clf = DummyClassifier(strategy='most_frequent', random_state=0)
>>> clf = clf.fit(X, y)
>>> my_custom_loss_func(clf.predict(X), y)
0.69...
>>> score(clf, X, y)
-0.69...
6. 指定多个评估参数
在几个函数(GridSearchCV,RandomizedSearchCV,cross_validate)中,均有scoring参数,可以指定多个评估参数,可以通过列表指定名称,也可以通过字典:
>>> scoring = ['accuracy', 'precision']

>>> scoring = {'accuracy': make_scorer(accuracy_score),
...            'prec': 'precision'}

>>> cv_results = cross_validate(svm.fit(X, y), X, y,
...                             scoring=scoring, cv=5)
7. 分类指标
仅二分类:
| Metric | Formule |
|---|---|
| precision_recall_curve | \(precision=\frac{TP}{TP+FP}, recall=\frac{TP}{TP+FN}\) |
| roc_curve | \(FPR=\frac{FP}{FP+TP}, TPR=\frac{TP}{TP+FN}\) |
可用于多分类:
| Metric | Formule |
|---|---|
| cohen_kappa_score | \(\kappa = (p_o - p_e) / (1 - p_e)\) |
| confusion_matrix | By definition a confusion matrix C is such that C_{i, j} is equal to the number of observations known to be in group i but predicted to be in group j.Thus in binary classification, the count of true negatives is C_{0,0}, false negatives is C_{1,0}, true positives is C_{1,1} and false positives is C_{0,1}. |
| hinge_loss(binary) | \(L_\text{Hinge}(y, w) = \max\left\{1 - wy, 0\right\} = \left|1 - wy\right|_+\) |
| hinge_loss(multi) | \(L_\text{Hinge}(y_w, y_t) = \max\left\{1 + y_t - y_w, 0\right\}\) |
| mattews_corrcoef(binary) | \(MCC = \frac{tp \times tn - fp \times fn}{\sqrt{(tp + fp)(tp + fn)(tn + fp)(tn + fn)}}\),马修斯相关系数 |
| mattews_corrcoef(multi) | \(MCC = \frac{c \times s - \sum_{k}^{K} p_k \times t_k}{\sqrt{(s^2 - \sum_{k}^{K} p_k^2) \times (s^2 - \sum_{k}^{K} t_k^2)}}\) |
可用于multilabel case(有多个标签的):
| Metric | Formule |
|---|---|
| accuracy_score | \(\texttt{accuracy}(y, \hat{y}) = \frac{1}{n_\text{samples}} \sum_{i=0}^{n_\text{samples}-1} 1(\hat{y}_i = y_i)\) |
| classfication_report | precision,recall,f1-score,support, accuracy,macro avg,weighted avg |
| f1_score | \(F_1 = \frac{2 \times \text{precision} \times \text{recall}}{ \text{precision} + \text{recall}}\) |
| fbeta_score | \(F_\beta = (1 + \beta^2) \frac{\text{precision} \times \text{recall}}{\beta^2 \text{precision} + \text{recall}}\) |
| hamming_loss | \(L_{Hamming}(y, \hat{y}) = \frac{1}{n_\text{labels}} \sum_{j=0}^{n_\text{labels} - 1} 1(\hat{y}_j \not= y_j)\) |
| jaccard_similarity_score | \(J(y_i, \hat{y}_i) = \frac{|y_i \cap \hat{y}_i|}{|y_i \cup \hat{y}_i|}\) |
| log_loss(binary) | \(L_{\log}(y, p) = -\log \operatorname{Pr}(y|p) \\ = -(y \log (p) + (1 - y) \log (1 - p))\),又被称为 logistic regression loss(logistic 回归损失)或者 cross-entropy loss(交叉熵损失) 定义在 probability estimates (概率估计) |
| log_loss(multi) | \(L_{\log}(Y, P) = -\log \operatorname{Pr}(Y|P) \\ = - \frac{1}{N} \sum_{i=0}^{N-1} \sum_{k=0}^{K-1} y_{i,k} \log p_{i,k}\) |
| precision_recall_fscore_support | Compute precision, recall, F-measure and support for each class |
| recall_score | \(\frac{TP}{TP+FN}\) |
| zero_one_loss | \(L_{0-1}(y_i, \hat{y}_i) = 1(\hat{y}_i \not= y_i)\) |
8. 回归指标
| Metric | Formule |
|---|---|
| explained_variance_score | \(explained\_{}variance(y, \hat{y}) = 1 - \frac{Var\{ y - \hat{y}\}}{Var\{y\}}\) |
| max_error | \(\text{Max Error}(y, \hat{y}) = max(| y_i - \hat{y}_i |)\) |
| mean_absolute_error | \(\text{MAE}(y, \hat{y}) = \frac{1}{n_{\text{samples}}} \sum_{i=0}^{n_{\text{samples}}-1} \left| y_i - \hat{y}_i \right|\) |
| mean_squared_error | \(\text{MSE}(y, \hat{y}) = \frac{1}{n_\text{samples}} \sum_{i=0}^{n_\text{samples} - 1} (y_i - \hat{y}_i)^2.\) |
| mean_squared_log_error | \(\text{MSLE}(y, \hat{y}) = \frac{1}{n_\text{samples}} \sum_{i=0}^{n_\text{samples} - 1} (\log_e (1 + y_i) - \log_e (1 + \hat{y}_i) )^2\) |
| median_absolute_error | \(\text{MedAE}(y, \hat{y}) =\text{median}(\mid y_1 - \hat{y}_1 \mid, \ldots, \mid y_n -\hat{y}_n \mid)\) |
| r2_score | \(R^2(y, \hat{y}) = 1 - \frac{\sum_{i=1}^{n} (y_i - \hat{y}_i)^2}{\sum_{i=1}^{n} (y_i - \bar{y})^2}\) |
验证曲线与学习曲线
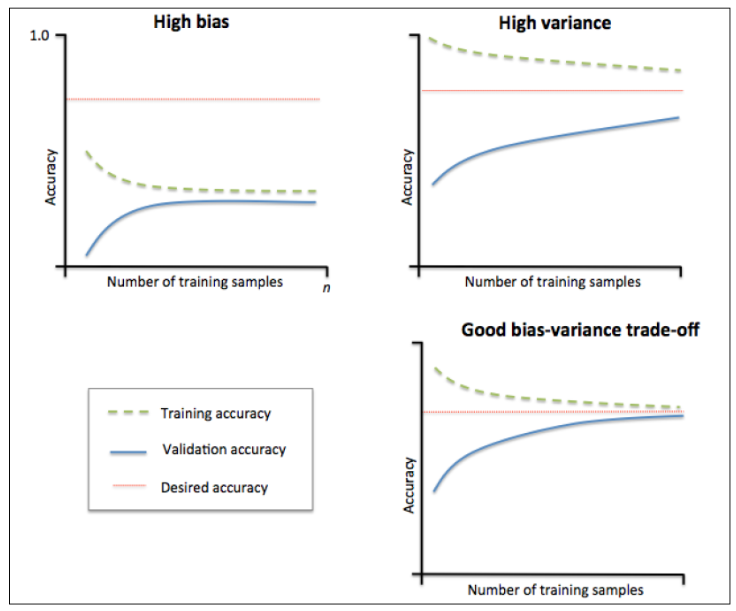
1. 泛化误差=偏差+方差+噪声
- 偏差:不同训练集的平均误差
- 方差:模型对训练集的变化有多敏感
- 噪声:数据的属性
2. 偏差、方差困境
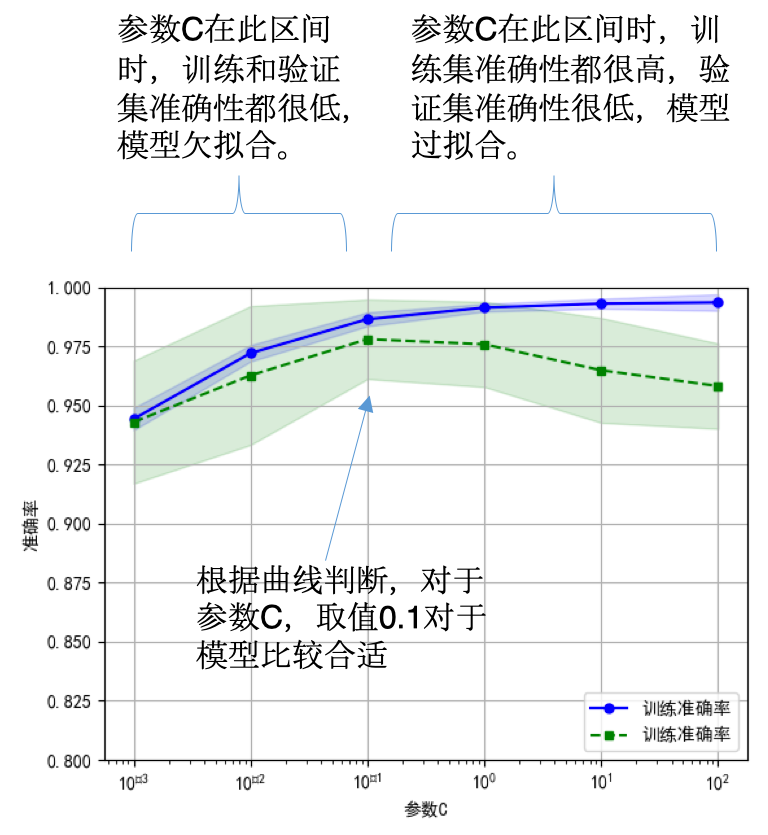
- 1)选择合适的学习算法和超参数【验证曲线】
- 2)使用更多的训练数据【学习曲线】
3. 验证曲线
>>> np.random.seed(0)
>>> iris = load_iris()
>>> X, y = iris.data, iris.target
>>> indices = np.arange(y.shape[0])
>>> np.random.shuffle(indices)
>>> X, y = X[indices], y[indices]

>>> train_scores, valid_scores = validation_curve(Ridge(), X, y, "alpha",
...                                               np.logspace(-7, 3, 3),
...                                               cv=5)
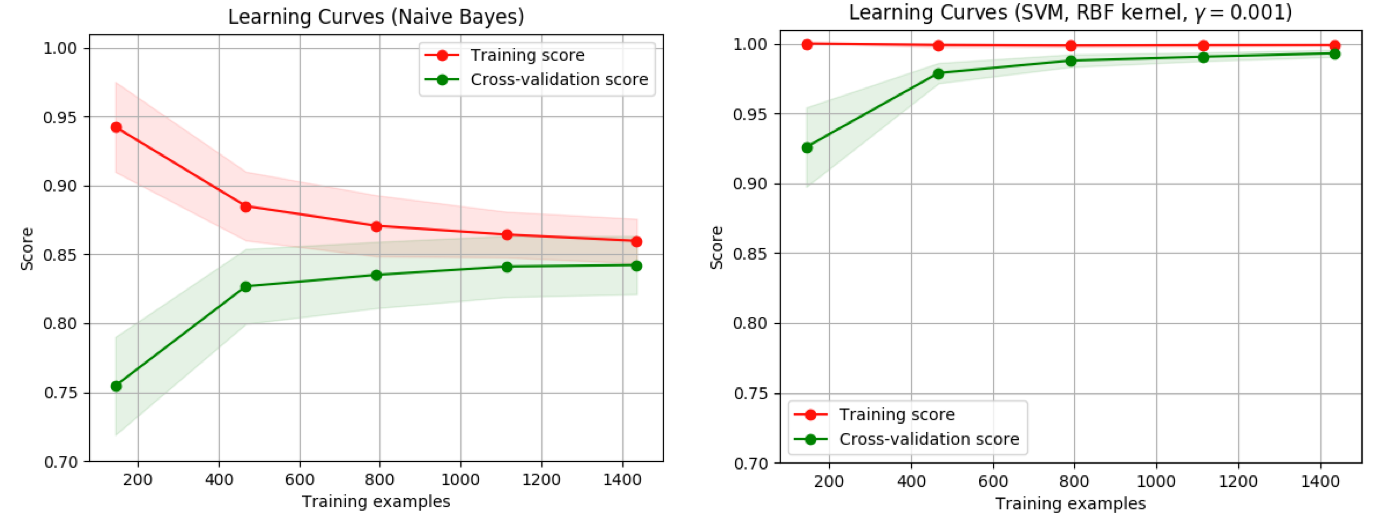
4. 学习曲线
- 训练样本数量和模型性能度量值(比如训练集和验证集的准确率)之间的关系
- 帮助我们发现从增加更多的训 练数据中能获益多少
- 判断模型的偏差和方差

- 不同的曲线可以看出样本对模型性能的影响,比如下面的例子
- 左边的:当增大训练样本数目时,训练集和验证集都收敛于较低的分数,即使再增加样本数量,不会收益
- 右边的:当增加训练样本时,验证分数有很大提高,能够收益于样本数目的增加

>>> from sklearn.model_selection import learning_curve
>>> from sklearn.svm import SVC

>>> train_sizes, train_scores, valid_scores = learning_curve(
...     SVC(kernel='linear'), X, y, train_sizes=[50, 80, 110], cv=5)
>>> train_sizes
array([ 50, 80, 110])
>>> train_scores
array([[0.98..., 0.98 , 0.98..., 0.98..., 0.98...],
       [0.98..., 1.   , 0.98..., 0.98..., 0.98...],
       [0.98..., 1.   , 0.98..., 0.98..., 0.99...]])
>>> valid_scores
array([[1. ,  0.93...,  1. ,  1. ,  0.96...],
       [1. ,  0.96...,  1. ,  1. ,  0.96...],
       [1. ,  0.96...,  1. ,  1. ,  0.96...]])
模型持久化(存储)
可以使用pickle模块操作模型:
- 保存已经训练好的模型:
s = pickle.dumps(clf) - 之后直接导入使用:
clf2 = pickle.loads(s) - 用于新数据的预测:
clf2.predict(X[0:1])
>>> from sklearn import svm
>>> from sklearn import datasets
>>> clf = svm.SVC()
>>> iris = datasets.load_iris()
>>> X, y = iris.data, iris.target
>>> clf.fit(X, y)
SVC(C=1.0, cache_size=200, class_weight=None, coef0=0.0,
 decision_function_shape='ovr', degree=3, gamma='auto', kernel='rbf',
 max_iter=-1, probability=False, random_state=None, shrinking=True,
 tol=0.001, verbose=False)

>>> import pickle
>>> s = pickle.dumps(clf)
>>> clf2 = pickle.loads(s)
>>> clf2.predict(X[0:1])
array([0])
>>> y[0]
0
参考
If you link this blog, please refer to this page, thanks!
Post link:https://tsinghua-gongjing.github.io/posts/model_evaluation_selection_sklearn.html
Latest articles
Links
- ZhangLab , RISE database , THU life , THU info
- Data analysis: pandas , numpy , scipy
- ML/DL: sklearn , sklearn(中文) , pytorch
- Visualization: seaborn , matplotlib , gallery
- Github: me
