Usage of sed command
2016-03-11
- convert DNA to RNA (source)
- combine every two lines (source)
- Calling from python subprocess (source)
- Replace new line with coma stackexchange
- 替换一个或者多个空格为tab
convert DNA to RNA (source)
sed '/^[^>]/ y/uT/tU/' combine_all.full.fa > combine_all.full.RNA.fa
combine every two lines (source)
[zhangqf7@loginview02 RIP]$ grep -v "^tx" predict_MO_decay.overlap.inall.motif.decay.txt|head
NM_001077537    3657    3663    0.2578571428571429      common  sphere
NM_001077537    3657    3663    0.19057142857142856     common  shield
NM_201059       2029    2035    0.2177142857142857      common  sphere
NM_201059       2029    2035    0.15457142857142858     common  shield
NM_201059       1880    1886    0.01    common  sphere
NM_201059       1880    1886    0.022857142857142857    common  shield
NM_001077537    3425    3431    0.1821428571428572      common  sphere
NM_001077537    3425    3431    0.15214285714285716     common  shield
NM_001256642    1533    1539    0.07742857142857143     common  sphere
NM_001256642    1533    1539    0.11457142857142855     common  shield
[zhangqf7@loginview02 RIP]$ grep -v "^tx" predict_MO_decay.overlap.inall.motif.decay.txt|head|sed 'N;s/\n/\t/'
NM_001077537    3657    3663    0.2578571428571429      common  sphere  NM_001077537    3657    3663    0.19057142857142856     common  shield
NM_201059       2029    2035    0.2177142857142857      common  sphere  NM_201059       2029    2035    0.15457142857142858     common  shield
NM_201059       1880    1886    0.01    common  sphere  NM_201059       1880    1886    0.022857142857142857    common  shield
NM_001077537    3425    3431    0.1821428571428572      common  sphere  NM_001077537    3425    3431    0.15214285714285716     common  shield
NM_001256642    1533    1539    0.07742857142857143     common  sphere  NM_001256642    1533    1539    0.11457142857142855     common  shield
Calling from python subprocess (source)
subprocess.call(['''grep -v "^tx" %s|sed "N;s/\n/\t/" > %s'''%(savefn, savefn.replace('.txt', '.merge.txt'))], shell=True)
cause error: sed: -e expression #1, char 2: extra characters after command, beacuse there is slash \ in the regular expression, which should be escaped as below, now it works:
subprocess.call(['''grep -v "^tx" %s|sed "N;s/\\n/\\t/" > %s'''%(savefn, savefn.replace('.txt', '.merge.txt'))], shell=True)
Replace new line with coma stackexchange
[zhangqf7@loginview02 60]$ ll|awk '{print $9}'|cut -d "_" -f 1-2|sort|uniq|head

NM_001003422
NM_001003429
NM_001004577
NM_001017572
NM_001025520
NM_001025533
NM_001033107
NM_001044395
NM_001045231
[zhangqf7@loginview02 60]$ ll|awk '{print $9}'|cut -d "_" -f 1-2|sort|uniq|head|sed ':a;N;$!ba;s/\n/,/g'
,NM_001003422,NM_001003429,NM_001004577,NM_001017572,NM_001025520,NM_001025533,NM_001033107,NM_001044395,NM_001045231
替换一个或者多个空格为tab
➜  git:(master) ✗ head test.txt
    1 U       0    2    0    1
    2 G       1    3    0    2
    3 G       2    4    0    3
    4 G       3    5    0    4
    5 C       4    6    0    5
    6 C       5    7  191    6
    7 G       6    8  189    7
    8 G       7    9  188    8
    9 G       8   10  187    9
   10 A       9   11  186   10

# 每个[ ]包含一个空格
# *:表示0个或者多个
# 所以>=1个:[ ][ ]*
➜  git:(master) ✗ head test.txt|sed 's/^[ ]*//g'|sed 's/[ ][ ]*/\t/g'
1       U       0       2       0       1
2       G       1       3       0       2
3       G       2       4       0       3
4       G       3       5       0       4
5       C       4       6       0       5
6       C       5       7       191     6
7       G       6       8       189     7
8       G       7       9       188     8
9       G       8       10      187     9
10      A       9       11      186     10
Read full-text »
读后感-克莱儿-麦克福尔《摆渡人》
2016-01-23
克莱儿-麦克福尔 《摆渡人》
一部很独特的小说,一个很温暖的故事。在发生火车事故之后,“醒来”的迪伦,遇到了自己灵魂的摆渡人崔斯坦。他们需要穿越映射灵魂内心活动的荒原,从一座安全屋到另一个安全屋,直到荒原的边界,便可到达目的地。其间会有恶魔在黑暗中,想要吞噬被摆渡的灵魂。在一路的坎坷中,两人渐生情愫。从彼此的不相识到无话不说,迪伦也不再是出场时那个跌跌撞撞的小女孩,已然变成了敢爱敢恨、为爱痴狂的大女生,崔斯坦也在用生命去保卫着这个令他动容的灵魂。总体是一个欢乐的结局,因为迪伦的坚持,他们通过尝试,逆反折回进入荒原的地方,回到了人间,都变成了有真实肉体的人。
整个故事的前半截很平淡甚至老套(男主对女主没那么好,慢慢相互喜欢,男友力MAX等),只是换成了不常见的场景—荒原中摆渡灵魂。因为故事情节不多,场景设置有限,所以很多的细节描写,以及人物的性情变化都很丰满。当到了荒原边界的时候,崔斯坦看着自己所爱之人,踏入另一个世界,但是自己无法摆脱宿命的约束陪她一起,那一幕是多么的决绝。到了后半部分,当迪伦决定返回寻找崔斯坦,通过问询萨丽等,她的光芒一下就笼罩了全局。她愿意为爱去涉险,无论征途中遇到了多么大的阻力和孤独,她始终坚信着一切都是值得的,这就是一个女孩在成长中最唯美的。很多时候缘分是相互的,因为摆渡灵魂,她成长了、勇敢了、爱了,他尝试了、挣扎了、爱了,最后终于走到了真实的世界里。
Read full-text »
Accumulation plot
2016-01-06
cumulative plot
basic concept
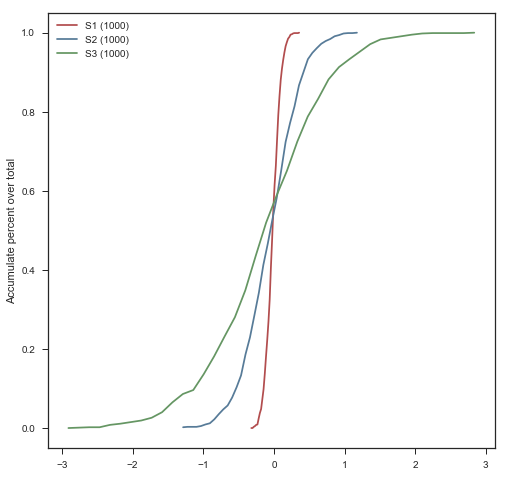
数据的累积分布,也即小于等于当前数据值的所有数据的概率分布,对于表示数据点在某个区间内出现的概率有很大的帮助。从数学上来说,累积分布函数(Cumulative Distribution Function, 简称CDF)是概率分布函数的积分。
python implementation
import numpy as np
import seaborn as sns

def sns_color_ls():
    return sns.color_palette("Set1", n_colors=8, desat=.5)*2

def cumulate_dist_plot(ls_ls,ls_ls_label,bins=40,title=None,ax=None,savefn=None,xlabel=None,ylabel=None,add_vline=None,add_hline=None,log2transform=0,xlim=None,ylim=None):
    if ax is None:
        with sns.axes_style("ticks"):
            fig,ax = plt.subplots(figsize=(8,8))

    color_ls = sns_color_ls()

    ls_ls_label = [j+' ('+str(len(i))+')' for i,j in zip(ls_ls,ls_ls_label)]

    if log2transform:
        ls_ls = [np.log2(i) for i in ls_ls]

    for n,ls in enumerate(ls_ls):
        values,base = np.histogram(ls,bins=bins)
        cumulative = np.cumsum(values)
        cumulative_norm = [i/float(len(ls)) for i in cumulative]
        ax.plot(base[:-1],cumulative_norm,color=color_ls[n],label=ls_ls_label[n])
        print "plot line num: %s"%(n)

    if xlabel is not None:
        ax.set_xlabel(xlabel)

    if ylabel is not None:
        ax.set_ylabel(ylabel)
    else:
        ax.set_ylabel("Accumulate percent over total")

    if title is not None:
        ax.set_title(title)

    if add_vline is not None:
        for vline in add_vline:
            ax.axvline(vline,ls="--", color='lightgrey')

    if add_hline is not None:
        for hline in add_hline:
            ax.axhline(hline,ls="--", color='lightgrey')

    if xlim is not None:
        ax.set_xlim(xlim[0], xlim[1])

    if ylim is not None:
        ax.set_ylim(ylim[0], ylim[1])

    ax.legend(loc="best")

    if savefn is not None:
        plt.savefig(savefn)
        plt.close()
mu1, sigma1 = 0, 0.1
mu2, sigma2 = 0, 0.4
mu3, sigma3 = 0, 0.8

s1 = np.random.normal(mu1, sigma1, 1000)
s2 = np.random.normal(mu2, sigma2, 1000)
s3 = np.random.normal(mu3, sigma3, 1000)

cumulate_dist_plot(ls_ls=[s1,s2,s3],ls_ls_label=['S1','S2','S3'],bins=40)
Read full-text »
Usage of grep command
2015-11-06
grep的用法
同时匹配多个pattern中的某一个 (OR)
grep "pattern1\|pattern2" file.txt
grep -E "pattern1|pattern2" file.txt
grep -e pattern1 -e pattern2 file.txt
egrep "pattern1|pattern2" file.txt
这种操作用其他的命令也可以实现,比如:
awk '/pattern1|pattern2/' file.txt
sed -e '/pattern1/b' -e '/pattern2/b' -e d file.txt
同时满足多个模式 (AND)
grep -E 'pattern1.*pattern2' file.txt # in that order
grep -E 'pattern1.*pattern2|pattern2.*pattern1' file.txt # in any order
grep 'pattern1' file.txt | grep 'pattern2' # in any order
用其他命令实现:
awk '/pattern1.*pattern2/' file.txt # in that order
awk '/pattern1/ && /pattern2/' file.txt # in any order

sed '/pattern1.*pattern2/!d' file.txt # in that order
sed '/pattern1/!d; /pattern2/!d' file.txt # in any order
匹配不满足给定模式的行
grep -v 'pattern1' file.txt
awk '!/pattern1/' file.txt
sed -n '/pattern1/!p' file.txt
匹配不满足多个给定模式的行
# https://unix.stackexchange.com/questions/104770/grep-multiple-pattern-negative-match
grep -vE 'pattern1|pattern2|pattern3' file.txt
只输出匹配的字符: 参数-o
grep -o NM_001131052 utr3.bed
Grep Compressed .gz Files At A Shell Prompt zgrep
$ zgrep 'word-to-search' /path/to/test.gz
$ zgrep 'GET /faq/a-long-url/' /path/to/access.log.gz
Read full-text »
Bar plot
2015-09-27
plot use plt.bar
import matplotlib.pyplot as plt

xticklabels = ('A', 'B', 'C', 'D')
x_pos = range(len(xticklabels))
y_values = [1,2,3,4]

plt.bar(x_pos, y_values, align='center', alpha=0.5)
plt.xticks(x_pos, xticklabels)
plt.ylabel('value')

plt.show()
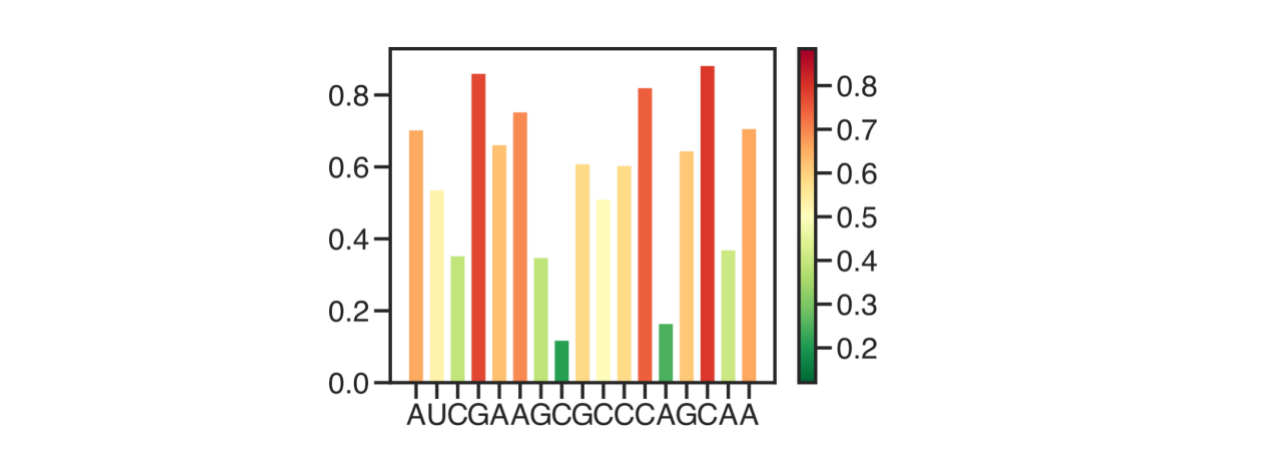
每个bar根据值上颜色,并画出colorbar
import random

from matplotlib import cm

def plot_bar(seq=None, shape_ls=None, colormap='RdYlGn_r', savefn=None):
    if shape_ls is None:
        shape_ls = [random.random() for i in range(len(seq))]
    shape_ls = np.array(shape_ls)
    if colormap == 'RdYlGn_r':
        colors = cm.RdYlGn_r(shape_ls, )
        plot = plt.scatter(shape_ls, shape_ls, c = shape_ls, cmap = colormap)
        plt.clf()
        plt.colorbar(plot)

    plt.bar(range(len(shape_ls)), shape_ls, color = colors)
    plt.xticks(range(len(seq)), list(seq))
    plt.tight_layout()
    plt.savefig(savefn)
    plt.close()

def main():
    ####################################################################
    ### define parser of arguments
    parser = argparse.ArgumentParser(description='Plot a list of .bed region signal dist')

    parser.add_argument('--seq', type=str, default='AUCGAAGCGCCCAGCAA', help='Sequence of the shape')
    parser.add_argument('--shape_ls', type=str, help='Shape value')
    parser.add_argument('--colormap', type=str, default='RdYlGn_r', help='colormap#choose from: https://matplotlib.org/3.1.0/tutorials/colors/colormaps.html')
    parser.add_argument('--savefn', type=str, default='/home/gongjing/project/shape_imputation/results/scheme_shape_bar.pdf', help='savefn')

    # get args
    args = parser.parse_args()
    plot_bar(seq=args.seq, shape_ls=args.shape_ls, colormap=args.colormap, savefn=args.savefn)

if __name__ == '__main__':
    main()
Read full-text »
Usage of awk command
2015-05-20
- Basic usage
- check common elements in two files of specific fields
- split string into a array, return length of the array
- by default awk array is not sorted, use asort
- check element in a array
- delete element in an array
- swap two variables
- set output filed separator
- print only last column
- take absolute value
- 将某个文件按照另一个文件的某一列进行排序
Basic usage
check common elements in two files of specific fields
awk 'NR==FNR{a[$1];next} $1 in a{print $1}' file1 file2
split string into a array, return length of the array
awk 'BEGIN{info="it is a test";lens=split(info,tA," ");print length(tA),lens;}'
4 4
by default awk array is not sorted, use asort
awk 'BEGIN{info="it is a test";split(info,tA," ");for(k in tA){print k,tA[k];}}'
4 test
1 it
2 is
3 a

# sort by element in alphabeta
awk 'BEGIN{info="it is a test";split(info,tA," ");asort(tA);for(k in tA){print k,tA[k];}}'
1 a
2 is
3 it
4 test
check element in a array
awk 'BEGIN{tB["a"]="a1";tB["b"]="b1";if( "c" in tB){print "ok";};for(k in tB){print k,tB[k];}}'
a a1
b b1
delete element in an array
awk 'BEGIN{tB["a"]="a1";tB["b"]="b1";delete tB["a"];for(k in tB){print k,tB[k];}}'
b b1
swap two variables
source: stackoverflow
awk ' { t = $1; $1 = $2; $2 = t; print; } ' input_file
set output filed separator
source: stackoverflow
# swap two columns, also keep tab as separator
awk 'BEGIN{FS="\t";OFS="\t";}{if($2>$3){t=$2;$2=$3;$3=t};if($5>$6){t=$5;$5=$6;$6=t;};print}' HEK293T.bedpe > HEK293T.sort.bedpe
print only last column
source: stackexchange
awk '{print $NF}' inputfile
take absolute value
source: Unix & Linux
# https://unix.stackexchange.com/questions/220588/how-to-take-the-absolute-value-using-awk

# define function: abs
$ echo "2 3"|awk '{print $1-$2}'
-1
$ echo "2 3"|awk 'function abs(v) {return v < 0 ? -v : v} {print abs($1-$2)}'
1

# round way: call sqrt function
$ echo "2 3"|awk '{print sqrt(($1-$2)^2)}'
1
将某个文件按照另一个文件的某一列进行排序
参考这里:
# 读取第2个文件,$1作为key,整行$0作为value值存储下来
# 读取第1个文件,因为每个$1都存在X2里面,所以判断直接打印
# 打印的是原先存储的值,也就是要排序的第2个文件
# 因而可以完成按照文件1对文件2进行排序
awk 'FNR==NR {x2[$1] = $0; next} $1 in x2 {print x2[$1]}' second first
Read full-text »
Distribution/hist plot
2015-04-12
Call hist function from plt stackoverflow
fig,ax = plt.subplots()

bins = np.linspace(0.3, 0.8, 70)

ax.hist(d_g['col1'], bins=bins)
mean1 = np.mean(d_g['col1'])
ax.hist(d_g['col2'], bins=bins)
mean2 = np.mean(d_g['col2'])

plt.axvline(x=mean1, ymin=0, ymax=1, ls='--')
plt.axvline(x=mean2, ymin=0, ymax=1, ls='--')

ax.spines['top'].set_visible(False)
ax.spines['right'].set_visible(False)
Call from sns.dist function
fig,ax = plt.subplots()

sns.distplot(d_g['col1'].dropna(), bins=100,kde=False, norm_hist=0, color='#d02e30',ax=ax, label='col1')
sns.distplot(d_g['col2'].dropna(), bins=100,kde=False, norm_hist=0, color='#447dab',ax=ax, label='col2')

mean1 = np.mean(d_g['col1'])
mean2 = np.mean(d_g['col2'])

ax.axvline(x=mean1, ymin=0, ymax=1, ls='--', color='#d02e30', )
ax.axvline(x=mean2, ymin=0, ymax=1, ls='--', color='#447dab', )

ax.spines['top'].set_visible(False)
ax.spines['right'].set_visible(False)
Read full-text »
Box plot
2015-02-06
iris = sns.load_dataset("iris")
iris.head()

sepal_length	sepal_width	petal_length	petal_width	species
0	5.1	3.5	1.4	0.2	setosa
1	4.9	3.0	1.4	0.2	setosa
2	4.7	3.2	1.3	0.2	setosa
3	4.6	3.1	1.5	0.2	setosa
4	5.0	3.6	1.4	0.2	setosa
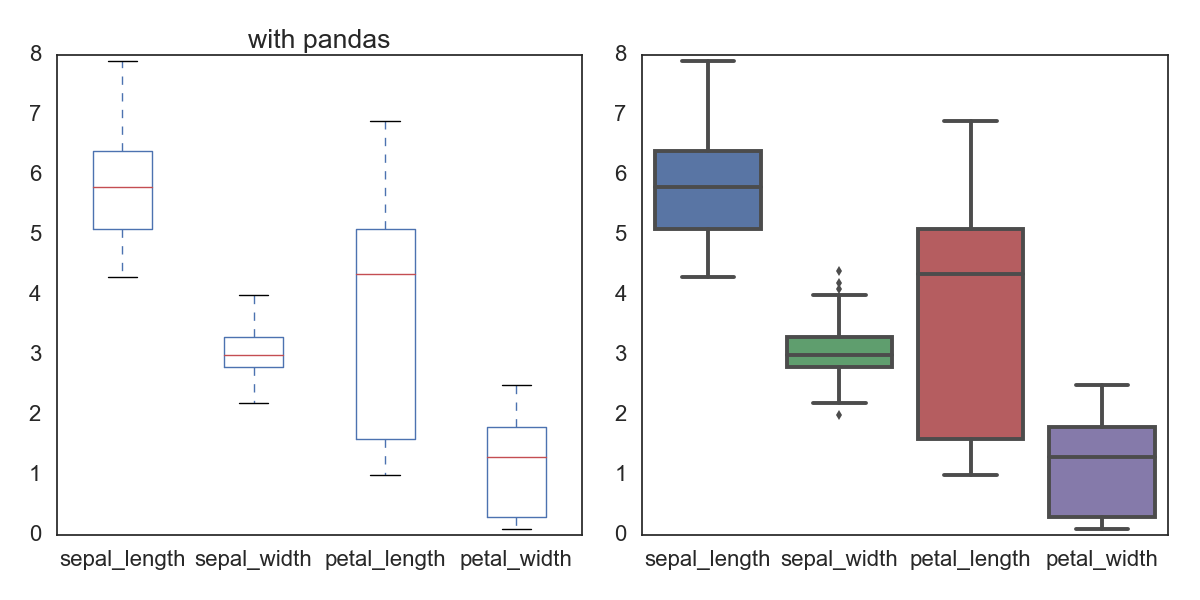
对一个data frame的每一列都画box,非数值的列(比如这里的species)不画;所以此时他们的数值数目可能是一样的。pandas和seaborn都可以直接画。
fig, ax= plt.subplots(1,2,figsize=(12,6))
iris.plot(kind='box', ax=ax[0], title='with pandas')
sns.boxplot(data=iris, ax=ax[1])
plt.tight_layout()
savefn = '/Users/gongjing/Dropbox/blog_codes/images/box_plot.png'
plt.savefig(savefn)
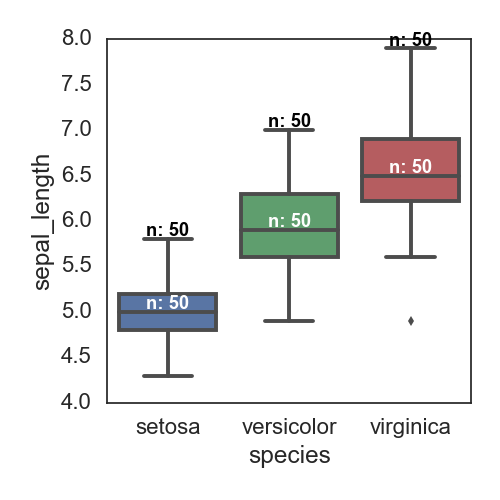
根据species进行分类,画某一列的数值的分布;这个只能是seaborn来画; 添加每个box对应的observation数目 参考这里
fig, ax= plt.subplots(figsize=(5,5))
sns.boxplot(x='species', y='sepal_length', data=iris)

# Calculate number of obs per group & median to position labels
medians = iris.groupby(['species'])['sepal_length'].median().values
maxs = iris.groupby(['species'])['sepal_length'].max().values
means = iris.groupby(['species'])['sepal_length'].mean().values
nobs = iris['species'].value_counts().values
nobs = [str(x) for x in nobs.tolist()]
nobs = ["n: " + i for i in nobs]

# add the number of observations on the top
pos = range(len(nobs))
for tick,label in zip(pos,ax.get_xticklabels()):
    ax.text(pos[tick], medians[tick] + 0.03, nobs[tick],
            horizontalalignment='center', size='x-small', color='w', weight='semibold')

    ax.text(pos[tick], maxs[tick] + 0.03, nobs[tick],
            horizontalalignment='center', size='x-small', color='black', weight='semibold')

plt.tight_layout()
savefn = '/Users/gongjing/Dropbox/blog_codes/images/box_plot2.png'
plt.savefig(savefn)
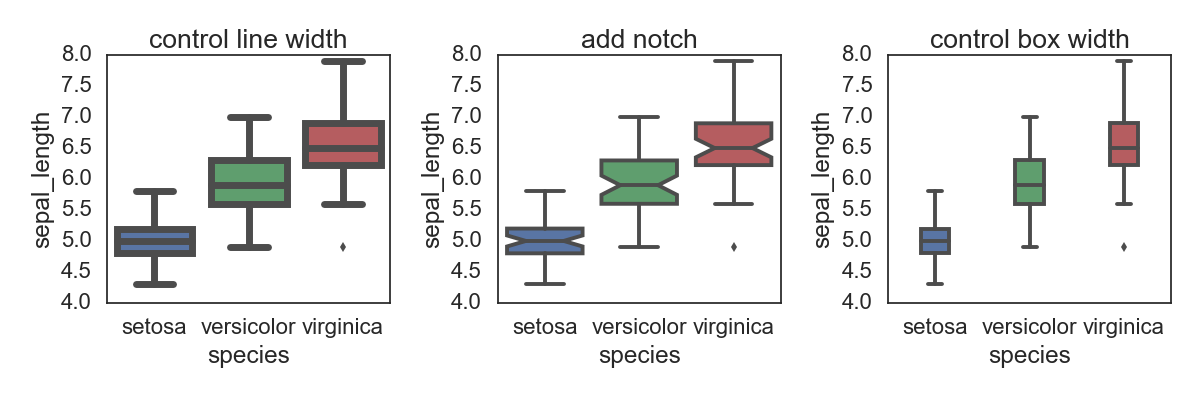
调整box图里面的部分元素:比如下面的line width, type(box or notch),box width
fig, ax = plt.subplots(1, 3, figsize=(12,4))
sns.boxplot( x="species", y="sepal_length", data=iris, linewidth=5, ax=ax[0])
sns.boxplot( x="species", y="sepal_length", data=iris, notch=True, ax=ax[1])
sns.boxplot( x="species", y="sepal_length", data=iris, width=0.3, ax=ax[2])
ax[0].set(title='control line width')
ax[1].set(title='add notch')
ax[2].set(title='control box width')
plt.tight_layout()
savefn = '/Users/gongjing/Dropbox/blog_codes/images/box_plot3.png'
plt.savefig(savefn)
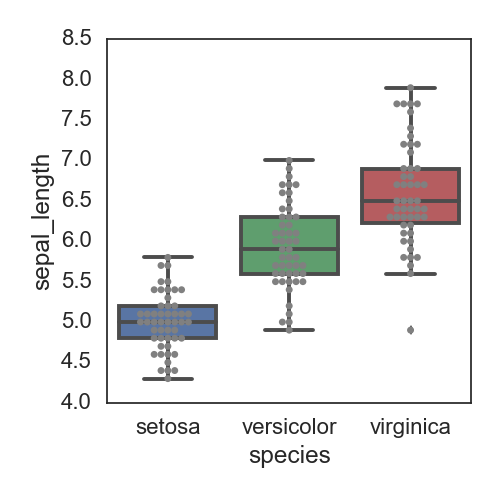
在box中添加具体的点的分布:
fig, ax= plt.subplots(figsize=(5,5))
ax = sns.boxplot(x='species', y='sepal_length', data=iris)
ax = sns.swarmplot(x='species', y='sepal_length', data=iris, color="grey")
plt.tight_layout()
savefn = '/Users/gongjing/Dropbox/blog_codes/images/box_plot4.png'
plt.savefig(savefn)
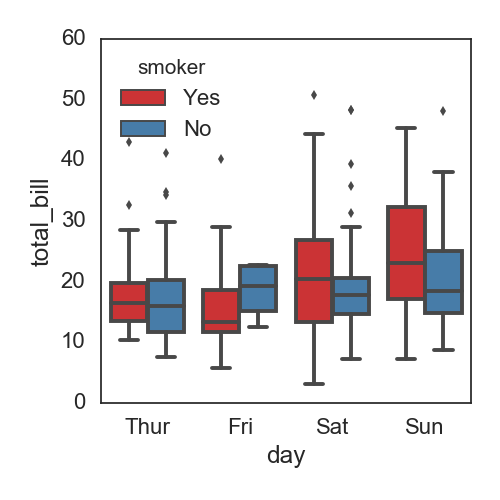
分组并列的box:
df = sns.load_dataset('tips')
print df.head()

 total_bill   tip     sex smoker  day    time  size
0       16.99  1.01  Female     No  Sun  Dinner     2
1       10.34  1.66    Male     No  Sun  Dinner     3
2       21.01  3.50    Male     No  Sun  Dinner     3
3       23.68  3.31    Male     No  Sun  Dinner     2
4       24.59  3.61  Female     No  Sun  Dinner     4

fig, ax= plt.subplots(figsize=(5,5))
sns.boxplot(x="day", y="total_bill", hue="smoker", data=df, palette="Set1")

plt.tight_layout()
savefn = '/Users/gongjing/Dropbox/blog_codes/images/box_plot5.png'
plt.savefig(savefn)
Read full-text »
Latest articles
Links
- ZhangLab , RISE database , THU life , THU info
- Data analysis: pandas , numpy , scipy
- ML/DL: sklearn , sklearn(中文) , pytorch
- Visualization: seaborn , matplotlib , gallery
- Github: me
