计算学习理论
2018-09-17
目录
基础知识
- 计算学习理论:computational learning theory
- 关于通过”计算“来进行学习的理论,即关于机器学习的理论基础
- 目的:分析学习任务的困难本质,为学习算法提供理论保证,指导算法设计
泛化误差与经验误差:
- 样本集:\(D={(x_1,y_1),...,(x_m,y_m)}, x_i\in\chi\)
- 二分类问题:\(y_i\in Y=\{-1,+1\}\)
- 样本:独立同分布采样获得
- h:\(\chi\)到\(Y\)的一个映射,
- 泛化误差:\(E(h:D)=P_{x \sim D}{(h(x)\ne y)}\)
- 经验误差:\(\hat{E}(h;D)=\frac{1}{m}\sum_{i=1}^m\Pi(h(x_i)\ne y_i)\)
- 独立同分布:经验误差的期望等于泛化误差
- 误差参数:\(\epsilon\),预先设定的学得模型所应满足的误差要求
PAC学习
- PAC:Probably Approximately Correct,概率近似正确学习理论
- 概念:concept,用\(c\)表示,是从样本空间到标记空间的映射,决定了一个样本的标记。若对所有样本,满足\(c(x)=y\),则称\(c\)为目标概念。【能在所有的样本上预测正确,当然是想要的模型,这里的c可以理解为一个具体的模型?】
- 概念类:\(C\),希望所学得的目标概念所构成的集合
- 假设空间:\(H\),对于给定的学习算法,它所考虑的所有可能概念(模型)的集合。学习算法不知道概念类的真实存在,所以通常\(H,C\)是不同的。学习算法会把自认为可能的目标概念集组合构成\(H\)。由于不确定某个概念h是否真是目标概念,所以称为假设(hypothesis)。
- 算法可分:若目标概念\(c\in H\),则H中存在假设能将所有样本按照与真实标记一致的方向完全分开
-
算法不可分:若目标概念\(c not in H\),则H中不存在任何假设能将所有样本完全正确分开
- 希望:算法所学得假设模型h尽可能接近目标概念c。
- 不可能完全一致:很多制约因素,采样偶然性等
- 希望以比较大的把握学得比较好的模型
-
概率近似:以较大的概率学得误差满足预设上限的模型
- PAC辨识:PAC identify,对\(0<\epsilon, \delta<1\),所有\(c\in C\)和分布D,若存在学习算法,其输出假设h满足:\(P(E(h)\leq\epsilon)\ge1-\delta\),则学习算法:能从假设空间H中PAC辨识概念类C。【在误差\(\epsilon\)允许的范围内,能以较大的概率,学到概念类的近似】
- PAC可学习:PAC learnable,存在一个算法和多项式函数\(poly(.,.,.,.,)\),使得对于任意的\(m\ge poly(1/\epsilon,1/\delta,size(x),size(c))\),算法能从假设空间H中PAC辨识概念类C,则称概念类C对假设空间H而言是PAC可学习的。
- PAC学习算法:PAC learning algorithm,若学习算法使得概念类C为PAC可学习的,且算法的运行时间也是多项式函数\(poly(1/\epsilon,1/\delta,size(x),size(c))\),则称概念类C是高效PAC可学习的。
-
样本复杂度:sample complexity,满足PAC学习算法所需的\(m\ge poly(1/\epsilon,1/\delta,size(x),size(c))\)中的最小的m,称为学习算法的样本复杂度。
- PAC抽象地刻画了机器学习能力的框架
- 什么样的条件下可学得较好的模型?
- 某算法在什么样的条件下可进行有效的学习?
- 需要多少训练样本才能获得较好的模型?
PAC学习中的H的复杂度
- PCA关键:假设空间H的复杂度
- H包含所有可能输出的假设,若H=C,则是恰PAC学习的
- 通常H、C不相等,一般来说,H越大,包含任意目标概念的可能性越大,找到具体的目标概念难度也越大
- H有限时,称H为有限假设空间
- H无限时,称H为无限假设空间
有限假设空间
可分情形
- 可分:目标概念c属于假设空间H
- 对于数据集D,如何找出满足误差参数的假设?
- 策略:
- D中的样本都是由目标概念c赋予的,则D上错误标记的假设肯定不属于目标概念c
- 可保留与D一致的假设,剔除与D不一致的假设
- 若D足够大,借助D的样本不断剔除不一致的假设,直到H中仅剩下一个,即为目标概念c
需要多少样本?
不可分情形
这里没看懂,先空着吧!
VC维
- 现实问题:通常是无线假设空间
- 实数域的所有区间、\(R^d\)空间中的所有线性超平面
- 度量假设空间的复杂度:
- 常见方案:考虑假设空间的VC维
增长函数:
- growth function
- 给定假设空间H和数据集\({x_1,x_2,...,x_m}\),H中的每个假设h都能对样本进行标记(预测),标记结果是:\(h\|D={h(x_1),h(x_2),...,h(x_m)}\),随着m的增大,H中的所有假设的标记可能结果数目也增大。

- 增长函数:假设空间H对m个样本所能赋予的标记的最大可能结果数。
- 标记的最大可能结果数越多,H的表示能力越强,反应假设空间的复杂度。
对分:
- dichotomy
- m个样本,最多有2^m个可能结果(二分类问题)
- H中的假设对D中样本赋予标记的每种可能结果称为对D的一种”对分“
打散:
- shattering
- 若假设空间H能实现数据集D行的所有对分,即2^m,则称样本集D能被假设空间H打散。
VC维:
- VC(H)=d:表明存在大小为d的样本集能被假设空间H打散,但不是说所有样本集大小为d的样本集都能被打散
- VC的定义与数据分布D无关,只与样本集的大小有关
- 数据分布未知时仍然能够计算样假设空间的VC维
- 计算方法:
- 若存在大小为d的数据集能被H打散,但是不存在任何大小为d+1的样本集被H打散,则H的VC维是d。
- 示例:

- VC维与增长函数有密切关系
- 基于VC维的泛化误差界是分布无关、数据独立的
Rademacher复杂度
- VC维的泛化误差界:分布无关、数据独立,普适性强,但是得到的泛化误差界通常较松
- Rademacher复杂度:Rademancher complexity,另一种刻画假设空间复杂度的途径。一定程度考虑了数据分布。具体参考书籍。
稳定性
参考
- 机器学习周志华第12章
- The VC dimension @林轩田by红色石头
Read full-text »
UpSet plot
2018-09-13
Explore overlapping landscape between multiple data sets
- Interactive set visualization for more than three sets
- R: UpSetR manual
- Python: py-upset manual
- Overlap multiple bed: HOMER_mergePeaks_venn_UpSetR, biostar
UpSetR input file format:
# 每一行代表一个entry,每一列代表所在集合是否出现,1(出现),0(不出现)
$ head all.base.0.1.set.test.txt
NM_212989-2160  0       0       0       0       1
NM_200657-769   0       1       1       1       0
NM_200657-768   1       1       1       1       0
NM_200657-765   0       1       1       0       0
NM_200657-764   0       1       1       0       0
NM_200657-767   1       0       1       1       0
NM_200657-766   0       1       1       1       0
NM_200657-761   1       1       0       1       0
NM_200657-760   0       1       1       1       0
NM_200657-763   0       1       0       0       0
Define parameters and run UpSetR:
library("UpSetR")

t = './all.base.set.txt'
savefn = paste(t, '.pdf', sep='')

df = read.table(t, sep='\t', header=FALSE, row.names=1)
names(df) = c('set1', 'set2', 'set3', 'set4', 'set5')
print(head(df))


pdf(savefn, width=24, height=16)

upset(df, sets=c('set1', 'set2', 'set3', 'set4', 'set5'),
		sets.bar.color = "grey",
		order.by = "degree",
		decreasing = "F",
		empty.intersections = NULL, # on: show empty intersect
		keep.order=TRUE,
		number.angles=0,
		point.size = 8.8,
		line.size = 3,
		scale.intersections="identity",
		mb.ratio = c(0.7, 0.3),
		nintersects=NA,
		text.scale=c(5,5,5,3,5,5),
		show.numbers="no",
		set_size.angles=90
		)
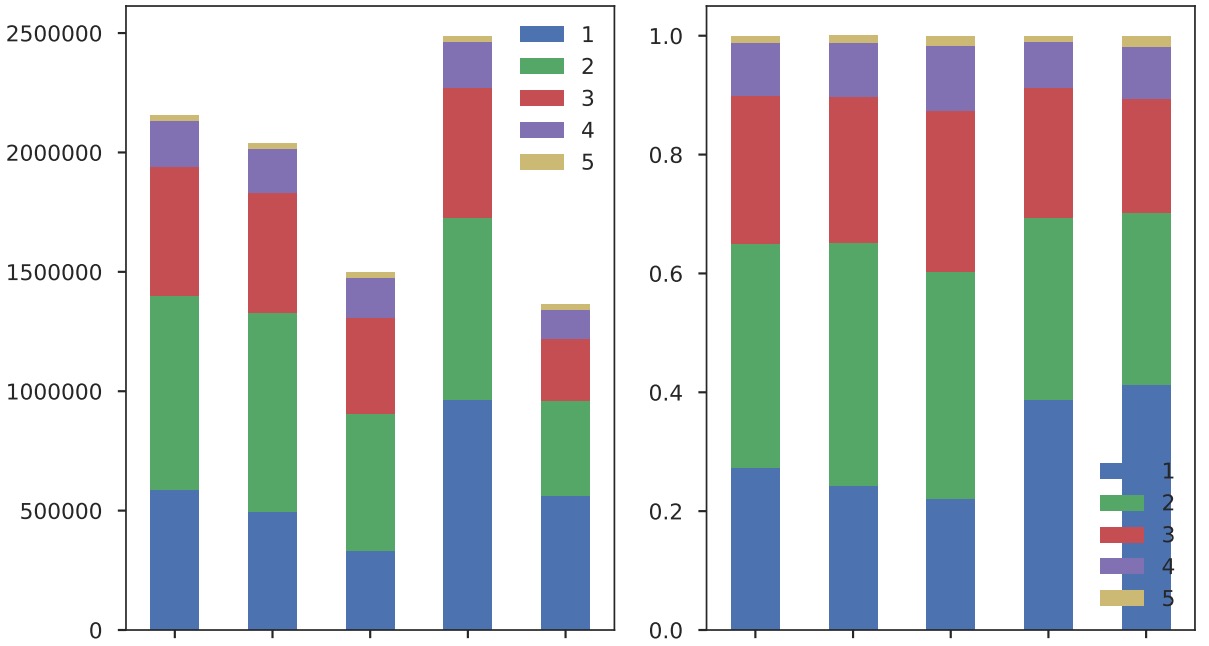
An example output like this:

Display cross-way percentage for each set:
import pandas as pd
from nested_dict import nested_dict
import matplotlib as mpl
mpl.use('Agg')
import matplotlib.pyplot as plt
import seaborn as sns
import matplotlib.colors as mcolors
sns.set(style="ticks")
sns.set_context("poster")

def load_upset_file(txt=None, header_ls=None,):
	if txt is None:
		txt = 'all.base.set.txt'
	if header_ls is None:
		header_ls = ['set1', 'set2', 'set3', 'set4', 'set5']
	set_category_stat_dict = nested_dict(2, int)
	with open(txt, 'r') as TXT:
		for n,line in enumerate(TXT):
			line = line.strip()
			if not line or line.startswith('#'):
				continue
			arr = line.split('\t')
			entry_in = sum(map(int, arr[1:]))
			for i,j in zip(arr[1:], header_ls):
				if int(i) == 1:
					set_category_stat_dict[j][entry_in] += 1
	set_category_stat_df = pd.DataFrame.from_dict(set_category_stat_dict, orient='index')
	set_category_stat_df = set_category_stat_df.loc[header_ls, :]
	print set_category_stat_df

	set_category_stat_df_ratio = set_category_stat_df.div(set_category_stat_df.sum(axis=1), axis=0)
	print set_category_stat_df_ratio

	fig, ax = plt.subplots(1, 2)
	set_category_stat_df.plot(kind='bar', stacked=True, ax=ax[0])
	set_category_stat_df_ratio.plot(kind='bar', stacked=True, ax=ax[1])
	plt.tight_layout()
	savefn = txt.replace('.txt', '.ratio.pdf')
	plt.savefig(savefn)
	plt.close()

def main():
	load_upset_file()

if __name__ == '__main__':
	main()
Read full-text »
Google ML excercises
2018-09-13
- 预热
- 问题构建
- 深入了解机器学习
- 降低损失
- 使用TensorFlow的起始步骤
- 训练集和测试集
- 验证
- 表示法
- 特征组合
- 简化正则化
- 分类
- 稀疏正则化
- 神经网络简介
- 训练神经网络
- 多类别神经网络
- 嵌套
- 静态训练和动态训练
- 静态推理和动态推理
- 数据依赖关系
谷歌机器学习课程对应的练习。
预热
- Hello World: 正常导入TF模块,其提供的notebook都是基于python3的,所以最好安装anaconda3,然后安装对应的tensorflow。
- TensorFlow编程概念:
- 张量(tensors):任意维度的数组。可作为常量或变量存储在图中。
- 标量:零维数组(零阶张量);矢量:一维数组(一阶张量);矩阵:二维数组(二阶张量)
- 指令:创建、销毁和操控张量
- 图(计算图、数据流图):图数据结构,其节点是指令,边是张量。
- 会话
- 1)将常量、变量和指令整合到一个图中;2)在一个会话中评估这些常量、变量和指令。
- 创建和操控张量:
- 矢量加法:类似于python里面的数组(numpy数组),比如元素级加法、元素翻倍等。 函数:
tf.add(x,y) - 广播:元素级运算中的较小数组会增大到与较大数组具有相同的形状。一般数学上只支持形状相同的张量进行元素级的运算,但是TF中借鉴Numpy的广播做法。
twos = tf.constant([2, 2, 2, 2, 2, 2], dtype=tf.int32)
primes_doubled = primes * twos
print("primes_doubled:", primes_doubled)

# 输出值包含值和形状(shape)、类型信息
primes_doubled: tf.Tensor([ 4  6 10 14 22 26], shape=(6,), dtype=int32)
- 矩阵乘法:第一个举证的列数必须等于第二个矩阵的行数。函数:
tf.matmul - 张量变形:矩阵运算限制了矩阵的形状,因此需要频繁变化,可调用
tf.reshape函数,改变形状或者阶数。 - 变量初始化和赋值:如果定义的是变量,需要进行初始化,这个值之后是可以更改(函数:
tf.assign)的。
v = tf.contrib.eager.Variable([3])
print(v)
tf.assign(v, [7])
print(v)

[3]
[7]
模拟投两个骰子10次,10x3的张量,第三列是前两列的和:
random_uniform:随机选取tf.concat:合并张量
die1 = tf.contrib.eager.Variable(
    tf.random_uniform([10, 1], minval=1, maxval=7, dtype=tf.int32))
die2 = tf.contrib.eager.Variable(
    tf.random_uniform([10, 1], minval=1, maxval=7, dtype=tf.int32))

dice_sum = tf.add(die1, die2)
resulting_matrix = (values=[die1, die2, dice_sum], axis=1)

print(resulting_matrix.numpy())

[[5 1 6]
 [4 5 9]
 [1 6 7]
 [2 3 5]
 [1 2 3]
 [5 4 9]
 [3 5 8]
 [3 2 5]
 [3 1 4]
 [6 3 9]]
- Pandas简介:
- DataFrame:数据表格
- Series:单一列
- 利用索引随机化数据
- 重建索引不包含时,会添加新行,并以
NaN填充
cities

City name	Population	Area square miles	Population density
0	San Francisco	852469	46.87	18187.945381
1	San Jose	1015785	176.53	5754.177760
2	Sacramento	485199	97.92	4955.055147

# 随机化index,然后重建索引
cities.reindex(np.random.permutation(cities.index))

# 索引超出范围不报错,新建行
cities.reindex([0, 4, 5, 2])
问题构建
- 【监督式学习】:假设您想开发一种监督式机器学习模型来预测指定的电子邮件是“垃圾邮件”还是“非垃圾邮件”。以下哪些表述正确?
有些标签可能不可靠。未标记为“垃圾邮件”或“非垃圾邮件”的电子邮件是无标签样本。- 我们将使用无标签样本来训练模型。
- 主题标头中的字词适合做标签。
- 【特征和标签】:假设一家在线鞋店希望创建一种监督式机器学习模型,以便为用户提供合乎个人需求的鞋子推荐。也就是说,该模型会向小马推荐某些鞋子,而向小美推荐另外一些鞋子。以下哪些表述正确?
- 鞋的美观程度是一项实用特征。
- 用户喜欢的鞋子是一种实用标签。
“用户点击鞋子描述”是一项实用标签。鞋码是一项实用特征。
深入了解机器学习
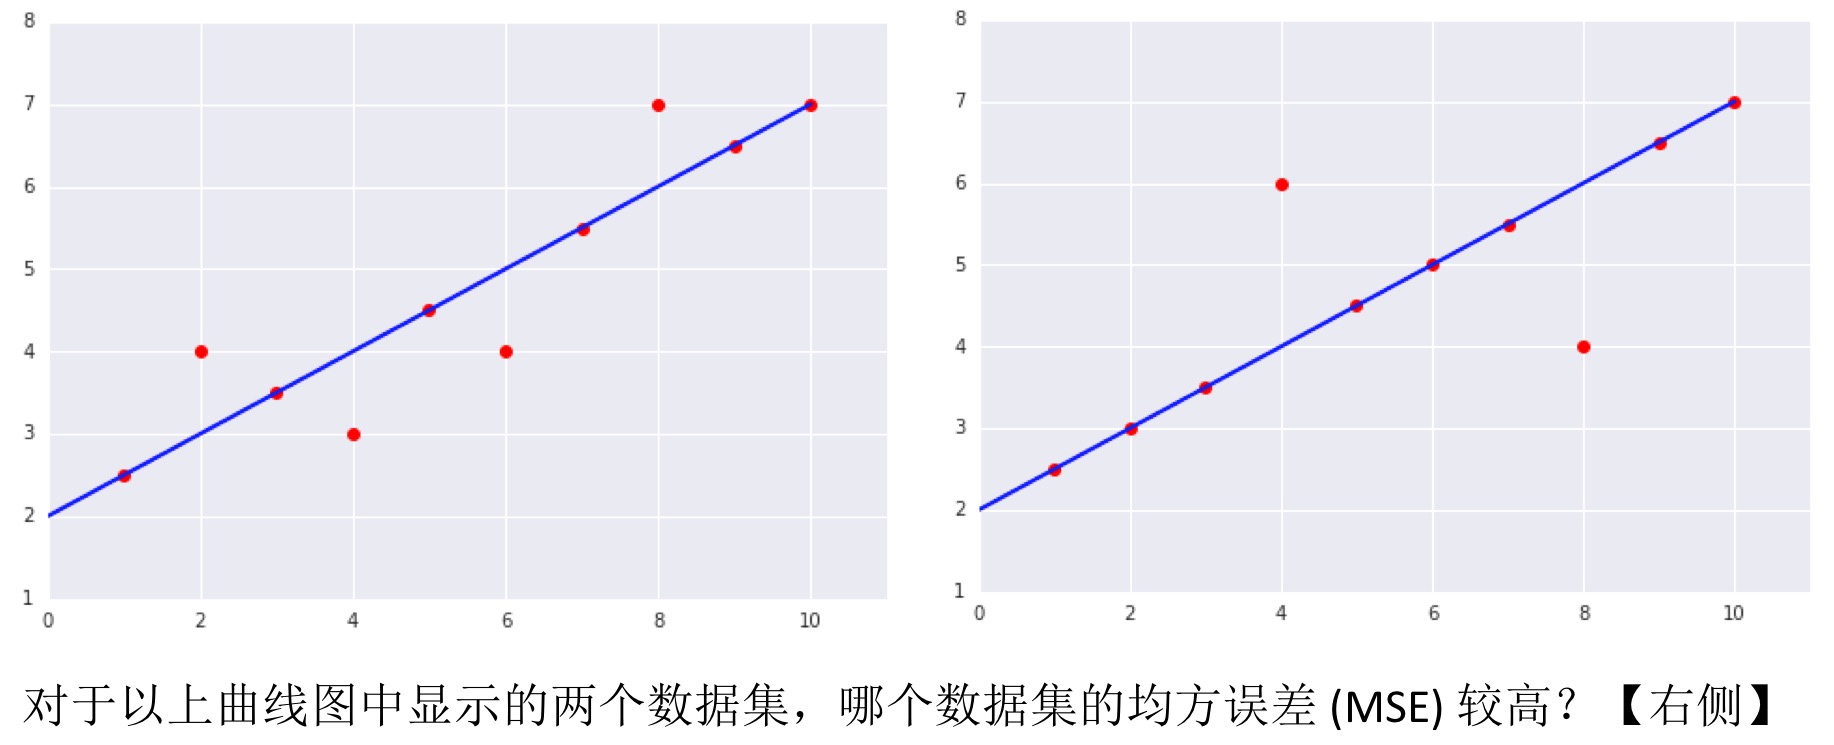
均方误差:
降低损失
- 优化学习速率:
- Learning rate is a hyper-parameter that controls how much we are adjusting the weights of our network with respect the loss gradient(ref). 所以需要不断的更新权重值,看更新后的损失值是否变小,所以横轴是权重,纵轴是损失值。
- 新权重 = 旧权重 — 学习速率 * 梯度
- 在训练模型时,需要最小化损失函数,通常沿着梯度下降的方向。能否找到、多久找到损失函数的最小值,需要进行尝试,一个重要的参数就是学习速率(learning rate)。
学习速率*梯度就是每次更新的数值。 - 这个页面以互动的方式,调节学习速率,看损失函数(二项函数)经过多少步能到达最小损失处。
- 这个图也展示了不同的学习速率可能导致的结果:太小则收敛太慢,太大则很难找到最小值处:

- 【批量大小】:基于大型数据集执行梯度下降法时,以下哪个批量大小可能比较高效?
小批量或甚至包含一个样本的批量 (SGD)。- 全批量。
- 学习速率和收敛: 学习速率越小,收敛所花费的时间越多。在这个练习中,可以尝试不同的学习速率,看能否收敛以及收敛所需的迭代次数。
使用TensorFlow的起始步骤
任务:基于单个输入特征预测各城市街区的房屋价值中位数
# 准备feature和target数据,这里只用一个特征
my_feature = california_housing_dataframe[["total_rooms"]]
feature_columns = [tf.feature_column.numeric_column("total_rooms")]
targets = california_housing_dataframe["median_house_value"]

# 配置训练时的优化器
my_optimizer=tf.train.GradientDescentOptimizer(learning_rate=0.0000001)
my_optimizer = tf.contrib.estimator.clip_gradients_by_norm(my_optimizer, 5.0)

# 配置模型
linear_regressor = tf.estimator.LinearRegressor(
    feature_columns=feature_columns,
    optimizer=my_optimizer
)

def my_input_fn(features, targets, batch_size=1, shuffle=True, num_epochs=None):
    """Trains a linear regression model of one feature.
    """

    features = {key:np.array(value) for key,value in dict(features).items()}

    ds = Dataset.from_tensor_slices((features,targets)) # warning: 2GB limit
    ds = ds.batch(batch_size).repeat(num_epochs)

    if shuffle:
      ds = ds.shuffle(buffer_size=10000)

    # Return the next batch of data.
    features, labels = ds.make_one_shot_iterator().get_next()
    return features, labels

# 训练模型
_ = linear_regressor.train(
    input_fn = lambda:my_input_fn(my_feature, targets),
    steps=100
)

# 评估模型
prediction_input_fn =lambda: my_input_fn(my_feature, targets, num_epochs=1, shuffle=False)
predictions = linear_regressor.predict(input_fn=prediction_input_fn)
predictions = np.array([item['predictions'][0] for item in predictions])

mean_squared_error = metrics.mean_squared_error(predictions, targets)
root_mean_squared_error = math.sqrt(mean_squared_error)
print("Mean Squared Error (on training data): %0.3f" % mean_squared_error)
print("Root Mean Squared Error (on training data): %0.3f" % root_mean_squared_error)

Mean Squared Error (on training data): 56367.025
Root Mean Squared Error (on training data): 237.417
模型效果好吗?通过RMSE(特性:它可以在与原目标相同的规模下解读),直接与原来target的最大最小值,进行比较。在这里,误差跨越了目标范围的一半,所以需要优化模型减小误差。
Min. Median House Value: 14.999
Max. Median House Value: 500.001
Difference between Min. and Max.: 485.002
Root Mean Squared Error: 237.417
问题:有适用于模型调整的标准启发法吗?
- 不同超参数的效果取决于数据,不存在必须遵循的规则,需要自行测试和验证。
- 好的模型应该看到训练误差应该稳步减小(刚开始是急剧减小),最终收敛达到平衡。
- 如果训练误差减小速度过慢,则提高学习速率也许有助于加快其减小速度。
- 如果训练误差变化很大,尝试降低学习速率。
- 较低的学习速率和较大的步数/较大的批量大小通常是不错的组合。
- 批量大小过小也会导致不稳定情况。不妨先尝试 100 或 1000 等较大的值,然后逐渐减小值的大小,直到出现性能降低的情况。
- 合成特征和离群值:
- 比如预测平均房价时把
total_rooms/population作为一个特征,表示的是平均每个人有多少个房间,这个是可取的。 - 识别离群值:
- 1)画target和prediction的散点图,看是否在一条直线上
- 2)画训练所用特征数据的分布图,看是否存在极端值
- 截取离群值:设上下限值,超过的设置为对应的值
clipped_feature = df["feature_name"].apply(lambda x: max(x, 0)),再重新训练,看是否效果变好了。
- 比如预测平均房价时把
训练集和测试集
训练集和测试集:调整训练集和测试集的相对比例,查看模型的效果。不同的数据集需要不同的比例,这个得通过尝试才能确定。
如何确定各data set之间的比例,没有统一的标准,取决于不同的条件 About Train, Validation and Test Sets in Machine Learning:
- 取决于样本数量。
- 取决于所训练的模型。比如参数很多,可能需要很多数据进行验证。
验证
- 检验您的直觉:验证: 我们介绍了使用测试集和训练集来推动模型开发迭代的流程。在每次迭代时,我们都会对训练数据进行训练并评估测试数据,并以基于测试数据的评估结果为指导来选择和更改各种模型超参数,例如学习速率和特征。这种方法是否存在问题?
多次重复执行该流程可能导致我们不知不觉地拟合我们的特定测试集的特性。- 完全没问题。我们对训练数据进行训练,并对单独的预留测试数据进行评估。
- 这种方法的计算效率不高。我们应该只选择一个默认的超参数集,并持续使用以节省资源。
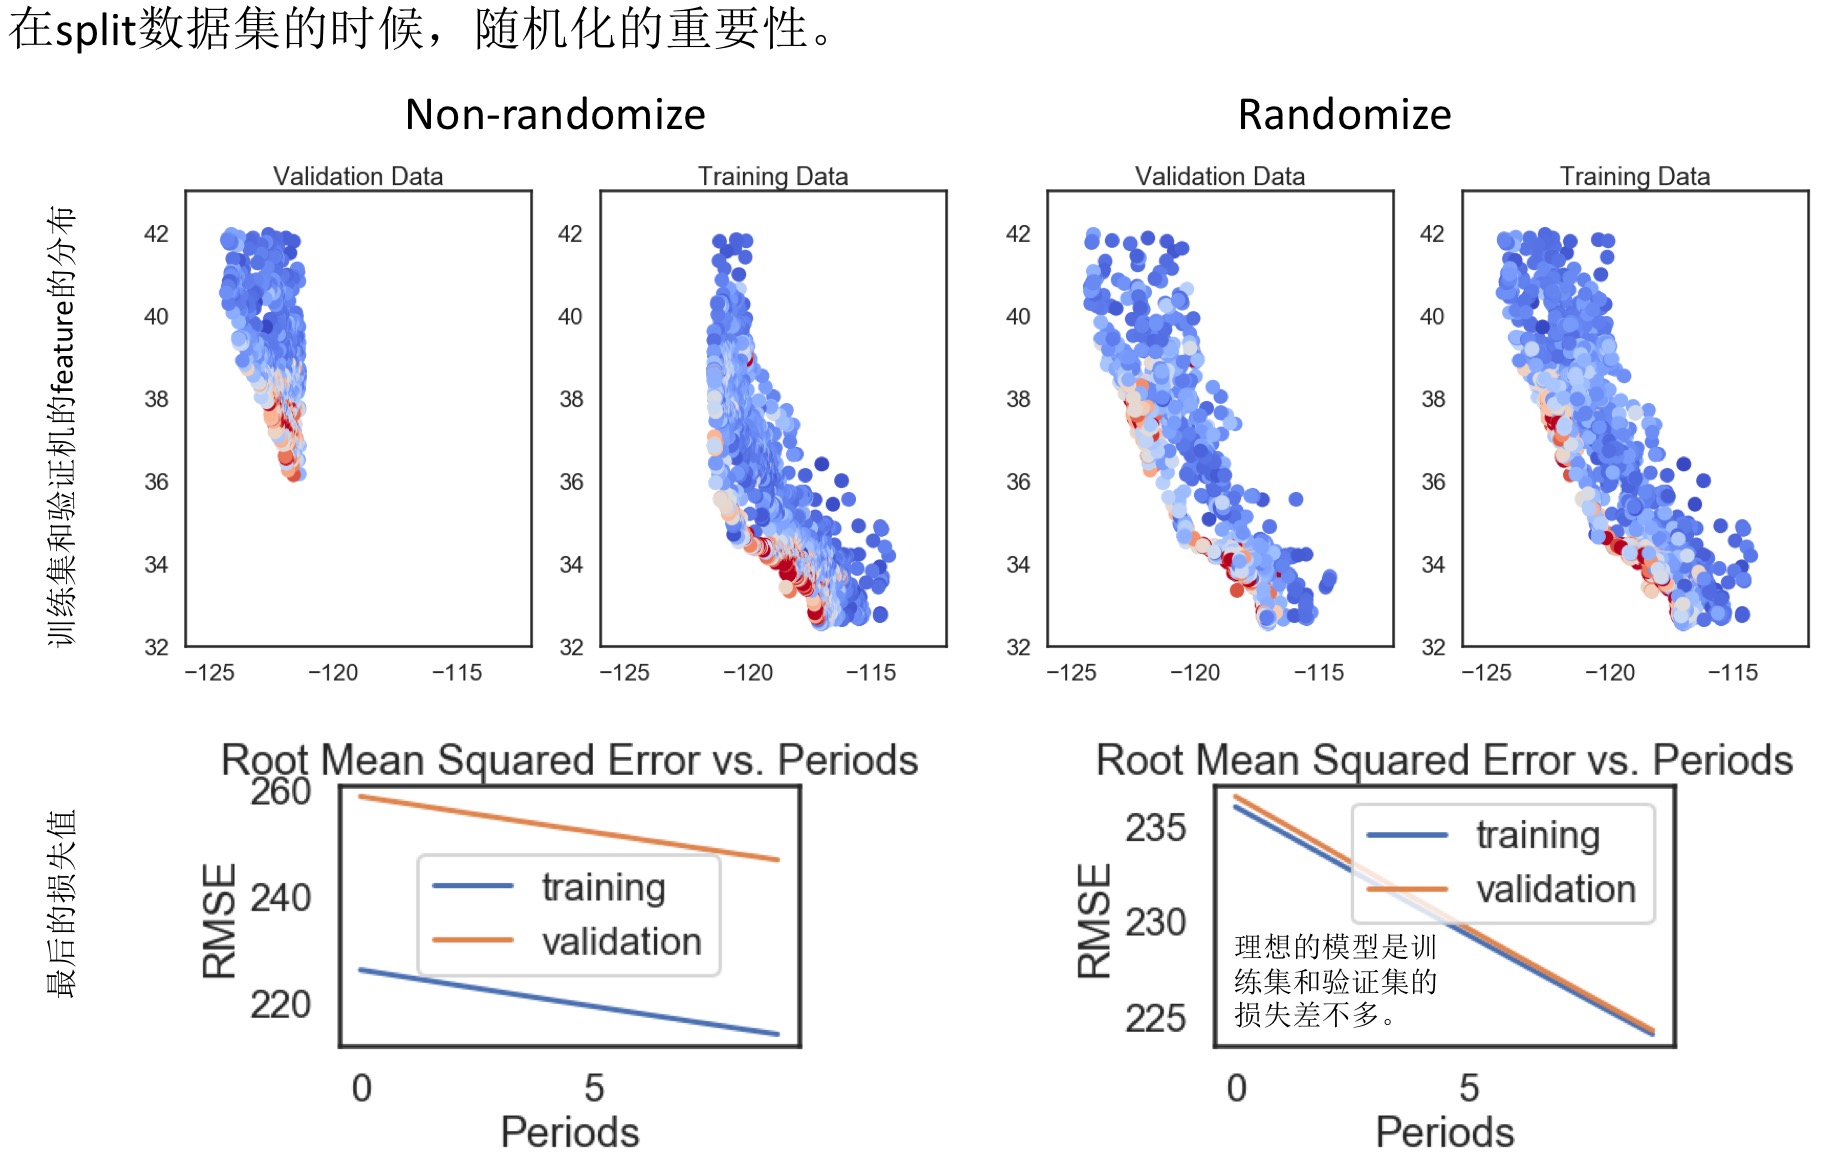
- 拆分验证集:
表示法
- 特征集:
- 相关矩阵(Pearson coefficient):探索不同特征之间的相似性
- 更好的利用纬度信息:直观的纬度与房价没有线性关系,但是有的峰值可能与特定地区有关 =》可以把纬度转换为这些特定地区的相对值。
特征组合
- Feature Crosses练习: 对于线性不可分的问题,有时根据管擦的规律添加新的组合特征,可能解决问题,一个很经典的例子如下:
- Feature Crosses理解:加利福尼亚州不同城市的房价有很大差异。假设您必须创建一个模型来预测房价。以下哪组特征或特征组合可以反映出特定城市中 roomsPerPerson 与房价之间的关系?
- 两个特征组合:[binned latitude X binned roomsPerPerson] 和 [binned longitude X binned roomsPerPerson]
一个特征组合:[binned latitude X binned longitude X binned roomsPerPerson]- 一个特征组合:[latitude X longitude X roomsPerPerson]
- 三个独立的分箱特征:[binned latitude]、[binned longitude]、[binned roomsPerPerson]
- Feature Crosses编程:
- 离散特征的独热编码:即在训练逻辑回归模型之前,离散(即字符串、枚举、整数)特征会转换为二元特征系列。
- 分桶(分箱)特征:函数
bucketized_column,转换为对应的类别编码,然后再进行独热编码(成二元特征系列)。 - 特征组合及分桶处理特征有时能大幅度提升模型的效果。
- 特征分桶函数:
bucketized_longitude = tf.feature_column.bucketized_column( longitude, boundaries=get_quantile_based_boundaries( training_examples["longitude"], 10)) - 特征组合函数:
long_x_lat = tf.feature_column.crossed_column(
  set([bucketized_longitude, bucketized_latitude]), hash_bucket_size=1000)
简化正则化
- 简化正则化练习:对于某些问题,可能因为使用过多的特征或者特征组合,使得模型训练很好,但是泛化能力很低。通常模型的过拟合包含多方面的原因,比如:1)模型太复杂;2)数据量太少;3)使用的特征太多。
- 简化正则化理解:
- 【L2正则化】:假设某个线性模型具有100个输入特征,其中10个特征信息丰富,另外90个特征信息比较缺乏,假设所有特征的值均介于 -1 和 1 之间。 以下哪些陈述属实?
L2 正则化可能会导致对于某些信息缺乏的特征,模型会学到适中的权重。L2 正则化会使很多信息缺乏的权重接近于(但并非正好是)0.0。- L2 正则化会使大多数信息缺乏的权重正好为 0.0。
- 【L2 正则化和相关特征】:假设某个线性模型具有两个密切相关的特征;也就是说,这两个特征几乎是彼此的副本,但其中一个特征包含少量的随机噪点。如果我们使用 L2 正则化训练该模型,这两个特征的权重将出现什么情况?
- 其中一个特征的权重较大,另一个特征的权重几乎为 0.0。
- 其中一个特征的权重较大,另一个特征的权重正好为 0.0。
这两个特征将拥有几乎相同的适中权重。
- 【L2正则化】:假设某个线性模型具有100个输入特征,其中10个特征信息丰富,另外90个特征信息比较缺乏,假设所有特征的值均介于 -1 和 1 之间。 以下哪些陈述属实?
分类
- 【准确率】:在以下哪种情况下,高的准确率值表示机器学习模型表现出色?
在 roulette 游戏中,一只球会落在旋转轮上,并且最终落入 38 个槽的其中一个内。某个机器学习模型可以使用视觉特征(球的旋转方式、球落下时旋转轮所在的位置、球在旋转轮上方的高度)预测球会落入哪个槽中,准确率为 4%。- 一种致命但可治愈的疾病影响着 0.01% 的人群。某个机器学习模型使用其症状作为特征,预测这种疾病的准确率为 99.99%。
- 一只造价昂贵的机器鸡每天要穿过一条交通繁忙的道路一千次。某个机器学习模型评估交通模式,预测这只鸡何时可以安全穿过街道,准确率为 99.99%。
- 【精确率】:让我们以一种将电子邮件分为“垃圾邮件”或“非垃圾邮件”这两种类别的分类模型为例。如果提高分类阈值,精确率会怎样?
可能会提高。- 一定会提高。
- 可能会降低。
- 一定会降低。
- 【召回率】让我们以一种将电子邮件分为“垃圾邮件”或“非垃圾邮件”这两种类别的分类模型为例。如果提高分类阈值,召回率会怎样?
始终下降或保持不变。- 始终保持不变。
- 一定会提高。
- 【精确率和召回率】以两个模型(A 和 B)为例,这两个模型分别对同一数据集进行评估。 以下哪一项陈述属实?
- 如果模型 A 的精确率优于模型 B,则模型 A 更好。
- 如果模型 A 的召回率优于模型 B,则模型 A 更好。
如果模型 A 的精确率和召回率均优于模型 B,则模型 A 可能更好。
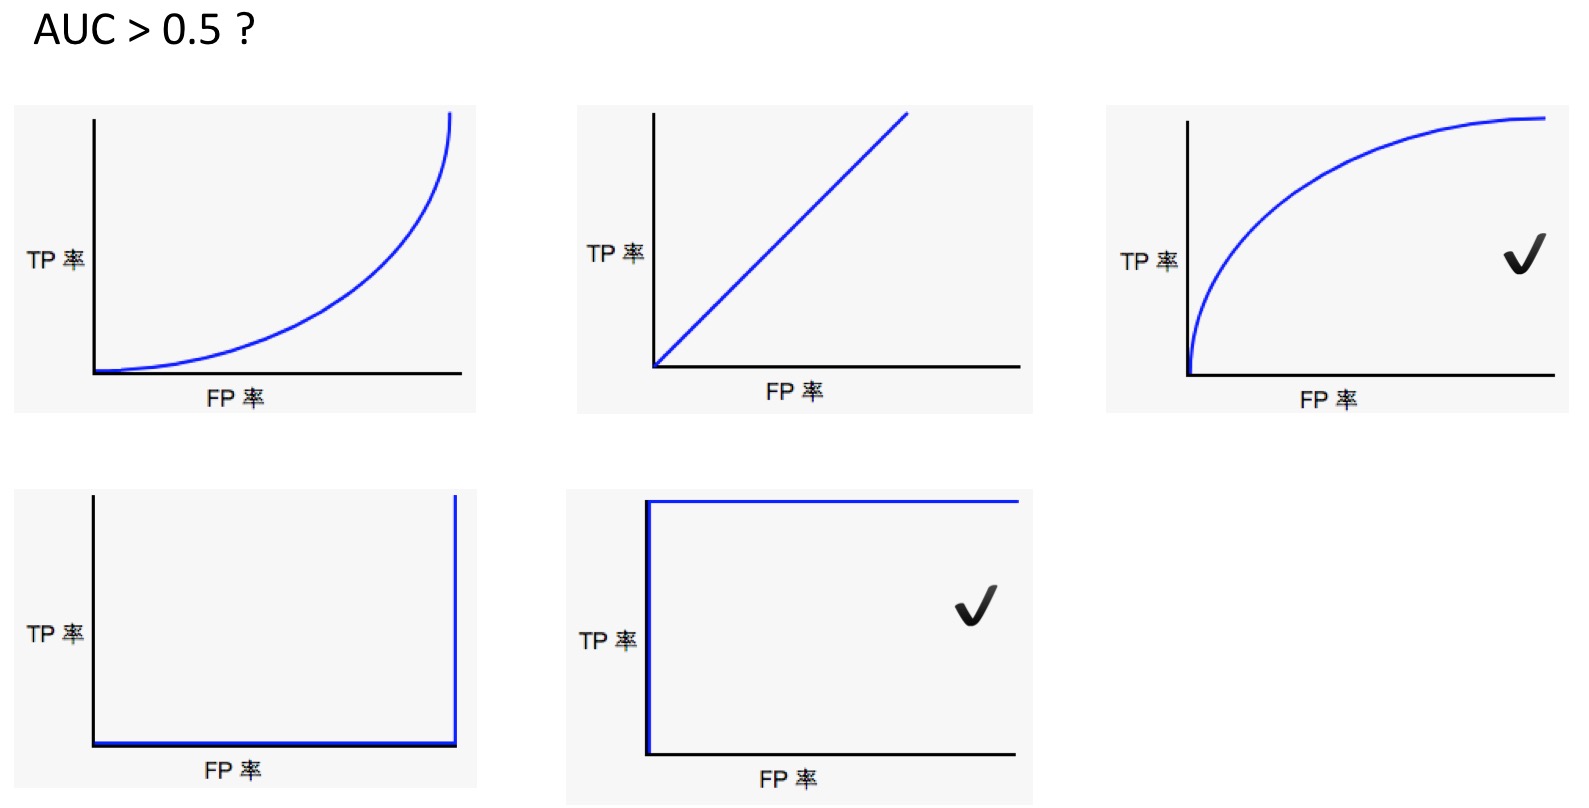
- 理解ROC和AUC:
- 【ROC和AUC】:以下哪条 ROC 曲线可产生大于 0.5 的 AUC 值?
- 【AUC 和预测结果的尺度】:将给定模型的所有预测结果都乘以 2.0(例如,如果模型预测的结果为 0.4,我们将其乘以 2.0 得到 0.8),会使按 AUC 衡量的模型效果产生何种变化?
- 这会使 AUC 变得很糟糕,因为预测值现在相差太大。
- 这会使 AUC 变得更好,因为预测值之间相差都很大。
没有变化。AUC 只关注相对预测分数。
稀疏正则化
【L1正则化】:假设某个线性模型具有100个输入特征,其中10个特征信息丰富,另外90个特征信息比较缺乏。假设所有特征的值均介于-1和1之间。以下哪些陈述属实?
L1 正则化可能会使信息丰富的特征的权重正好为 0.0。- L1 正则化会使很多信息缺乏的权重接近于(但并非正好是)0.0。
L1 正则化会使大多数信息缺乏的权重正好为 0.0。
【L1和L2正则化】:假设某个线性模型具有 100 个输入特征,这些特征的值均介于-1到1之间,其中10个特征信息丰富,另外90个特征信息比较缺乏。哪种类型的正则化会产生较小的模型?
L1 正则化。- L2 正则化。
- 编程练习:
- 将房屋价格的预测变换为一个分类问题:预测房价是否过高
- 对于房价,取75%阈值,最高的75%认为是过高的(可设为1),其他的是不过高的(可设为0)
- 比较线性模型和逻辑回归模型用于房屋。注意这里两者的损失函数是不同的,不能直接比较所画的损失函数曲线的纵轴,可以在线性模型中计算对数损失,从而比较两个模型。
- 一般提高模型的效果,可以训练更长的时间,可以增加步数和/或批量大小。
- 在调整参数优化模型的时候,最好在集群上调试。对于此练习的最后一个优化,在iMAC上跑挂了,电脑差点不能正常启动。
神经网络简介
-
神经网络:在线性很难区分的数据集上,测试不同的神经网络结构(隐藏层、权重、激活函数等),查看效果。
-
构建神经网络: 函数
hidden_units,例子hidden_units=[3, 10]表示指定了连个隐藏层,第一个隐藏层含有3个节点,第二个隐藏层含有10个节点,默认为全连接且使用ReLU激活函数。 -
编程联系:时间问题,神经网络的训练需要大量的时间和运算,所以最好在集群上进行,不要在本地电脑上。
  # Create a DNNRegressor object.
  my_optimizer = tf.train.GradientDescentOptimizer(learning_rate=learning_rate)
  my_optimizer = tf.contrib.estimator.clip_gradients_by_norm(my_optimizer, 5.0)
  dnn_regressor = tf.estimator.DNNRegressor(
      feature_columns=construct_feature_columns(training_examples),
      hidden_units=hidden_units,
      optimizer=my_optimizer
  )

  # Create input functions.
  training_input_fn = lambda: my_input_fn(training_examples,
                                          training_targets["median_house_value"],
                                          batch_size=batch_size)
  predict_training_input_fn = lambda: my_input_fn(training_examples,
                                                  training_targets["median_house_value"],
                                                  num_epochs=1,
                                                  shuffle=False)
  predict_validation_input_fn = lambda: my_input_fn(validation_examples,
                                                    validation_targets["median_house_value"],
                                                    num_epochs=1,
                                                    shuffle=False)
训练神经网络
- 线性缩放:将输入缩放到(-1, 1)之间,SGD在不同维度中改变步长不受阻。
def linear_scale(series):
  min_val = series.min()
  max_val = series.max()
  scale = (max_val - min_val) / 2.0
  return series.apply(lambda x:((x - min_val) / scale) - 1.0)
- 尝试不同的优化器:Adam适合非凸优化问题,AdaGrad适合凸优化问题。
- 尝试其他的标准化方法:
def log_normalize(series):
  return series.apply(lambda x:math.log(x+1.0))

def clip(series, clip_to_min, clip_to_max):
  return series.apply(lambda x:(
    min(max(x, clip_to_min), clip_to_max)))

def z_score_normalize(series):
  mean = series.mean()
  std_dv = series.std()
  return series.apply(lambda x:(x - mean) / std_dv)

def binary_threshold(series, threshold):
  return series.apply(lambda x:(1 if x > threshold else 0))
- 仅适用部分特征,这里也涉及到特征挑选?对于模型效果的提升能有多大的作用?
多类别神经网络
- 训练线性模型和神经网络,对MNIST数据集的手写数字进行分类
- 比较线性分类模型和神经网络模型的效果
- 可视化神经网络隐藏层的权重
嵌套
- 将影评字符串数据转换为稀疏特征矢量
- 使用稀疏特征矢量实现情感分析线性模型
- 通过将数据投射到二维空间的嵌入来实现情感分析 DNN 模型
- 将嵌入可视化,以便查看模型学到的词语之间的关系
静态训练和动态训练
【在线训练】:以下哪个关于在线(动态)训练的表述是正确的?
- 几乎不需要对训练作业进行监控。
- 在推理时几乎不需要监控输入数据。
模型会在新数据出现时进行更新。
【离线训练】:以下哪些关于离线训练的表述是正确的?
- 模型会在收到新数据时进行更新。
与在线训练相比,离线训练需要对训练作业进行的监控较少。- 在推理时几乎不需要监控输入数据。
您可以先验证模型,然后再将其应用到生产中。
静态推理和动态推理
【在线推理】:在线推理指的是根据需要作出预测。也就是说,进行在线推理时,我们将训练后的模型放到服务器上,并根据需要发出推理请求。以下哪些关于在线推理的表述是正确的?
您可以为所有可能的条目提供预测。- 在进行在线推理时,您不需要像执行离线推理一样,过多地担心预测延迟问题(返回预测的延迟时间)。
您必须小心监控输入信号。- 您可以先对预测进行后期验证,然后再使用它们。
【离线推理】:在离线推理中,我们会一次性根据大批量数据做出预测。然后将这些预测纳入查询表中,以供以后使用。以下哪些关于离线推理的表述是正确的?
对于给定的输入,离线推理能够比在线推理更快地提供预测。生成预测之后,我们可以先对预测进行验证,然后再应用。- 我们会对所有可能的输入提供预测。
- 我们将需要在长时间内小心监控输入信号。
- 我们将能够快速对世界上的变化作出响应。
数据依赖关系
Data Dependencies理解:以下哪个模型容易受到反馈环的影响?
大学排名模型 - 将选择率(即申请某所学校并被录取的学生所占百分比)作为一项学校评分依据。图书推荐模型 - 根据小说的受欢迎程度(即图书的购买量)向用户推荐其可能喜欢的小说。交通状况预测模型 - 使用海滩上的人群规模作为特征之一预测海滩附近各个高速公路出口的拥堵情况。- 选举结果预测模型 - 在投票结束后对 2% 的投票者进行问卷调查,以预测市长竞选的获胜者。
- 住宅价值预测模型 - 使用建筑面积(以平方米为单位计算的面积)、卧室数量和地理位置作为特征预测房价。
- 人脸检测模型:检测照片中的人是否在微笑(根据每月自动更新的照片数据库定期进行训练)。
Read full-text »
特征提取
2018-09-10
目录
1. sklearn特征提取
- 模块
sklearn.feature_extraction:提取符合机器学习算法的特征,比如文本和图片 - 特征提取(extraction)vs 特征选择(selection):前者将任意数据转换为机器学习可用的数值特征,后者应用这些特征到机器学习中。
2. 从字典类型数据加载特征
- 类
DictVectorizer可处理字典元素,将字典中的数组转换为模型可用的数组 - 字典:使用方便、稀疏
- 实现
one-of-K、one-hot编码,用于分类特征
>>> measurements = [
...     {'city': 'Dubai', 'temperature': 33.},
...     {'city': 'London', 'temperature': 12.},
...     {'city': 'San Francisco', 'temperature': 18.},
... ]

>>> from sklearn.feature_extraction import DictVectorizer
>>> vec = DictVectorizer()

# 直接应用于字典,将分类的进行独热编码,数值型的保留
>>> vec.fit_transform(measurements).toarray()
array([[  1.,   0.,   0.,  33.],
 [  0.,   1.,   0.,  12.],
 [  0.,   0.,   1.,  18.]])

>>> vec.get_feature_names()
['city=Dubai', 'city=London', 'city=San Francisco', 'temperature']
3. 特征哈希:相当于一种降维
- 类:
FeatureHasher - 高速、低内存消耗的向量化方法
- 使用特征散列(散列法)技术
- 接受映射
- 可在文档分类中使用
-
目标:把原始的高维特征向量压缩成较低维特征向量,且尽量不损失原始特征的表达能力
-
哈希表:有一个哈希函数,实现键值的映射,哈希把不同的键散列到不同的块,但还是存在冲突,即把不同的键散列映射到相同的值。
- 下面两篇文章介绍了特征哈希在文本上的使用,但是还没没有完全看明白!!!
- 数据特征处理之特征哈希(Feature Hashing)
- 文本挖掘预处理之向量化与Hash Trick
# 使用词袋模型
from sklearn.feature_extraction.text import CountVectorizer
vectorizer=CountVectorizer()
corpus=["I come to China to travel",
    "This is a car polupar in China",
    "I love tea and Apple ",
    "The work is to write some papers in science"]
print vectorizer.fit_transform(corpus)
print vectorizer.fit_transform(corpus).toarray()
print vectorizer.get_feature_names()
(0, 16)	1
  (0, 3)	1
  (0, 15)	2
  (0, 4)	1
  (1, 5)	1
  (1, 9)	1
  (1, 2)	1
  (1, 6)	1
  (1, 14)	1
  (1, 3)	1
  (2, 1)	1
  (2, 0)	1
  (2, 12)	1
  (2, 7)	1
  (3, 10)	1
  (3, 8)	1
  (3, 11)	1
  (3, 18)	1
  (3, 17)	1
  (3, 13)	1
  (3, 5)	1
  (3, 6)	1
  (3, 15)	1
[[0 0 0 1 1 0 0 0 0 0 0 0 0 0 0 2 1 0 0]
 [0 0 1 1 0 1 1 0 0 1 0 0 0 0 1 0 0 0 0]
 [1 1 0 0 0 0 0 1 0 0 0 0 1 0 0 0 0 0 0]
 [0 0 0 0 0 1 1 0 1 0 1 1 0 1 0 1 0 1 1]]
[u'and', u'apple', u'car', u'china', u'come', u'in', u'is', u'love', u'papers', u'polupar', u'science', u'some', u'tea', u'the', u'this', u'to', u'travel', u'work', u'write']
# 使用hash技巧,将原来的19维降至6维
from sklearn.feature_extraction.text import HashingVectorizer
vectorizer2=HashingVectorizer(n_features = 6,norm = None)
print vectorizer2.fit_transform(corpus)
print vectorizer2.fit_transform(corpus).toarray()
  (0, 1)	2.0
  (0, 2)	-1.0
  (0, 4)	1.0
  (0, 5)	-1.0
  (1, 0)	1.0
  (1, 1)	1.0
  (1, 2)	-1.0
  (1, 5)	-1.0
  (2, 0)	2.0
  (2, 5)	-2.0
  (3, 0)	0.0
  (3, 1)	4.0
  (3, 2)	-1.0
  (3, 3)	1.0
  (3, 5)	-1.0
[[ 0.  2. -1.  0.  1. -1.]
 [ 1.  1. -1.  0.  0. -1.]
 [ 2.  0.  0.  0.  0. -2.]
 [ 0.  4. -1.  1.  0. -1.]]
4. 文本特征提取:话语表示
- 文本提取特征常见方法(词袋模型bag-of-words,BoW):
- 令牌化(tokenizing):分出可能的单词赋予整数id
- 统计(counting):每个词令牌在文档中的出现次数
- 标准化(normalizing):赋予权重
- 特征:每个单独的令牌发生频率
- 样本:每个文档的所有令牌频率向量
- 向量化:将文本文档集合转换为数字集合特征向量
- 词集模型:只考虑单词出现与否,不考虑频率
- 稀疏:得到的文本矩阵很多特征值为0,通常大于99%
- 类:
CountVectorizer,词切分+频数统计,用法参见上面的例子,同时注意文本文件的编码方式,一般是utf-8编码,如果是其他编码,需要通过参数encoding进行指定。
5. Tf-idf项加权
- 有的词出现很多次,其实无用,比如the,is,a
- 重新计算特征权重:tf-idf变换
- Tf:term frequency,术语频率;
- idf:inverse document frequency,转制文档频率
-
公式:\(tf-idf(t,d) = tf(t,d) \times idf(t)\)
- 类:
TfidfTransformer - 类:
TfidfVectorizer,组合CountVectorizer+TfidfTransformer
>>> from sklearn.feature_extraction.text import TfidfTransformer
>>> transformer = TfidfTransformer(smooth_idf=False)
>>> transformer
TfidfTransformer(norm=...'l2', smooth_idf=False, sublinear_tf=False,
 use_idf=True)

# 直观分析count
# 第一个词在所有文档都出现,可能不重要
# 另外两个词,出现不到50%,可能具有代表性
>>> counts = [[3, 0, 1],
...           [2, 0, 0],
...           [3, 0, 0],
...           [4, 0, 0],
...           [3, 2, 0],
...           [3, 0, 2]]
...
>>> tfidf = transformer.fit_transform(counts)
>>> tfidf
<6x3 sparse matrix of type '<... 'numpy.float64'>'
    with 9 stored elements in Compressed Sparse ... format>

>>> tfidf.toarray()
array([[0.81940995, 0.        , 0.57320793],
       [1.        , 0.        , 0.        ],
       [1.        , 0.        , 0.        ],
       [1.        , 0.        , 0.        ],
       [0.47330339, 0.88089948, 0.        ],
       [0.58149261, 0.        , 0.81355169]])


# TfidfVectorizer
>>> from sklearn.feature_extraction.text import TfidfVectorizer
>>> vectorizer = TfidfVectorizer()
>>> vectorizer.fit_transform(corpus)
...
<4x9 sparse matrix of type '<... 'numpy.float64'>'
 with 19 stored elements in Compressed Sparse ... format>
6. 应用实例
7. n-gram表示
- 词语表示限制:无法捕获短语或多词表达,忽略单词顺序依赖,单词拼写错误
- 构建n-gram集合,不是简单的uni-gram集合
下面的例子中,单词words和wprds想表达相同意思,只是拼写错误,通过2-gram分析可以把他们的相同特征提取到:
>>> ngram_vectorizer = CountVectorizer(analyzer='char_wb', ngram_range=(2, 2))
>>> counts = ngram_vectorizer.fit_transform(['words', 'wprds'])
>>> ngram_vectorizer.get_feature_names() == (
...     [' w', 'ds', 'or', 'pr', 'rd', 's ', 'wo', 'wp'])
True
>>> counts.toarray().astype(int)
array([[1, 1, 1, 0, 1, 1, 1, 0],
 [1, 1, 0, 1, 1, 1, 0, 1]])
- 类
CountVectorizer参数analyzer指定 analyzer='char_wb':只能是每个单词内的-
analyzer='char':可以跨单词创建n-gram - 缺点:破坏文档的内部结构(含义)
8. 图像特征提取
- 函数:
extract_patches_2d,从图像二维数组或沿第三轴颜色信息提取patch - 函数:
reconstruct_from_patches_2d,从所有patch重建图像
>>> import numpy as np
>>> from sklearn.feature_extraction import image

>>> one_image = np.arange(4 * 4 * 3).reshape((4, 4, 3))
>>> one_image[:, :, 0]  # R channel of a fake RGB picture
array([[ 0,  3,  6,  9],
 [12, 15, 18, 21],
 [24, 27, 30, 33],
 [36, 39, 42, 45]])

>>> patches = image.extract_patches_2d(one_image, (2, 2), max_patches=2,
...     random_state=0)
>>> patches.shape
(2, 2, 2, 3)
>>> patches[:, :, :, 0]
array([[[ 0,  3],
 [12, 15]],

 [[15, 18],
 [27, 30]]])
>>> patches = image.extract_patches_2d(one_image, (2, 2))
>>> patches.shape
(9, 2, 2, 3)
>>> patches[4, :, :, 0]
array([[15, 18],
 [27, 30]])
参考
Read full-text »
利用SVD简化数据
2018-09-08
概述
- 奇异值分解(singular value decomposition,SVD):
- 提取信息的强大工具,将数据映射到低维空间,以小得多的数据表示原始数据(去除噪声和冗余)。
- 属于矩阵分解的一种,将数据矩阵分解成多个独立部分的过程。
- SVD奇异值分解及其意义这篇文章详细解释了SVD的意义及几个应用例子的直观展示,可以参考一下。
- 应用:
- 信息检索:隐性语义索引(latent semantic indexing,LSI)或者隐性语义分析(latent semantic analysis,LSA)。文档矩阵包含文档和词语,应用SVD,可构建多个奇异值,这些奇异值就代表了文档的主题概念,有助于更高效的文档搜索。
- 推荐系统:简单版本是直接计算用户之间的相似性,应用SVD可先构建主题空间,然后计算在该空间下的相似度。
- 电影推荐:协同过滤等
- 矩阵分解:
- 原始矩阵分解成多个矩阵的乘积,新的矩阵是易于处理的形式
- 类似于因子分解,比如12分解成两个数的乘积,有多种可能:(1,12),(2,6),(3,4)
- 多种方式,不同分解技术有不同的性质,适合不同场景
- 常见的是SVD
- SVD:
- 将原始数据矩阵\(Data\)分解成三个矩阵:\(U\),\(\sum\),\(V^T\)
- \(Data\):m x n,\(U\):m x m,\(\sum\):m x n,\(V^T\):n x n
- 分解过程:\(Data_{m \times n} = U_{m \times m}\sum_{m \times n}V_{n \times n}^T\)
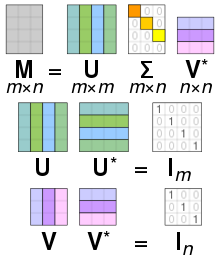
- 矩阵\(\sum\):只有对角元素,其他元素为0,且按照惯例对角元素是从大到小排列的。对角元素称为奇异值(singular value),对应原始数据矩阵\(Data\)的奇异值。
- PCA:矩阵的特征值,表征数据集的重要特征。奇异值和特征值存在关系:奇异值=\(Data * Data^T特征值的平方根\)。
- 矩阵\(\sum\)事实:在某个奇异值的数目(r个)之后,其他的奇异值都很小或者置为0.这表示数据集中仅有r个重要特征,其余特征是噪声或者冗余的特征。
- 如何确定需要保留的奇异值的个数?
- 策略1:保留矩阵中90%的能量信息。能量可以是所有奇异值的平方和,将奇异值的平方和累加到90%即可。
- 策略2:当有上万的奇异值时,保留前2000或3000个。
- 协同过滤:
- Amazon根据顾客的购买历史推荐物品
- Netflix向用户推荐电影
- 新闻网站对用户推荐新闻报道
- 通过将用户和其他用户的数据进行对比来实现推荐
- 相似度计算:
- 比如计算手撕猪肉和烤牛肉之间的相似性,可以根据自身不同的属性。但是不同的人看法不一样。
-
基于用户的意见来计算相似度 =》协同过滤:不关心物品的描述属性,严格按照许多用户的观点计算相似性。
- 欧式距离:距离为0,则相似度为1
- 皮尔逊相关系数(pearson correlation):度量向量之间的相似度,对用户评价的量级不敏感(这是优于欧式距离的一点)
- 余弦相似度(cosine similarity):计算两个向量夹角的余弦值。夹角为9度,则相似度为0;方向相同,则相似度为1.
def ecludSim(inA,inB): return 1.0/(1.0 + la.norm(inA - inB)) def pearsSim(inA,inB): if len(inA) < 3 : return 1.0 return 0.5+0.5*corrcoef(inA, inB, rowvar = 0)[0][1] def cosSim(inA,inB): num = float(inA.T*inB) denom = la.norm(inA)*la.norm(inB) return 0.5+0.5*(num/denom) - 基于物品 vs 基于用户相似度?
- 基于用户(user-based):行与行的比较
- 基于物品(item-based):列与列的比较
- 选择哪个取决于用户或物品的数目。计算时间均会随着对应数量的增加而增加。
- 用户数目很多,倾向于使用基于物品相似度的计算。(大部分的产品都是用户数目多于物品数量)
- 推荐引擎的评价:
- 没有预测的目标值,没有用户调查的满意程度
- 方法:交叉测试,将某些已知的评分值去掉,对这些进行预测,计算预测和真实值之间的差异。
- 评价指标:最小均方根误差(root mean square error,RMSE)
- 为什么SVD应用在推荐系统中?
- 真实的数据集很稀疏,很多用户对于很多物品是没有评价的
- 先对数据集进行SVD分解,用一个能保留原来矩阵90%能量值的新矩阵代替
- 在低维空间(提取出来的主题空间)计算相似度
- 推荐引擎的挑战:
- 稀疏表示:实际数据有很多0值
- 相似度计算:可离线计算并保存相似度
- 如何在缺乏数据时给出推荐(冷启动cold-start):看成搜索问题
- 图像压缩:
- 可将图像大小压缩为原来的10%这种
实现
Numpy线性代数工具箱linalg
>>> import numpy as np
>>> U,Sigma,VT = np.linalg.svd([[1,1], [7,7]])
>>> U
array([[-0.14142136, -0.98994949],
       [-0.98994949,  0.14142136]])
>>> Sigma # 为了节省空间,以向量形式返回,实际为矩阵,其余元素均为0
array([  1.00000000e+01,   1.44854506e-16])
# 可以看到第1个数值比第二个数值大很多,所以特征2可以省去
>>> VT
array([[-0.70710678, -0.70710678],
       [-0.70710678,  0.70710678]])
通常的推荐策略:
def standEst(dataMat, user, simMeas, item):
    n = shape(dataMat)[1]
    simTotal = 0.0; ratSimTotal = 0.0
    for j in range(n):
        userRating = dataMat[user,j]
        if userRating == 0: continue
        overLap = nonzero(logical_and(dataMat[:,item].A>0, \
                                      dataMat[:,j].A>0))[0]
        if len(overLap) == 0: similarity = 0
        else: similarity = simMeas(dataMat[overLap,item], \
                                   dataMat[overLap,j])
        print 'the %d and %d similarity is: %f' % (item, j, similarity)
        simTotal += similarity
        ratSimTotal += similarity * userRating
    if simTotal == 0: return 0
    else: return ratSimTotal/simTotal

def recommend(dataMat, user, N=3, simMeas=cosSim, estMethod=standEst):
    unratedItems = nonzero(dataMat[user,:].A==0)[1]#find unrated items
    if len(unratedItems) == 0: return 'you rated everything'
    itemScores = []
    for item in unratedItems:
        estimatedScore = estMethod(dataMat, user, simMeas, item)
        itemScores.append((item, estimatedScore))
    return sorted(itemScores, key=lambda jj: jj[1], reverse=True)[:N]
基于SVD的评分估计:
def svdEst(dataMat, user, simMeas, item):
    n = shape(dataMat)[1]
    simTotal = 0.0; ratSimTotal = 0.0
    U,Sigma,VT = la.svd(dataMat)
    Sig4 = mat(eye(4)*Sigma[:4]) #arrange Sig4 into a diagonal matrix
    xformedItems = dataMat.T * U[:,:4] * Sig4.I  #create transformed items
    for j in range(n):
        userRating = dataMat[user,j]
        if userRating == 0 or j==item: continue
        similarity = simMeas(xformedItems[item,:].T,\
                             xformedItems[j,:].T)
        print 'the %d and %d similarity is: %f' % (item, j, similarity)
        simTotal += similarity
        ratSimTotal += similarity * userRating
    if simTotal == 0: return 0
    else: return ratSimTotal/simTotal
基于SVD的图像压缩:
这里原来的图像是32x32的,进行SVD分解,得到U,Sigma,VT,分别是32x2,2,32x2的,所以存储这3个矩阵的大小是:32x2+2+32x2=130,原来是32x32=1024,几乎10倍的压缩。
def printMat(inMat, thresh=0.8):
    for i in range(32):
        for k in range(32):
            if float(inMat[i,k]) > thresh:
                print 1,
            else: print 0,
        print ''

def imgCompress(numSV=3, thresh=0.8):
    myl = []
    for line in open('0_5.txt').readlines():
        newRow = []
        for i in range(32):
            newRow.append(int(line[i]))
        myl.append(newRow)
    myMat = mat(myl)
    print "****original matrix******"
    printMat(myMat, thresh)
    U,Sigma,VT = la.svd(myMat)
    # 将Sigma向量转换为矩阵,其他元素均为0的
    SigRecon = mat(zeros((numSV, numSV)))
    for k in range(numSV):#construct diagonal matrix from vector
        SigRecon[k,k] = Sigma[k]
    # 只保留前numSV个特征,进行数据重构
    reconMat = U[:,:numSV]*SigRecon*VT[:numSV,:]
    print "****reconstructed matrix using %d singular values******" % numSV
    printMat(reconMat, thresh)
参考
- 机器学习实战第14章
Read full-text »
FP-growth算法来高效发现频繁项集
2018-09-08
概述
- 搜索引擎自动补全查询项,查看互联网上的用词来找出频繁的项集以作推荐。
- FP-growth:
- 高效(比Apriori快2个数量级)发掘频繁项集,不能用于发现关联规则
-
对数据集进行两次扫描,Apriori会对每个潜在的都进行扫描
- 基本过程:
- (1)构建FP树
- (2)从FP树中挖掘频繁项集
- FP(frequent pattern)树:
- FP-growth算法将数据存储在FP树中
- 一个元素项可以在FP树中出现多次
- 每个项集以路径的方式存储在树中,项集的出现频率也被记录
- 具有相似元素的集合会共享树的一部分
-
节点链接(node link):相似项之间的链接,用于快速发现相似项的位置
- 构建包含两步(两次扫描):
- 1)第一次扫描统计各item出现的频率,保留支持度在给定阈值以上的,得到频率表(header table)
- 2)将数据按照频率表进行重新排序:是每个item内的排序,此时哪些支持度低的就直接被丢掉了
- 3)二次扫描,构建FP树
- 从FP树挖掘频繁项集:
- 3个步骤:
- 1)从FP树获得条件模式基
- 2)利用条件模式基,构建条件FP树
-
3)重复迭代前两步,直到树包含一个元素项为止
- 条件模式基(conditional pattern base):以所查找元素项为结尾的路径集合,每一条路径是一条前缀路径(prefix path)。
-
前面已经有了频率表在头指针表中,可从这里的单个频繁元素项开始
- 创建条件FP树:
- 1)找到某个频繁项集的条件模式基
- 2)去掉支持度小于阈值的item
-
3)用这些条件基(路径前缀)构建条件树
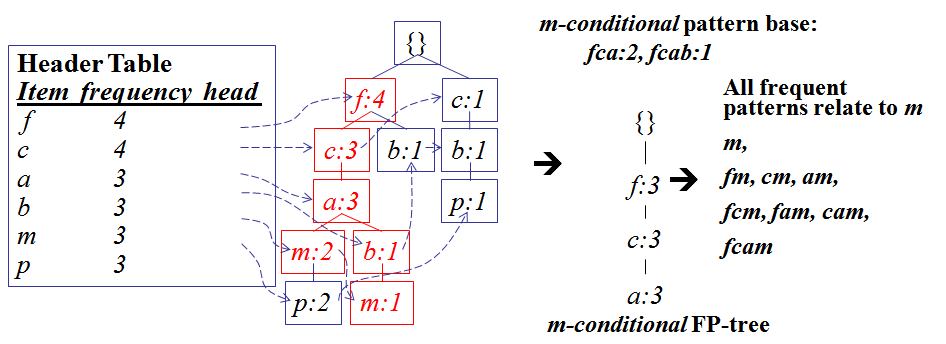
- 下图是对于上面数据中的m构建的条件FP树:
- 对于m含有的项包含3个({f,c,a,m,p}, {f,c,a,b,m}, {f,c,a,m,p}),
- 所以其条件基有3项({f,c,a,p}, {f,c,a,b}, {f,c,a,p}),
- 去掉支持度小于3的item,得到3项({f,c,a}, {f,c,a,b}, {f,c,a}),
- 所以其条件基为:fca:2, fcab:1(数值代表次数)。
- 类似的,上面是找的频繁集
m的条件树,可以再构建am,cm等的条件树,就能知道不同的组合的频繁集: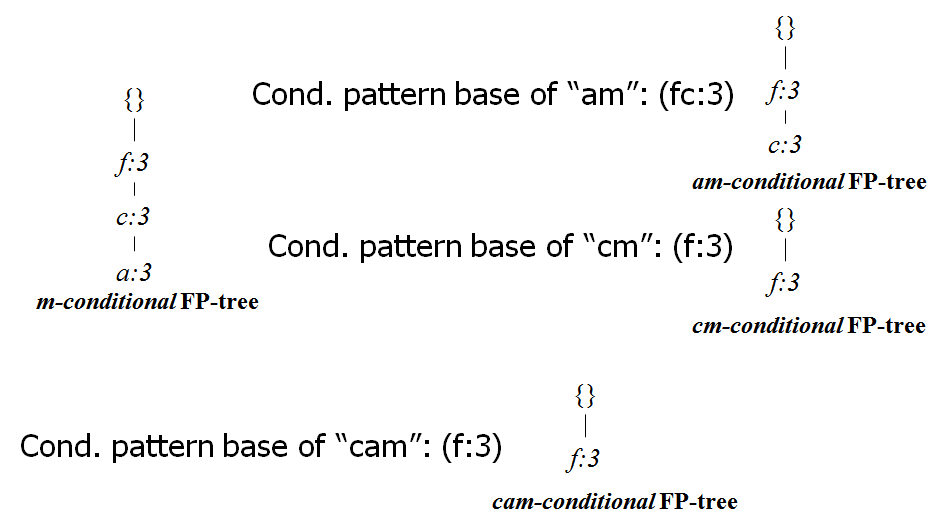
实现
Python源码版本
FP树构建:
class treeNode:
    def __init__(self, nameValue, numOccur, parentNode):
        self.name = nameValue
        self.count = numOccur
        self.nodeLink = None
        self.parent = parentNode      #needs to be updated
        self.children = {}

    def inc(self, numOccur):
        self.count += numOccur

    def disp(self, ind=1):
        print '  '*ind, self.name, ' ', self.count
        for child in self.children.values():
            child.disp(ind+1)

def createTree(dataSet, minSup=1): #create FP-tree from dataset but don't mine
    headerTable = {}
    #go over dataSet twice
    for trans in dataSet:#first pass counts frequency of occurance
        for item in trans:
            headerTable[item] = headerTable.get(item, 0) + dataSet[trans]
    for k in headerTable.keys():  #remove items not meeting minSup
        if headerTable[k] < minSup:
            del(headerTable[k])
    freqItemSet = set(headerTable.keys())
    #print 'freqItemSet: ',freqItemSet
    if len(freqItemSet) == 0: return None, None  #if no items meet min support -->get out
    for k in headerTable:
        headerTable[k] = [headerTable[k], None] #reformat headerTable to use Node link
    #print 'headerTable: ',headerTable
    retTree = treeNode('Null Set', 1, None) #create tree
    for tranSet, count in dataSet.items():  #go through dataset 2nd time
        localD = {}
        for item in tranSet:  #put transaction items in order
            if item in freqItemSet:
                localD[item] = headerTable[item][0]
        if len(localD) > 0:
            orderedItems = [v[0] for v in sorted(localD.items(), key=lambda p: p[1], reverse=True)]
            updateTree(orderedItems, retTree, headerTable, count)#populate tree with ordered freq itemset
    return retTree, headerTable #return tree and header table
从条件树挖掘频繁项集:
def mineTree(inTree, headerTable, minSup, preFix, freqItemList):
    bigL = [v[0] for v in sorted(headerTable.items(), key=lambda p: p[1])]#(sort header table)
    for basePat in bigL:  #start from bottom of header table
        newFreqSet = preFix.copy()
        newFreqSet.add(basePat)
        #print 'finalFrequent Item: ',newFreqSet    #append to set
        freqItemList.append(newFreqSet)
        condPattBases = findPrefixPath(basePat, headerTable[basePat][1])
        #print 'condPattBases :',basePat, condPattBases
        #2. construct cond FP-tree from cond. pattern base
        myCondTree, myHead = createTree(condPattBases, minSup)
        #print 'head from conditional tree: ', myHead
        if myHead != None: #3. mine cond. FP-tree
            #print 'conditional tree for: ',newFreqSet
            #myCondTree.disp(1)
            mineTree(myCondTree, myHead, minSup, newFreqSet, freqItemList)
pyfpgrowth版本
python的模块pyfpgrowth可以很友好的进行频繁项集挖掘:
import pyfpgrowth

transactions = [[1, 2, 5],
                [2, 4],
                [2, 3],
                [1, 2, 4],
                [1, 3],
                [2, 3],
                [1, 3],
                [1, 2, 3, 5],
                [1, 2, 3]]

# find patterns in baskets that occur over the support threshold
patterns = pyfpgrowth.find_frequent_patterns(transactions, 2)

# find patterns that are associated with another with a certain minimum probability
# 所以这个是可以发掘规则的。。?
rules = pyfpgrowth.generate_association_rules(patterns, 0.7)
新闻网站点击流中的频繁项集:
gongjing@hekekedeiMac ..eafileSyn/github/MLiA/source_code/Ch12 (git)-[master] % head kosarak.dat
1 2 3
1
4 5 6 7
1 8
9 10
11 6 12 13 14 15 16
1 3 7
17 18
11 6 19 20 21 22 23 24
1 25 3
import fpGrowth

parsedData = [line.split() for line in open('kosarak.dat').readlines()]
parsedData[0:2]
# [['1', '2', '3'], ['1']]

initSet = fpGrowth.createInitSet(parsedData)
myFPtree, myHeaderTab = fpGrowth.createTree(initSet, 100000)

myFreqList = []
fpGrowth.mineTree(myFPtree, myHeaderTab, 100000, set([]), myFreqList)
len(myFreqList)
# 9

myFreqList
# [set(['1']), set(['1', '6']), set(['3']), set(['11', '3']), set(['11', '3', '6']), set(['3', '6']), set(['11']), set(['11', '6']), set(['6'])]


import pyfpgrowth
patterns = pyfpgrowth.find_frequent_patterns(parsedData, 100000)
len(patterns)
# 8

patterns
# {('3', '6'): 265180, ('11', '3', '6'): 143682, ('6',): 601374, ('11', '3'): 161286, ('1', '6'): 132113, ('1',): 197522, ('3',): 450031, ('11', '6'): 324013}
# 这个相比上面的结果少了一个:set(['1'])
参考
- 机器学习实战第12章
- FP-Growth Algorithm
Read full-text »
Apriori关联分析
2018-09-05
概述
- 关联分析(association analysis)/关联规则学习(association rule learning):从大规模数据集中寻找物品间的隐含关系。
- 隐含关系的形式:
- 频繁项集(frequent item sets):经常出现在一块的物品的集合。经典例子【尿布与啤酒】:男人会在周四购买尿布和啤酒(尿布和啤酒在购物单中频繁出现)。
-
定量表示 -》支持度(support):数据集中包含该项集的记录所占的比例。
- 关联规则(association rules):暗示两种物品之间可能存在很强的关系。
-
定量表示 -》置信度(confidence):= support(P|H)/support(P),这里的
P|H是并集意思,指所有出现在集合P或者集合H中的元素。
- 置信度存在一定的问题,因为只考虑了X的频率,没有考虑Y的频率。当Y本身的频率就很高时,(X,Y)的频率可能本来就很高,不一定存在强相关性。
- 引入提升度(lift):= support(P|H)/support(P)xsupport(H)。下面是个例子:beer和soda的置信度很高,但是lift值为1。
- 置信度越高,越可信。lift值接近1时,说明两者没有什么相关性。

- Apriori算法:
- apriori: 拉丁文,指来自以前。定义问题时通常会使用先验知识或者假设,称作一个先验(a priori)。在贝叶斯统计中也很常见。
- 目标:鉴定频繁项集。对于N种物品的数据集,其项集组合是2^N-1种组合,非常之大。
- 原理:如果某个项集是频繁的,那么它的所有子集也是频繁的。如果一个项集是非频繁的,那么它的所有超集也是非频繁的。
- 示例:这里演示了如果苹果不是一个频繁集,那么包含其的超集也不是的,可以不用寻找这部分以确定是否含有频繁集。

- 关联规则:
- 鉴定强相关的
- 使用置信度衡量相关性,同样采用apriori规则,以减少需要衡量的关系对数
实现
Python源码版本
Apriori算法:
def createC1(dataSet):
    C1 = []
    for transaction in dataSet:
        for item in transaction:
            if not [item] in C1:
                C1.append([item])

    C1.sort()
    return map(frozenset, C1)#use frozen set so we
                            #can use it as a key in a dict

def scanD(D, Ck, minSupport):
	# 扫描集合D,把Ck中支持度低的item去掉
    ssCnt = {}
    for tid in D:
        for can in Ck:
            if can.issubset(tid):
                if not ssCnt.has_key(can): ssCnt[can]=1
                else: ssCnt[can] += 1
    numItems = float(len(D))
    retList = []
    supportData = {}
    for key in ssCnt:
        support = ssCnt[key]/numItems
        if support >= minSupport:
            retList.insert(0,key)
        supportData[key] = support
    return retList, supportData

def aprioriGen(Lk, k): #creates Ck
    retList = []
    lenLk = len(Lk)
    for i in range(lenLk):
        for j in range(i+1, lenLk):
            L1 = list(Lk[i])[:k-2]; L2 = list(Lk[j])[:k-2]
            L1.sort(); L2.sort()
            if L1==L2: #if first k-2 elements are equal
                retList.append(Lk[i] | Lk[j]) #set union
    return retList

def apriori(dataSet, minSupport = 0.5):
    C1 = createC1(dataSet)
    D = map(set, dataSet)
    L1, supportData = scanD(D, C1, minSupport)
    L = [L1]
    k = 2
    while (len(L[k-2]) > 0):
        Ck = aprioriGen(L[k-2], k)
        Lk, supK = scanD(D, Ck, minSupport)#scan DB to get Lk
        supportData.update(supK)
        L.append(Lk)
        k += 1
    return L, supportData
关联规则生成函数:
def generateRules(L, supportData, minConf=0.7):  #supportData is a dict coming from scanD
    bigRuleList = []
    for i in range(1, len(L)):#only get the sets with two or more items
        for freqSet in L[i]:
            H1 = [frozenset([item]) for item in freqSet]
            if (i > 1):
                rulesFromConseq(freqSet, H1, supportData, bigRuleList, minConf)
            else:
                calcConf(freqSet, H1, supportData, bigRuleList, minConf)
    return bigRuleList

def calcConf(freqSet, H, supportData, brl, minConf=0.7):
    prunedH = [] #create new list to return
    for conseq in H:
        conf = supportData[freqSet]/supportData[freqSet-conseq] #calc confidence
        if conf >= minConf:
            print freqSet-conseq,'-->',conseq,'conf:',conf
            brl.append((freqSet-conseq, conseq, conf))
            prunedH.append(conseq)
    return prunedH

def rulesFromConseq(freqSet, H, supportData, brl, minConf=0.7):
    m = len(H[0])
    if (len(freqSet) > (m + 1)): #try further merging
        Hmp1 = aprioriGen(H, m+1)#create Hm+1 new candidates
        Hmp1 = calcConf(freqSet, Hmp1, supportData, brl, minConf)
        if (len(Hmp1) > 1):    #need at least two sets to merge
            rulesFromConseq(freqSet, Hmp1, supportData, brl, minConf)
Efficient-Apriori版本
sklearn没有直接可调用的工具,现在有现成的模块Efficient-Apriori,可以很方便的进行关联分析:
from efficient_apriori import apriori
transactions = [('eggs', 'bacon', 'soup'),
                ('eggs', 'bacon', 'apple'),
                ('soup', 'bacon', 'banana')]
itemsets, rules = apriori(transactions, min_support=0.5,  min_confidence=1)
print(rules)  # [{eggs} -> {bacon}, {soup} -> {bacon}]
处理大数据集:
def data_generator(filename):
  """
  Data generator, needs to return a generator to be called several times.
  """
  def data_gen():
    with open(filename) as file:
      for line in file:
        yield tuple(k.strip() for k in line.split(','))

  return data_gen

transactions = data_generator('dataset.csv')
itemsets, rules = apriori(transactions, min_support=0.9, min_confidence=0.6)
参考
Read full-text »
K均值聚类算法
2018-09-02
目录
聚类的含义和类型
聚类(clustering):将相似的对象归到同一个簇中,将不相似对象归到不同簇,有点像全自动分类,是一种无监督的学习。sklearn提供了一个常见聚类算法的比较: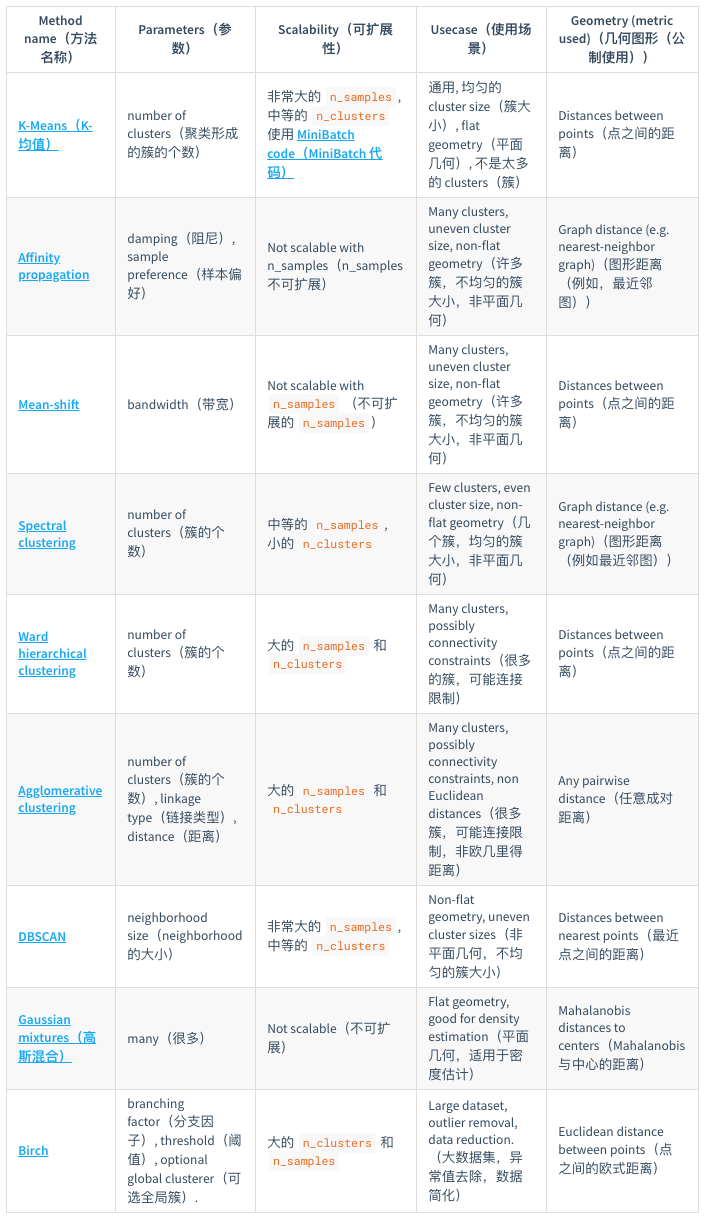
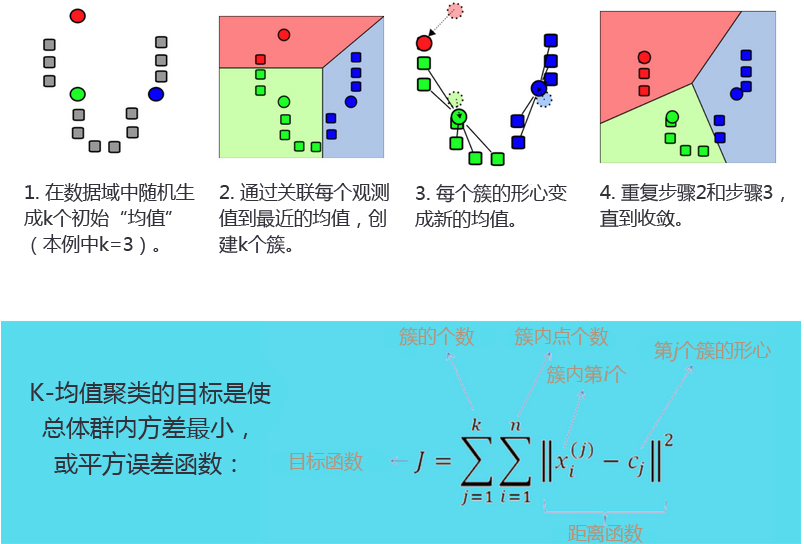
k-均值聚类
- K-均值聚类(K-means clustering):发现k个不同的簇,且每个簇的中心采用簇中所含值的均值计算而成(因此成为K-均值)。
- 簇识别(cluster identification):给出聚类结果的含义。
- K-均值聚类过程:
K-均值聚类的后处理
- 可能提高分类性能
- k的选择是否正确?误差和可用于评估聚类质量
- 问题:聚类结果可能不准确,收敛于局部最优,而非全局最优。下面是一个例子:
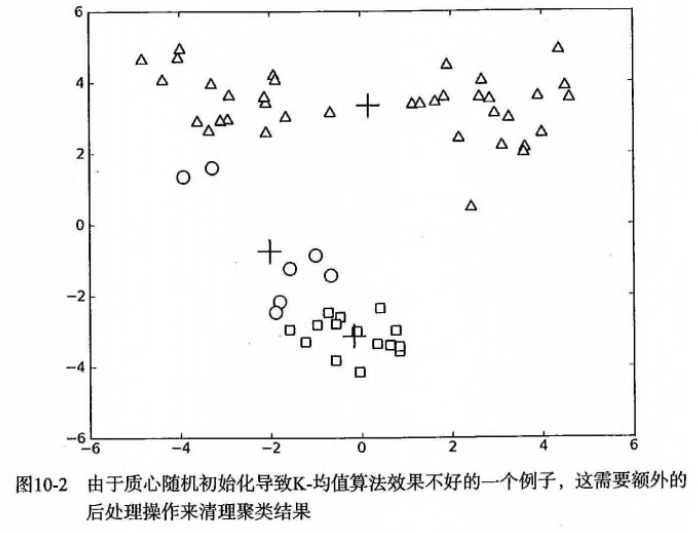
- 方案1:多尝试不同的随机初始化中心,看结果是否一致。【初始化的随机性会对结果产生影响】
- 方案2(二维):人为合并簇,比如上图中下面的两个簇(圆圈+方块)
- 方案2(高维):1)合并最近的质心,2)合并两个使得SSE增幅最小的质心。
二分K-均值聚类
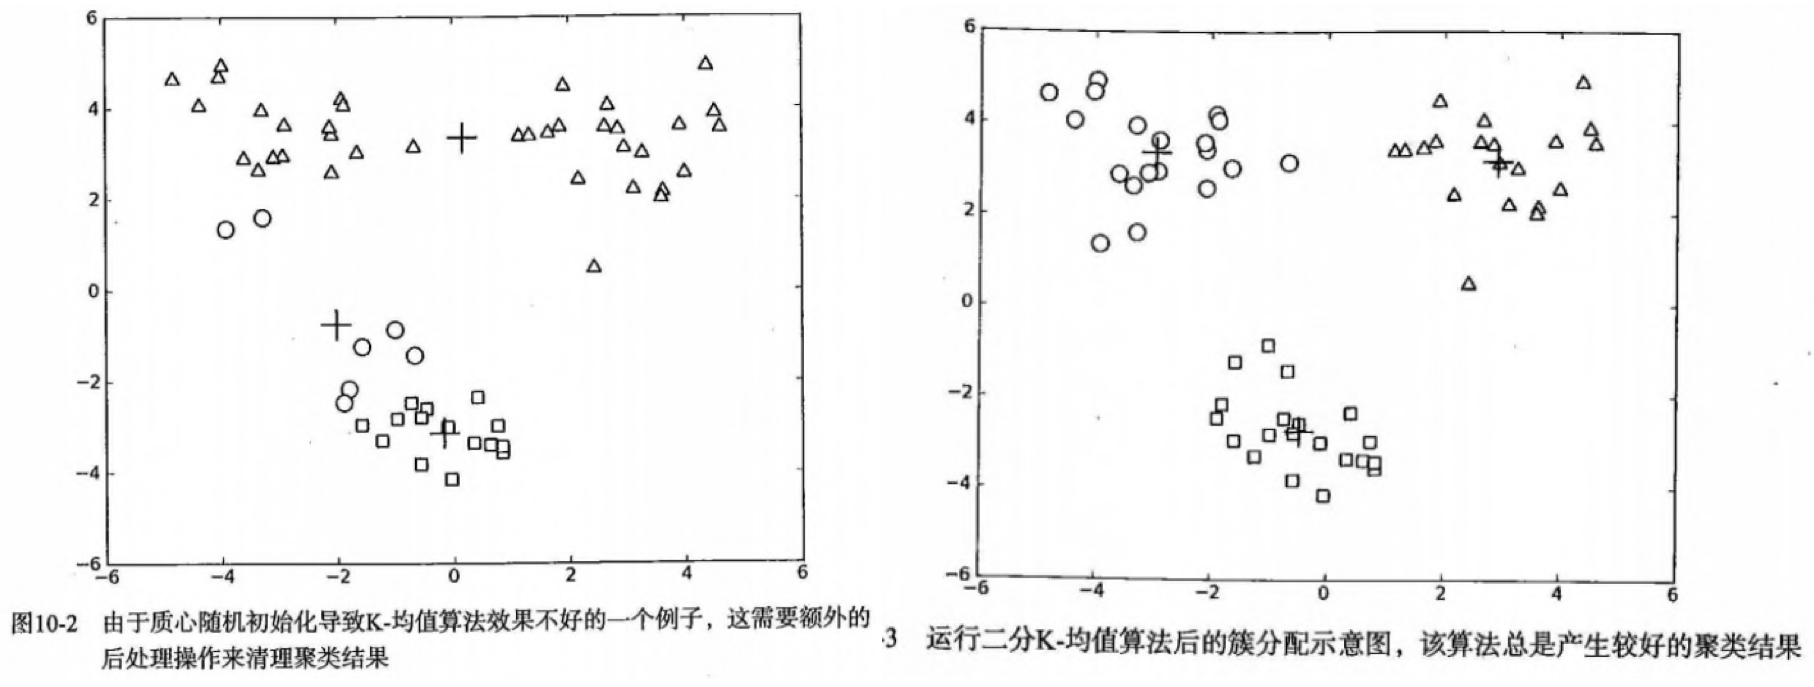
- 二分K-均值(bisecting K-means):克服K-均值算法收敛于局部最小的问题
- 过程:1)将所有点看成一个簇,2)当簇数目小于指定数k时,对每个簇:计算总误差,进行k-均值聚类(k=2),计算将该簇一分为二后的总误差,3)选择使得误差最小的那个簇进行划分操作。
- 上面第(3)步是选择使得误差最小的那个簇进行划分操作。,也可以是所对误差平方和最大的簇(似乎更容易理解)进行再一次的划分,因为误差平方和越大,表示该簇聚类越不好,越有可能是多个簇被当成一个簇了,所以我们首先需要对这个簇进行划分。
- 属于层次聚类的一种,是分裂的想法:先是所有的都属于一类,再慢慢的分为更细的不同的类别。
- 效果:运行多次后会收敛到全局最小,比如在上面的数据集中效果更好。
Python源码版本
K-均值聚类:
def distEclud(vecA, vecB):
	""" 计算两数据点之间的距离,这里是欧式距离
	"""
    return sqrt(sum(power(vecA - vecB, 2))) #la.norm(vecA-vecB)

def randCent(dataSet, k):
	""" 随机初始化选取k个中心,注意这些点不是原来有的数据点
	"""
    n = shape(dataSet)[1]
    centroids = mat(zeros((k,n)))#create centroid mat
    for j in range(n):#create random cluster centers, within bounds of each dimension
        minJ = min(dataSet[:,j])
        rangeJ = float(max(dataSet[:,j]) - minJ)
        centroids[:,j] = mat(minJ + rangeJ * random.rand(k,1))
    return centroids

def kMeans(dataSet, k, distMeas=distEclud, createCent=randCent):
    m = shape(dataSet)[0]
    clusterAssment = mat(zeros((m,2)))#create mat to assign data points
                                      #to a centroid, also holds SE of each point
    centroids = createCent(dataSet, k)
    clusterChanged = True
    while clusterChanged:
        clusterChanged = False
        for i in range(m):#for each data point assign it to the closest centroid
            minDist = inf; minIndex = -1
            for j in range(k):
                distJI = distMeas(centroids[j,:],dataSet[i,:])
                if distJI < minDist:
                    minDist = distJI; minIndex = j
            if clusterAssment[i,0] != minIndex: clusterChanged = True
            clusterAssment[i,:] = minIndex,minDist**2
        print centroids
        for cent in range(k):#recalculate centroids
            ptsInClust = dataSet[nonzero(clusterAssment[:,0].A==cent)[0]]#get all the point in this cluster
            centroids[cent,:] = mean(ptsInClust, axis=0) #assign centroid to mean
    return centroids, clusterAssment
二分 K-均值聚类:
def biKmeans(dataSet, k, distMeas=distEclud):
    m = shape(dataSet)[0]
    clusterAssment = mat(zeros((m,2)))
    centroid0 = mean(dataSet, axis=0).tolist()[0]
    centList =[centroid0] #create a list with one centroid
    for j in range(m):#calc initial Error
        clusterAssment[j,1] = distMeas(mat(centroid0), dataSet[j,:])**2
    while (len(centList) < k):
        lowestSSE = inf
        for i in range(len(centList)):
            ptsInCurrCluster = dataSet[nonzero(clusterAssment[:,0].A==i)[0],:]#get the data points currently in cluster i
            centroidMat, splitClustAss = kMeans(ptsInCurrCluster, 2, distMeas)
            sseSplit = sum(splitClustAss[:,1])#compare the SSE to the currrent minimum
            sseNotSplit = sum(clusterAssment[nonzero(clusterAssment[:,0].A!=i)[0],1])
            print "sseSplit, and notSplit: ",sseSplit,sseNotSplit
            if (sseSplit + sseNotSplit) < lowestSSE:
                bestCentToSplit = i
                bestNewCents = centroidMat
                bestClustAss = splitClustAss.copy()
                lowestSSE = sseSplit + sseNotSplit
        bestClustAss[nonzero(bestClustAss[:,0].A == 1)[0],0] = len(centList) #change 1 to 3,4, or whatever
        bestClustAss[nonzero(bestClustAss[:,0].A == 0)[0],0] = bestCentToSplit
        print 'the bestCentToSplit is: ',bestCentToSplit
        print 'the len of bestClustAss is: ', len(bestClustAss)
        centList[bestCentToSplit] = bestNewCents[0,:].tolist()[0]#replace a centroid with two best centroids
        centList.append(bestNewCents[1,:].tolist()[0])
        clusterAssment[nonzero(clusterAssment[:,0].A == bestCentToSplit)[0],:]= bestClustAss#reassign new clusters, and SSE
    return mat(centList), clusterAssment
sklearn版本
对二维数据点进行聚类:
from sklearn.cluster import KMeans
import numpy as np
X = np.array([[1, 2], [1, 4], [1, 0],
              [10, 2], [10, 4], [10, 0]])
kmeans = KMeans(n_clusters=2, random_state=0).fit(X)
kmeans.labels_
# array([1, 1, 1, 0, 0, 0], dtype=int32)

kmeans.predict([[0, 0], [12, 3]])
# array([1, 0], dtype=int32)

kmeans.cluster_centers_
# array([[10.,  2.],
#       [ 1.,  2.]])
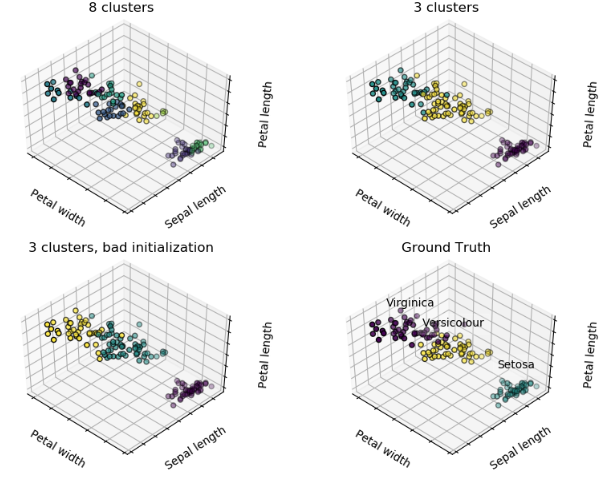
对iris数据集进行聚类并与真实的进行可视化比较:
# Code source: Gaël Varoquaux
# Modified for documentation by Jaques Grobler
# License: BSD 3 clause

import numpy as np
import matplotlib.pyplot as plt
# Though the following import is not directly being used, it is required
# for 3D projection to work
from mpl_toolkits.mplot3d import Axes3D

from sklearn.cluster import KMeans
from sklearn import datasets

np.random.seed(5)

iris = datasets.load_iris()
X = iris.data
y = iris.target

estimators = [('k_means_iris_8', KMeans(n_clusters=8)),
              ('k_means_iris_3', KMeans(n_clusters=3)),
              ('k_means_iris_bad_init', KMeans(n_clusters=3, n_init=1,
                                               init='random'))]

fignum = 1
titles = ['8 clusters', '3 clusters', '3 clusters, bad initialization']
for name, est in estimators:
    fig = plt.figure(fignum, figsize=(4, 3))
    ax = Axes3D(fig, rect=[0, 0, .95, 1], elev=48, azim=134)
    est.fit(X)
    labels = est.labels_

    ax.scatter(X[:, 3], X[:, 0], X[:, 2],
               c=labels.astype(np.float), edgecolor='k')

    ax.w_xaxis.set_ticklabels([])
    ax.w_yaxis.set_ticklabels([])
    ax.w_zaxis.set_ticklabels([])
    ax.set_xlabel('Petal width')
    ax.set_ylabel('Sepal length')
    ax.set_zlabel('Petal length')
    ax.set_title(titles[fignum - 1])
    ax.dist = 12
    fignum = fignum + 1

# Plot the ground truth
fig = plt.figure(fignum, figsize=(4, 3))
ax = Axes3D(fig, rect=[0, 0, .95, 1], elev=48, azim=134)

for name, label in [('Setosa', 0),
                    ('Versicolour', 1),
                    ('Virginica', 2)]:
    ax.text3D(X[y == label, 3].mean(),
              X[y == label, 0].mean(),
              X[y == label, 2].mean() + 2, name,
              horizontalalignment='center',
              bbox=dict(alpha=.2, edgecolor='w', facecolor='w'))
# Reorder the labels to have colors matching the cluster results
y = np.choose(y, [1, 2, 0]).astype(np.float)
ax.scatter(X[:, 3], X[:, 0], X[:, 2], c=y, edgecolor='k')

ax.w_xaxis.set_ticklabels([])
ax.w_yaxis.set_ticklabels([])
ax.w_zaxis.set_ticklabels([])
ax.set_xlabel('Petal width')
ax.set_ylabel('Sepal length')
ax.set_zlabel('Petal length')
ax.set_title('Ground Truth')
ax.dist = 12

fig.show()
选择合适的K,可参考这里:
from sklearn.cluster import KMeans
from sklearn import metrics
from nested_dict import nested_dict

silhouette_score_dict = nested_dict(1, int)
for k in range(3, 15):
    kmeans_model = KMeans(n_clusters=k, random_state=0).fit(df_select_01)
    silhouette_score = metrics.silhouette_score(df_select_01, kmeans_model.labels_,metric='euclidean')
    print(k, silhouette_score)
    silhouette_score_dict[k] = silhouette_score
参考
- 机器学习实战第10章
- K-means Clustering@sklearn
Read full-text »
Latest articles
Links
- ZhangLab , RISE database , THU life , THU info
- Data analysis: pandas , numpy , scipy
- ML/DL: sklearn , sklearn(中文) , pytorch
- Visualization: seaborn , matplotlib , gallery
- Github: me


