CS229 notes
2018-10-11
课程信息
机器学习入门,Coursera的课程内容和CS229的内容相似,但是后者的难度更大,有更多对于公式的推导,可以先看Coursera再补充看CS229的。
- Coursera video: https://www.coursera.org/learn/machine-learning
- Coursera video slides and quiz on Github (fork from atinesh-s): https://github.com/Tsinghua-gongjing/Coursera-Machine-Learning-Stanford
-
Webpage notes: http://www.holehouse.org/mlclass/
- Stanford course material: http://cs229.stanford.edu/syllabus.html
-
Stanford video: https://see.stanford.edu/course/cs229
- CS229 cheatsheet:English & Chinese & @Stanford
课程笔记
- 注意:
很多介绍的内容都很详细,这里只记录一些自己觉得容易忘记或者难以理解的点。
01 and 02: Introduction, Regression Analysis and Gradient Descent
- definition: a computer program is said to learn from experience E with respect to some task T and some performance measure P, if its performance on T, as measured by P, improves with experience E . — Tom Mitchell (1998)
- supervised learning:
- supervised learning: “right answers” given
- regression: predict continuous valued output (e.g., house price)
- classification: predict discrete valued output (e.g., cancer type)
- unsupervised learning:
- unlabelled data, using various clustering methods to structure it
- examples: google news, gene expressions, organise computer clusters, social network analysis, astronomical data analysis
- cocktail party problem: overlapped voice, how to separate?
- linear regression one variable (univariate):
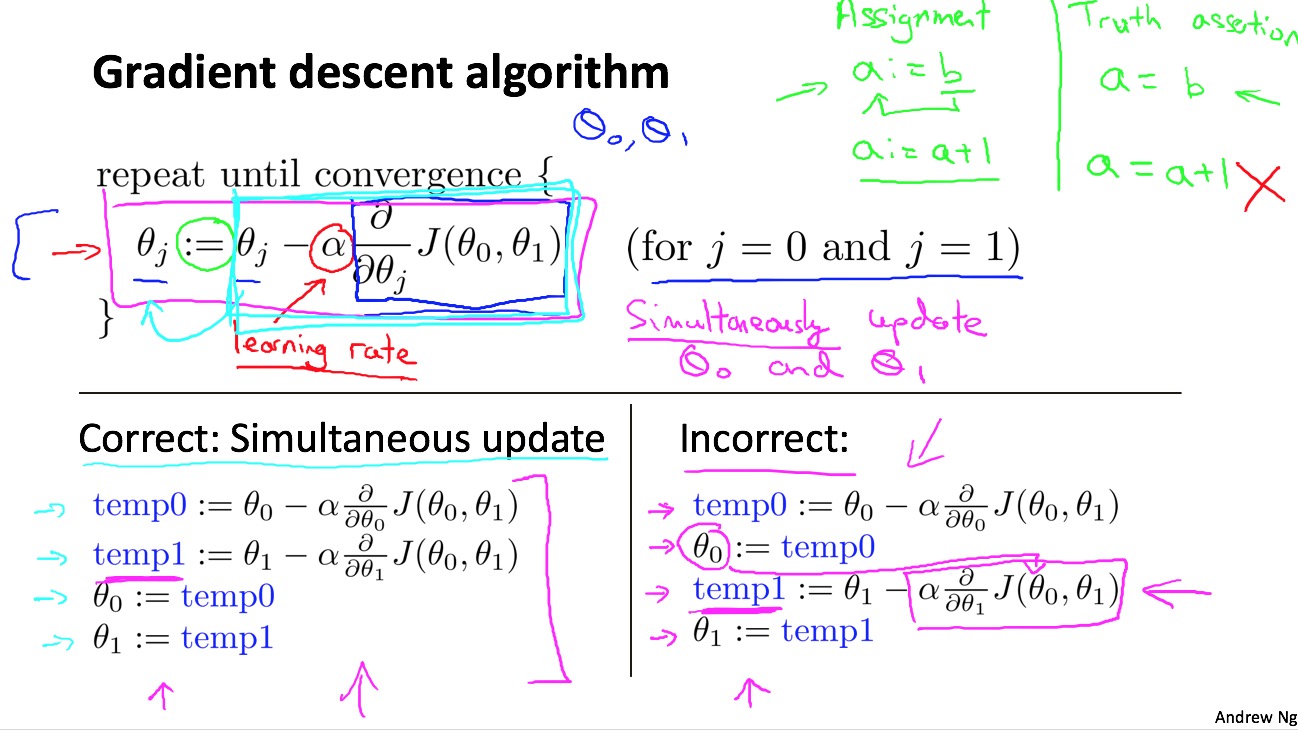
- parameter estimation: gradient decent algorithm
03: Linear Algebra - review
- 概念:
- matrix: rectangular array of numbers: rows x columns
- element: i -> ith row, j -> jth column
- vector: a nx1 matrix
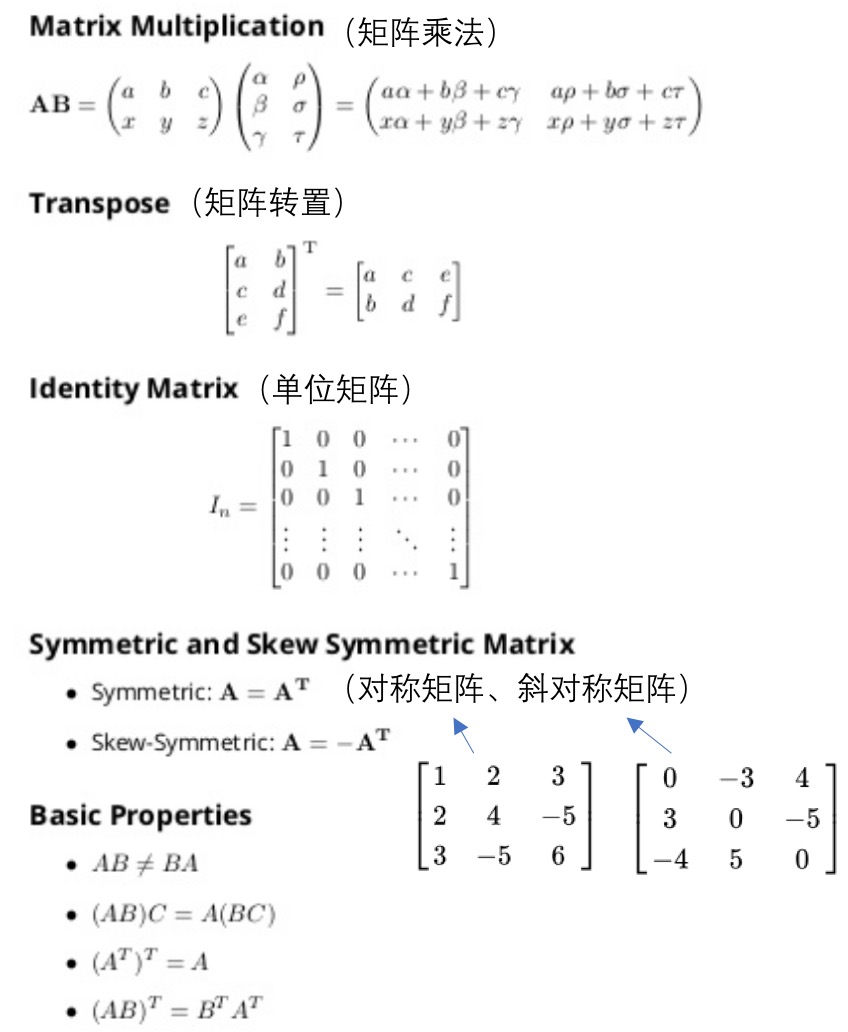
- 操作:
04: Linear Regression with Multiple Variables
- 多特征使得fitting函数变得更复杂,多元线性回归。
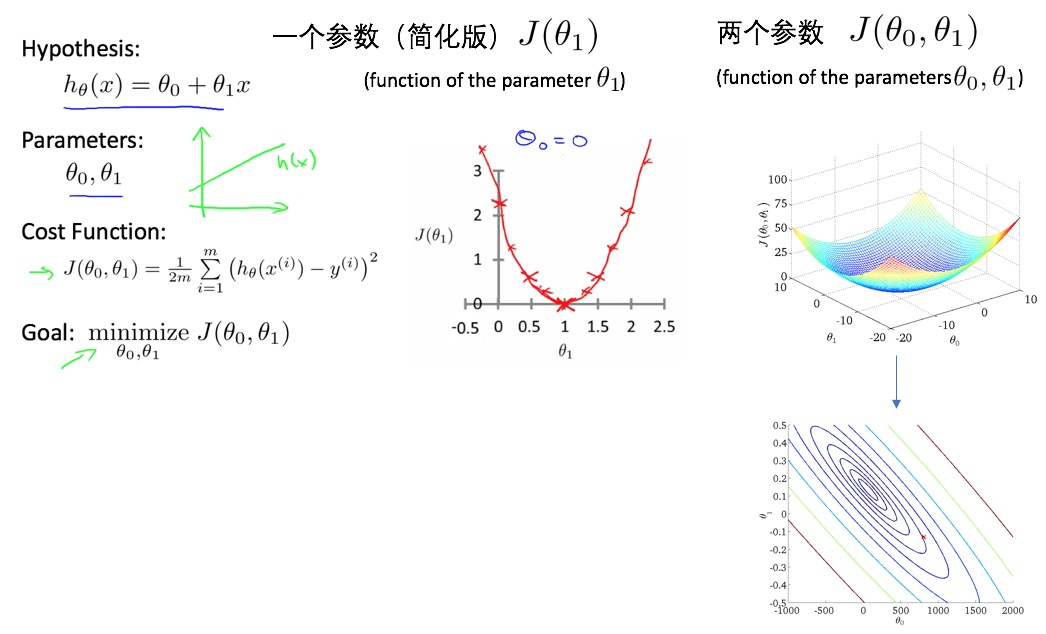
- 多元线性回归的损失函数:
- 多变量的梯度递减:

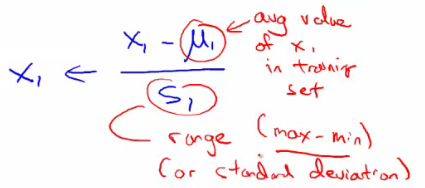
- 规则1:feature scaling。对于不同的feature范围,通过特征缩减到可比较的范围,通常[-1, 1]之间。
- 归一化:1)除以各自特征最大值;2)mean normalization(如下):
- 规则2:learning rate。选取合适的学习速率,太小则收敛太慢,太大则损失函数不一定会随着迭代次数减小(甚至不收敛)。
- 损失函数曲线:直观判断训练多久时模型会达到收敛
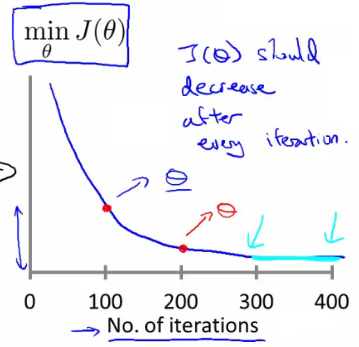
- 特征和多项式回归:对于非线性问题,也可以尝试用多项式的线性回归,基于已有feature构建额外的特征,比如房间size的三次方或者开根号等,但是要注意与模型是否符合。比如size的三次方作为一个特征,随着size增大到一定值后,其模型输出值是减小的,这显然不符合size越大房价越高。
- Normal equation:根据损失函数,求解最小损失岁对应的theta向量的,类似于求导,但是这里采用的是矩阵运算的方式。
- 求解方程式如下:

- 这里就直接根据训练集和label值矩阵求解出最小损失对对应的各个参数(权重)。
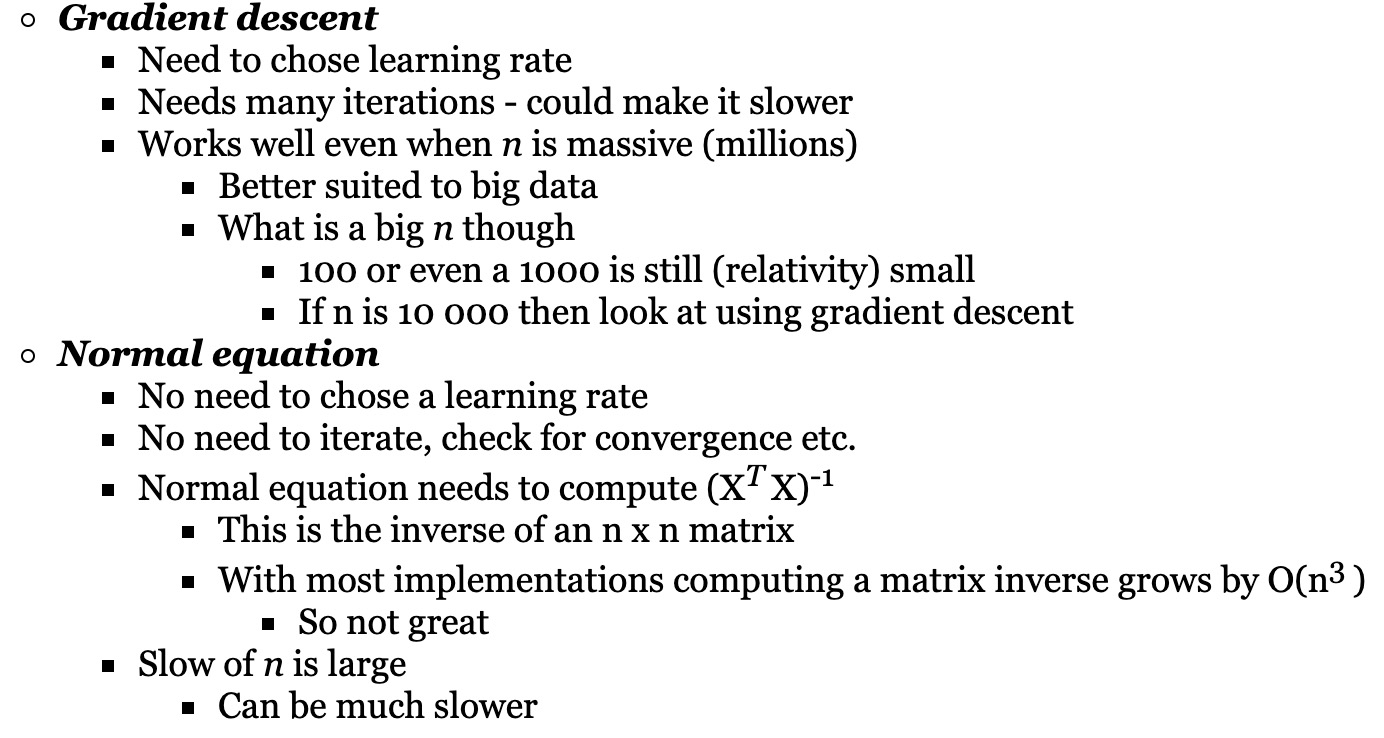
- 什么时候用梯度递减,什么时候用normal equation去求解最小损失函数处对应的theta向量?
05: Octave[incomplete]
06: Logistic Regression
- 逻辑回归:分类,比如email是不是垃圾邮件,肿瘤是不是恶性的。预测y值(label),=1(positive class),=0(negative class)。
- 分类 vs 逻辑回归(逻辑回归转换为分类):
- 分类:值为0或1(是离散的,且只能取这两个值)。
- 逻辑回归:预测值在[0,1之间]。
- 阈值法:用逻辑回归模型,预测值>=0.5,则y=1,预测值<0.5,则y=0.
- 逻辑回归函数(假设,hypothesis):
- 公式:

- 分布:
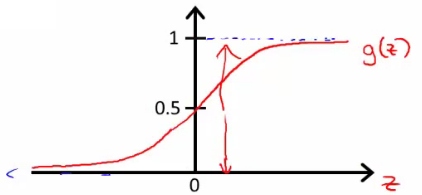
- 公式:
- 决策边界(decision boundary):区分概率值(0.5)对应的theta值=0,所以函数=0所对应的线。
- 线性区分的边界:
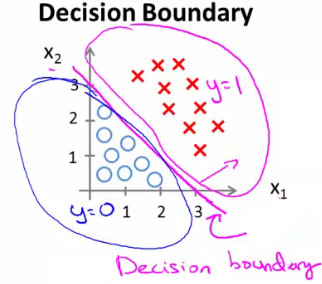
- 非线性区分的边界:

- 线性区分的边界:
- 损失函数:
- 问题:
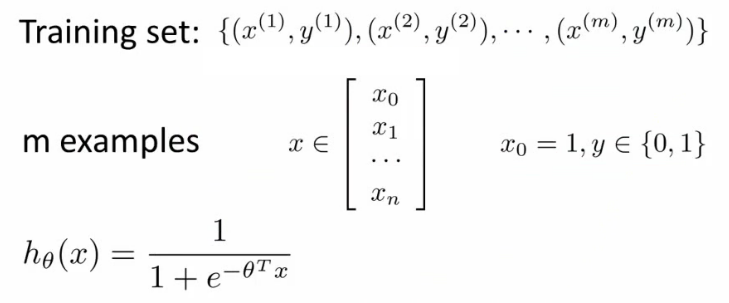
- 如果延续线性函数的损失函数,则可写成如下,但是当把逻辑函数代入时,这个损失函数是一个非凸优化(non-convex,有很多局部最优,难以找到全局最优)的函数。

- 因此,需要使用一个凸函数作为逻辑函数的损失函数:

07: Regularization
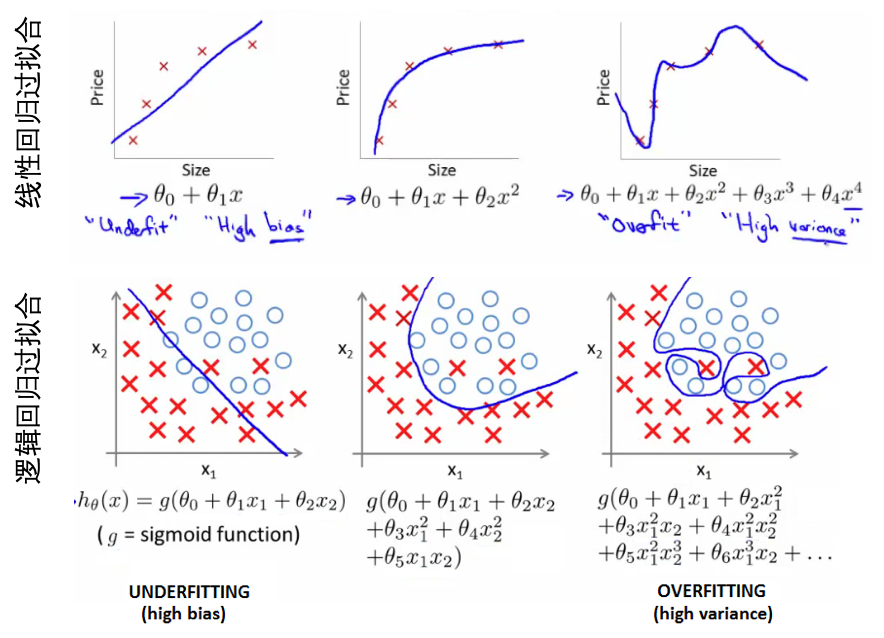
- 过拟合的问题:
- 如何解决过拟合:
- 如何鉴定是否过拟合?泛化能力很差,对新样本的预测效果很糟糕。
- 低维时可以画出来,看拟合的好坏?高维时不能很好的展示。
- 特征太多,数据太少容易过拟合。
- 方案【1】减少特征数目。1)手动挑选特征;2)算法模型挑选;3)挑选特征会带来信息丢失
- 方案【2】正则化。1)保留所有特征,但是减小权重函数的量级;2)当有很多特征时,每一个特征对于预测都贡献一点点。
- 正则化:
- 参数值较小时模型越简单
- 简单的模型更不容易过拟合
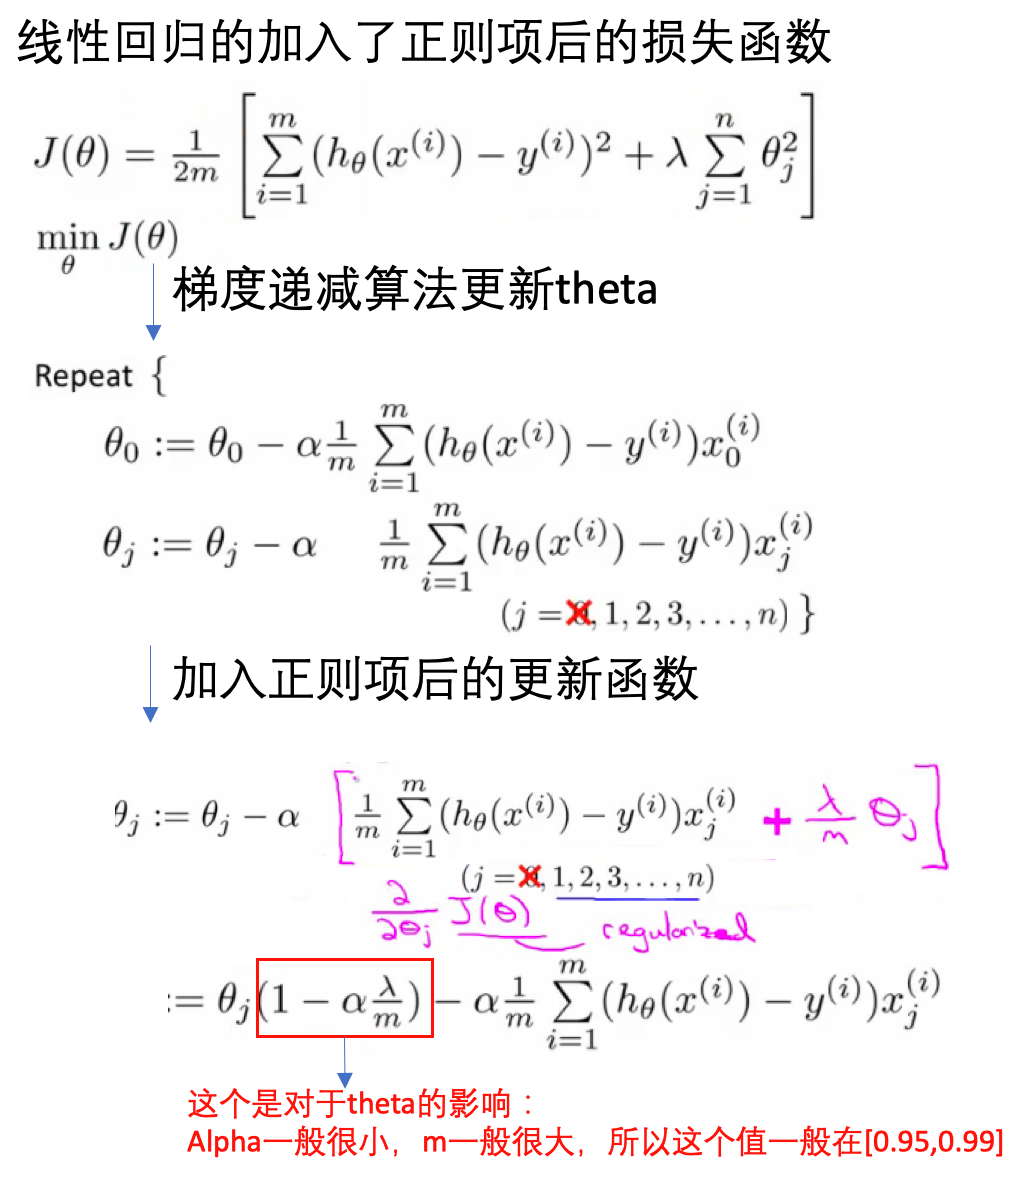
- 加入正则项,减小每个参数的值
- 加入正则项后的损失函数:

- λ正则化参数:平衡模型对于训练数据的拟合程度,和所有参数趋于小(模型趋向于简单)
08: Neural Networks - Representation
- 非线性问题:线性不可分,增加各种特征使得可分。比如根据图片检测汽车(计算机视觉)。当特征空间很大时,逻辑回归不再适用,而神经网络则是一个更好的非线性模型。
- 神经网络:想要模拟大脑(不同的皮层区具有不同的功能,如味觉、听觉、触觉等),上世纪80-90年代很流行,90年达后期开始没落,现在又很流行,解决很多实际的问题。
- 神经网络:
- cell body, input wires (dendrities, 树突), output wire (axon,轴突)
- 逻辑单元:最简单的神经元。一个输入层,一个激活函数,一个输出层。
- 神经网络:激活函数,权重矩阵:
- 输入层,输出层,隐藏层
- ai(j) - activation of unit i in layer j

- 前向传播:向量化实现,使用向量表示每一层次的输出。
- 使用神经网络实现逻辑符号(逻辑与、逻辑或,逻辑和):
- 实现的是逻辑,而非线性问题,所以神经网络能很好的用于非线性问题上。
- 下面的是实现 XNOR (NOT XOR):
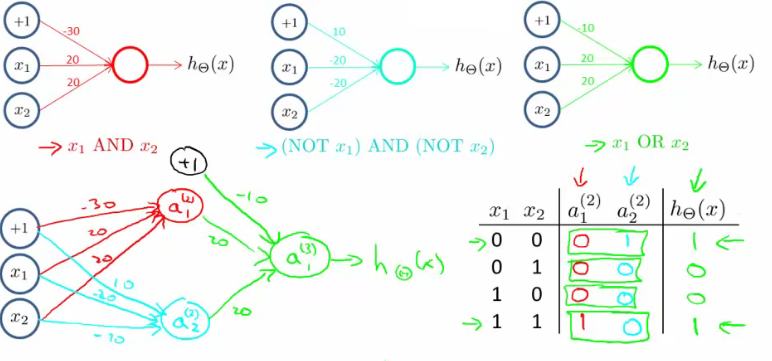
- 多分类问题:one-vs-all
09: Neural Networks - Learning
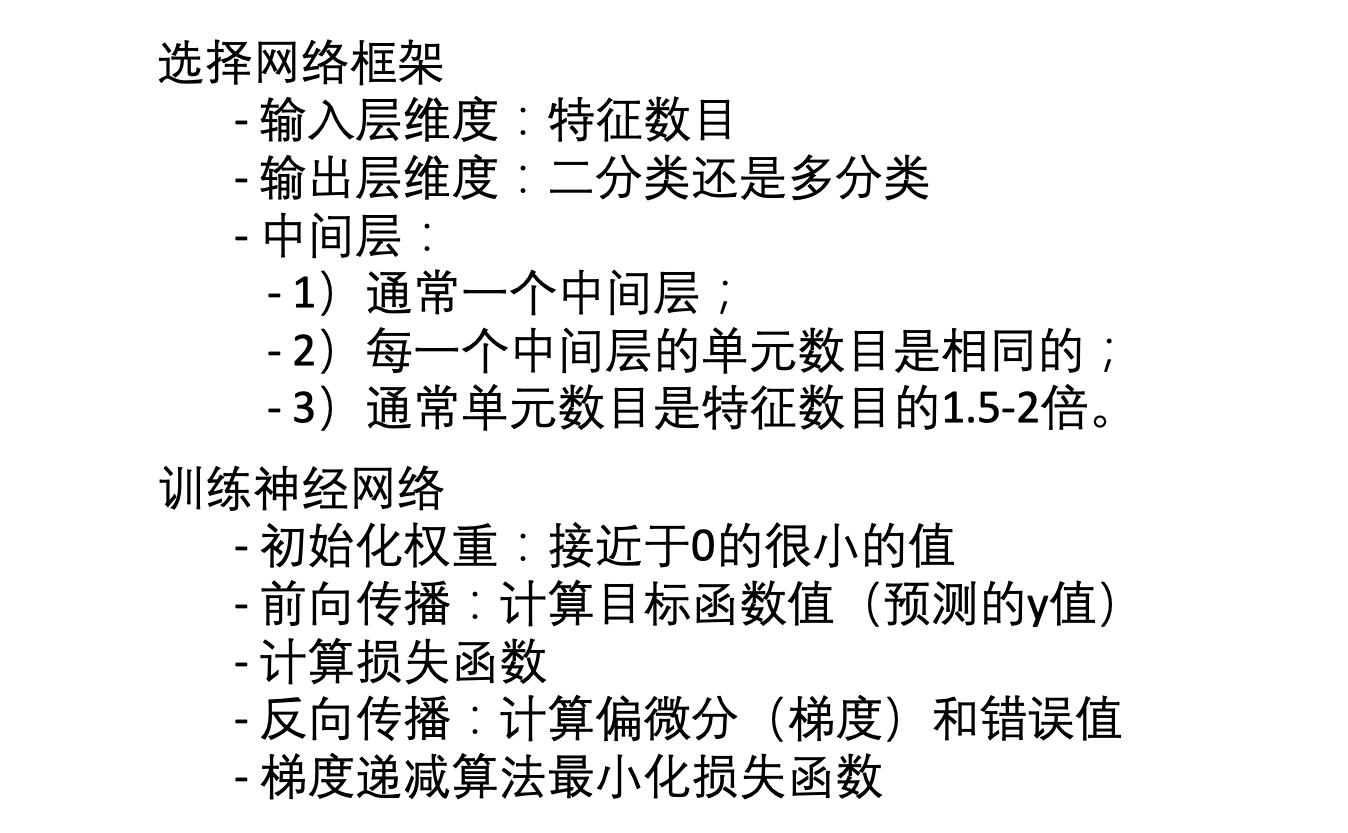
- 神经网络分类问题:
- 二分类:输出为0或1
- 多分类:比如有k个类别,则输出一个向量(长度为k,独热编码表示)
- 损失函数:类比逻辑回归的损失函数
- 逻辑回归的损失函数(对数损失+权重参数的正则项):

- 神经网络的损失函数:
- 注意1:输出有k个节点,所以需要对所有的节点进行计算
- 注意2:第一部分,所有节点的平均逻辑对数损失
- 注意3:第二部分,正则和(又称为weight decay),只不过是所有参数的

- 前向传播(forward propagation):
- 训练样本、结果已知
- 每一层的权重可以用theta向量表示,这也是需要确定优化的参数
- 每一层的激活函数已知
- 就可以根据以上的数据和参数一层一层的计算每个节点的值,并与已知的值进行比较,构建损失函数
- 反向传播(back propagation):
- 每一层的每个节点都会计算出一个值,但是这个值与真实值是有差异的,因此可以计算每个节点的错误。
- 但是每个节点的真实值我们是不知道的,只知道最后的y值(输出值),因此需要从最后的输出值开始计算。
- 这个文章: 一文弄懂神经网络中的反向传播法——BackPropagation通过一个简单的3层网络的计算,演示了反向传播的过程,可以参考一下:
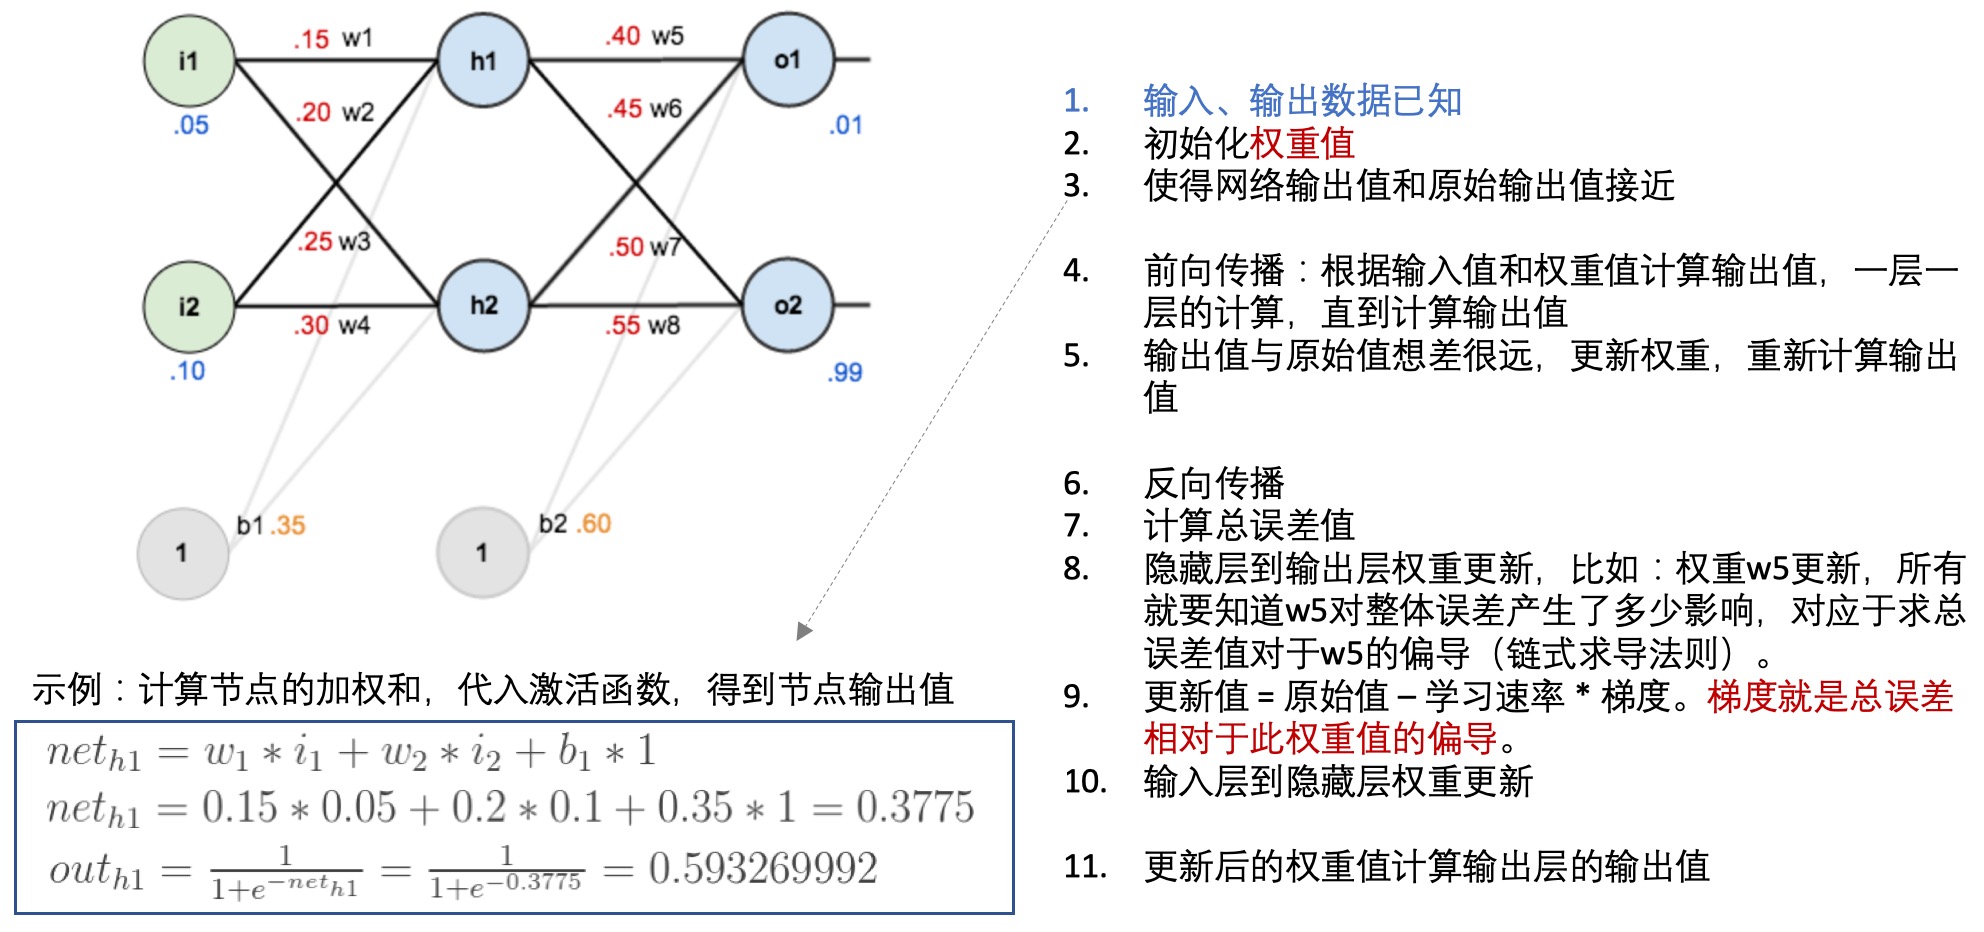
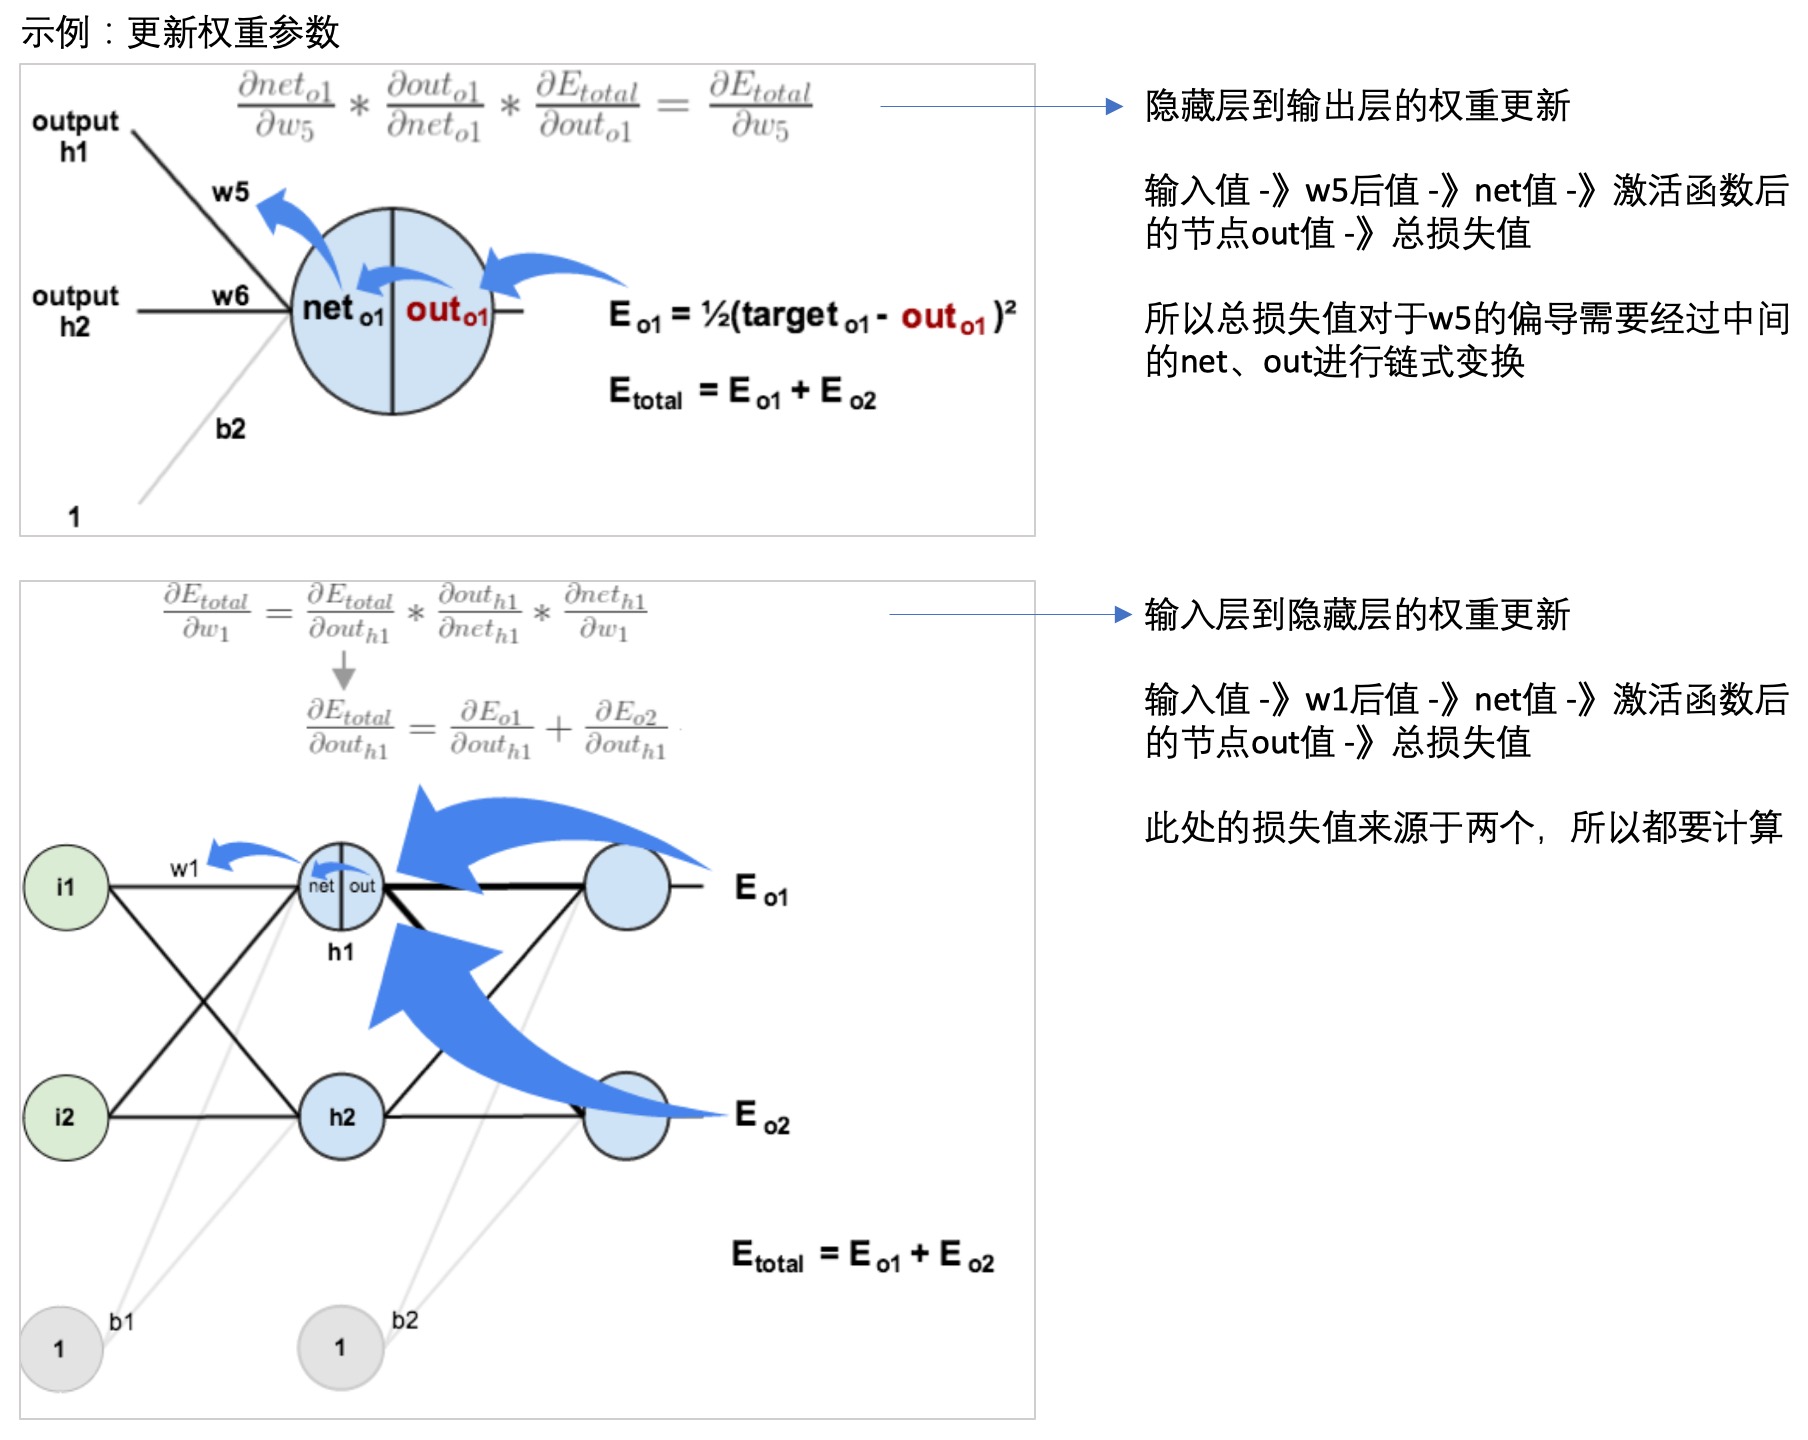
- 神经网络学习:
10: Advice for applying machine learning techniques
- 算法debug:
- 更多的训练样本 =》fix high variance(underfit)
- 减少特征数量 =》fix high variance
- 获得额外的特征 =》fix high bias(overfit)
- 增加高维(组合)特征 =》fix high bias
- 增大 lambda =》fix high bias
- 减小 lambda =》fix high variance
- 机器学习诊断:
- 算法在什么样问题是work的或者不work的
- 需要耗时构建
- 指导提高模型的性能
- 模型评估:
- 训练集效果好(错误低),但是不能很好的在新数据集上。可能存在过拟合,低维(二维)可以直接画,但是对于多维数据不合适。
- 分训练集和测试集,训练集构造模型,在测试集上预测,评估模型效果。
- 模型选择:
- 对于不同的模型,构建训练集+验证集+测试集,前两者用于构建模型,测试集计算错误评估效果
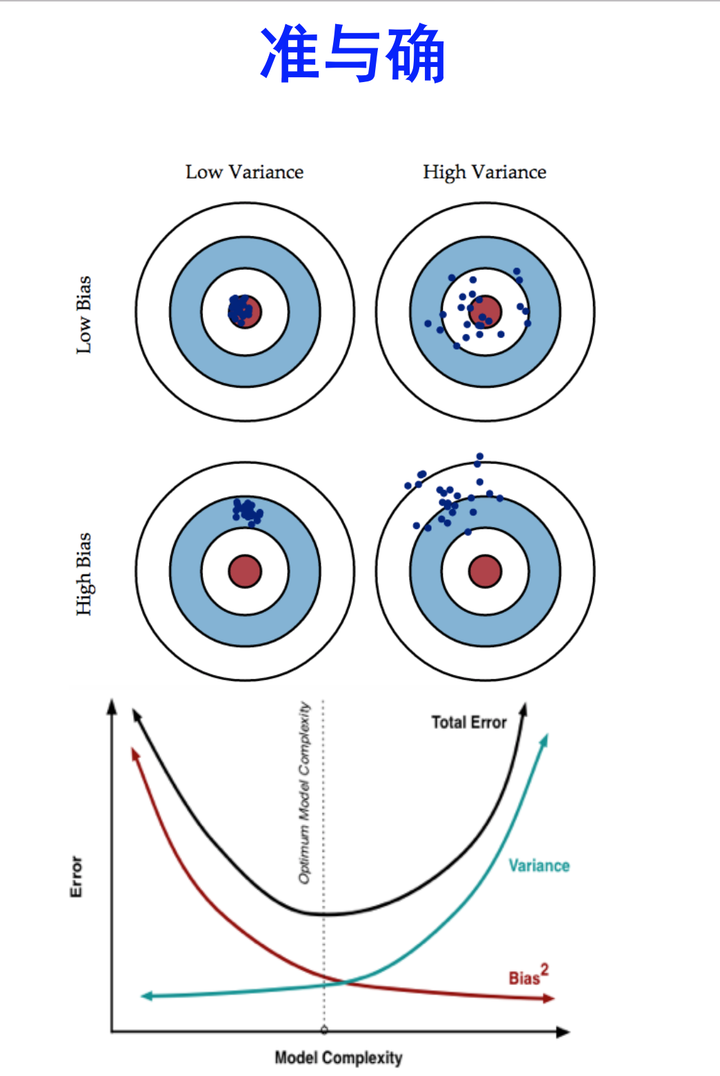
- 模型高偏差(bias)还是高差异(variance):
- high bias:underfit,比如在训练集和验证集上错误都很高,且两者很接近。
- high variance:overfit,比如在训练集上错误很低,但是在验证集上错误很高。
- 正则化与bias、variance:
- 正则化参数:lambda(平衡模型的性能和复杂度)
- 小的lambda,模型很复杂,可能会overfit,high variance
- 大的lambda,效果不很好,可能是underfit,high bias
- 选择不同的lambda值,起到正则化的效果,控制模型的复杂度。用训练集、验证集和测试集的错误值,选取合适的lambda值。
- 学习曲线(learning curve):
- 根据学习曲线判断如何提高模型的效果
- 学习曲线: 样本数量 vs 模型在训练集和验证集上的错误(error)
- 如果是模型high bias(underfit),训练集的误差随样本量增大逐渐增大到平稳,验证集的误差随样本量增大逐渐减小到平稳。【用更多的训练数据不会提升效果】
- 如果模型是high variance(overfit),【用更多的训练数据会提升效果】
- 神经网络和过拟合:
- 小网络:少的参数,容易欠拟合
- 大网络:多的参数,容易过拟合(模型太复杂,不易推广到新的数据)
- 大网络的过拟合可解决方式:正则化
- 知乎:Bias(偏差),Error(误差),和Variance(方差):
11: Machine Learning System Design
- 垃圾邮件检测:
- 监督学习:单词作为特征
- 收集数据,email头信息提取特征,正文信息提取特征,错误拼写检测
- 误差分析:
- 实现简单模型,测试在验证数据集上的效果
- 画学习曲线,看数据量、增添特征能否提升模型性能
- 误差分析:focus那些预测错误的样本,看是否有什么明显的趋势或者共同特征?
- 分析需要在验证数据集上,不是测试集上
- skewd class的误差分析:
- precision: # true positive / # predicted positive = # true positive / (# true positive + # false positive)
- recall: # true positive / # actual positive = # true positive / (# true positive + # false negative)
- F1 score = 2 * (Precision * Recall) / (Precision + Recall)
- 在验证数据集上,计算F1 score,并使其最大化,对应于模型效果最佳
- large data rationale: 可以构建有更多参数的模型
12: Support Vector Machines
13: Clustering
14: Dimensionality Reduction
15: Anomaly Detection
- 异常检测:主要用于非监督学习问题。根据很多样本及其特征,鉴定可能异常的样本,比如产品出厂前进行质量控制测试(QA)。
- 对于给定的正常数据集,想知道一个新的数据是不是异常的,即这个测试数据不属于该组数据的几率,比如在某个范围内概率很大(正常样本),范围之外的几率很小(异常样本),这种属于密度估计。
- 高斯分布:常见的一个分布,刻画特征的情况:
- 两个参数:期望和方差
- 利用高斯分布进行异常检测:
- 对于给定数据集,对每一个特征计算高斯分布的期望和方差(知道了每个特征的密度分布函数)
- 对新数据集,基于所有特征的密度分布,计算属于此数据集的概率
- 当计算的P小于ε时,为异常。(这个ε怎么定?)
- 开发和评估:
- 异常检测系统,先从带标记的数据选取部分构建训练集,获得概率分布模型;然后用剩下的正样本和异常数据构建交叉检验集和测试集。
- 测试集:估计每个特征的平均值和方差,构建概率计算函数
- 检验集:使用不同的ε作为阈值,看模型的效果。主要用来确定模型的效果,具体就是ε值大小。
- 测试集:用选定的ε阈值,针对测试集,计算异常检验系统的F1值等。
- 注意1:数据。训练集只有正常样本(label为0),但是为了评估系统性能,需要异常样本(label为1)。所以需要一批label的样本。
- 注意2:评估。正负样本严重不均衡,不能使用简单的错误率来评估(skewed class),需要用precision、recal、F-measure等度量。
- 异常检测 vs 监督学习:
- 数据量:前者负样本(异常的)很多
- 数据分布:异常检测的负样本(正常样本)分布很均匀,认为服从高斯分布,但是正样本是各种各样的(不正常的各有各的奇葩之处)
- 模型训练:鉴于异常样本的数量少,且不均匀,所以不能用于算法学习。所以异常样本:不参与训练,没有参与高斯模型拟合,只是在验证集和测试集中进行模型的评估。
- 特征选择(转换):
- 特征不服从高斯分布,异常检测算法也可以工作
- 最好转换为高斯分布:比如对数函数变换 =》x=log(x+c)
- 比如在某一维度时,某个样本对应的概率处于正常和异常的附近,很可能判断错误,可以通过查看其在其他维度(特征)的信息,以确定其是否异常。
- 误差分析:
- 问题:异常的数据有较高的P(x)值,被认为是正常的
- 只看被错误检测为正常的异常样本,看是否需要增加其他的特征,以检测这部分异常
- 多元高斯分布:
- 一般高斯计算P(x): 分别计算每个特征对应的几率然后将其累乘起来
- 多元高斯计算P(x): 构建特征的协方差矩阵,用所有的特征一起来计算
- 问题:一般高斯的判定边界比较大,有时候会把样本中的异常分布判定为正常样本
- 协方差举证对高斯分布的影响:
- 一般高斯 vs 多元高斯:
- 应用多元高斯构建异常检测系统:
- 原始模型 vs 多元高斯模型:
- 以上参考这里的学习笔记
16: Recommender Systems
17: Large Scale Machine Learning
18: Application Example - Photo OCR
19: Course Summary
Read full-text »
sklearn: 模型评估与选择
2018-10-08
目录
交叉验证:评估模型的表现
1. 计算交叉验证的指标(分数等):函数cross_val_score
>>> from sklearn.model_selection import cross_val_score
>>> clf = svm.SVC(kernel='linear', C=1)

# cv=5指重复5次交叉验证,默认每次是5fold
>>> scores = cross_val_score(clf, iris.data, iris.target, cv=5)
>>> scores
array([0.96..., 1.  ..., 0.96..., 0.96..., 1.        ])

# 计算平均得分、95%置信区间
>>> print("Accuracy: %0.2f (+/- %0.2f)" % (scores.mean(), scores.std() * 2))
Accuracy: 0.98 (+/- 0.03)
2. 可通过scoring参数指定计算特定的分数值
>>> from sklearn import metrics
>>> scores = cross_val_score(
...     clf, iris.data, iris.target, cv=5, scoring='f1_macro')
>>> scores
array([0.96..., 1.  ..., 0.96..., 0.96..., 1.        ])
3. 自行设定交叉验证器,更好的控制交叉验证过程
默认的情况下,cross_val_score不能直接指定划分的具体细节(比如训练集测试集的比例,初始化值,重复次数)等,可以自行设定好之后,传给其参数cv,这样能够获得更好的控制:
>>> from sklearn.model_selection import ShuffleSplit
>>> n_samples = iris.data.shape[0]
>>> cv = ShuffleSplit(n_splits=5, test_size=0.3, random_state=0)
>>> cross_val_score(clf, iris.data, iris.target, cv=cv)
array([0.977..., 0.977..., 1.  ..., 0.955..., 1.        ])
4. 获得多个度量值
默认的,cross_val_score只能计算一个类型的分数,要想获得多个度量值,可用函数cross_validate:
>>> from sklearn.model_selection import cross_validate
>>> from sklearn.metrics import recall_score
>>> scoring = ['precision_macro', 'recall_macro']
>>> clf = svm.SVC(kernel='linear', C=1, random_state=0)
>>> scores = cross_validate(clf, iris.data, iris.target, scoring=scoring,
...                         cv=5)

# 默认是运行和打分时间+测试集的指标
>>> sorted(scores.keys())
['fit_time', 'score_time', 'test_precision_macro', 'test_recall_macro']
>>> scores['test_recall_macro']
array([0.96..., 1.  ..., 0.96..., 0.96..., 1.        ])

# 可以指定return_train_score参数,同时返回训练集的度量指标值
>>> scores = cross_validate(clf, iris.data, iris.target, scoring=scoring,
...                         cv=5, return_train_score=True)
>>> sorted(scores.keys())
['fit_time', 'score_time', 'test_prec_macro', 'test_rec_macro',
 'train_prec_macro', 'train_rec_macro']
>>> scores['train_rec_macro']
array([0.97..., 0.97..., 0.99..., 0.98..., 0.98...])
5. 数据切分:k-fold & repeat k-fold
通常使用k-fold对数据进行切分:
>>> import numpy as np
>>> from sklearn.model_selection import KFold

>>> X = ["a", "b", "c", "d"]
>>> kf = KFold(n_splits=2)
>>> for train, test in kf.split(X):
...     print("%s  %s" % (train, test))
[2 3] [0 1]
[0 1] [2 3]
一般k-fold需要重复多次,下面是重复2次2-fold:
>>> import numpy as np
>>> from sklearn.model_selection import RepeatedKFold
>>> X = np.array([[1, 2], [3, 4], [1, 2], [3, 4]])
>>> random_state = 12883823
>>> rkf = RepeatedKFold(n_splits=2, n_repeats=2, random_state=random_state)
>>> for train, test in rkf.split(X):
...     print("%s  %s" % (train, test))
...
[2 3] [0 1]
[0 1] [2 3]
[0 2] [1 3]
[1 3] [0 2]
6. 留一法、留P法 交叉验证
每次一个样本用于测试:
>>> from sklearn.model_selection import LeaveOneOut

>>> X = [1, 2, 3, 4]
>>> loo = LeaveOneOut()
>>> for train, test in loo.split(X):
...     print("%s  %s" % (train, test))
[1 2 3] [0]
[0 2 3] [1]
[0 1 3] [2]
[0 1 2] [3]
每次P个样本用于测试:
>>> from sklearn.model_selection import LeavePOut

>>> X = np.ones(4)
>>> lpo = LeavePOut(p=2)
>>> for train, test in lpo.split(X):
...     print("%s  %s" % (train, test))
[2 3] [0 1]
[1 3] [0 2]
[1 2] [0 3]
[0 3] [1 2]
[0 2] [1 3]
[0 1] [2 3]
作为一般规则,大多数作者和经验证据表明, 5- 或者 10- 交叉验证应该优于 留一法交叉验证。
7. 随机排列交叉验证
函数ShuffleSplit,先将样本打散,再换分为一对训练测试集合,这也是上面的3. 自行设定交叉验证器,更好的控制交叉验证过程提到的,更好的控制交叉验证所用到的函数:
>>> from sklearn.model_selection import ShuffleSplit
>>> X = np.arange(5)
>>> ss = ShuffleSplit(n_splits=3, test_size=0.25,
...     random_state=0)
>>> for train_index, test_index in ss.split(X):
...     print("%s  %s" % (train_index, test_index))
...
[1 3 4] [2 0]
[1 4 3] [0 2]
[4 0 2] [1 3]
8. 具有标签的分层交叉验证
分层k-fold:每个fold里面,各类别样本比例大致相当:
>>> from sklearn.model_selection import StratifiedKFold

>>> X = np.ones(10)
>>> y = [0, 0, 0, 0, 1, 1, 1, 1, 1, 1]
>>> skf = StratifiedKFold(n_splits=3)
>>> for train, test in skf.split(X, y):
...     print("%s  %s" % (train, test))
[2 3 6 7 8 9] [0 1 4 5]
[0 1 3 4 5 8 9] [2 6 7]
[0 1 2 4 5 6 7] [3 8 9]
9. 分组数据的交叉验证
分组k-fold:同一组在测试和训练中不被同时表示,某一个组的数据,要么出现在训练集,要么出现在测试集:
>>> from sklearn.model_selection import GroupKFold

>>> X = [0.1, 0.2, 2.2, 2.4, 2.3, 4.55, 5.8, 8.8, 9, 10]
>>> y = ["a", "b", "b", "b", "c", "c", "c", "d", "d", "d"]
>>> groups = [1, 1, 1, 2, 2, 2, 3, 3, 3, 3]

>>> gkf = GroupKFold(n_splits=3)
>>> for train, test in gkf.split(X, y, groups=groups):
...     print("%s  %s" % (train, test))
[0 1 2 3 4 5] [6 7 8 9]
[0 1 2 6 7 8 9] [3 4 5]
[3 4 5 6 7 8 9] [0 1 2]
分组:留一组
>>> from sklearn.model_selection import LeaveOneGroupOut

>>> X = [1, 5, 10, 50, 60, 70, 80]
>>> y = [0, 1, 1, 2, 2, 2, 2]
>>> groups = [1, 1, 2, 2, 3, 3, 3]
>>> logo = LeaveOneGroupOut()
>>> for train, test in logo.split(X, y, groups=groups):
...     print("%s  %s" % (train, test))
[2 3 4 5 6] [0 1]
[0 1 4 5 6] [2 3]
[0 1 2 3] [4 5 6]
分组:留P组:
>>> from sklearn.model_selection import LeavePGroupsOut

>>> X = np.arange(6)
>>> y = [1, 1, 1, 2, 2, 2]
>>> groups = [1, 1, 2, 2, 3, 3]
>>> lpgo = LeavePGroupsOut(n_groups=2)
>>> for train, test in lpgo.split(X, y, groups=groups):
...     print("%s  %s" % (train, test))
[4 5] [0 1 2 3]
[2 3] [0 1 4 5]
[0 1] [2 3 4 5]
10. 时间序列分割
>>> from sklearn.model_selection import TimeSeriesSplit

>>> X = np.array([[1, 2], [3, 4], [1, 2], [3, 4], [1, 2], [3, 4]])
>>> y = np.array([1, 2, 3, 4, 5, 6])
>>> tscv = TimeSeriesSplit(n_splits=3)
>>> print(tscv)
TimeSeriesSplit(max_train_size=None, n_splits=3)
>>> for train, test in tscv.split(X):
...     print("%s  %s" % (train, test))
[0 1 2] [3]
[0 1 2 3] [4]
[0 1 2 3 4] [5]
超参数调整
1. 参数 vs 超参数
参考:手把手教你区分参数和超参数 其原英文版, 超参数优化
- 参数(model parameter):模型参数是模型内部的配置变量,其值可以根据数据进行估计。
- 模型在进行预测时需要它们。
- 它们的值定义了可使用的模型。
- 他们是从数据估计或获悉的。
- 它们通常不由编程者手动设置。
- 他们通常被保存为学习模型的一部分。
-
会随着训练进行更新,以优化从而减小损失函数值。
- 示例:
- 神经网络中的权重。
- 支持向量机中的支持向量。
- 线性回归或逻辑回归中的系数。
- 超参数(model hyperparameter):模型超参数是模型外部的配置,其值无法从数据中估计,一般是手动设置的,并且在过程中用于帮助估计模型参数。
- 它们通常用于帮助估计模型参数。
- 它们通常由人工指定。
- 他们通常可以使用启发式设置。
- 他们经常被调整为给定的预测建模问题。
- 不直接参与到训练过程,属于配置变量,往往是恒定的。
-
一般我们都是通过观察在训练过程中的监测指标如损失函数的值或者测试/验证集上的准确率来判断这个模型的训练状态,并通过修改超参数来提高模型效率。
- 示例:
- 训练神经网络的学习速率、优化器、迭代次数、激活函数等。
- 用于支持向量机的C和sigma超参数。
- K最近邻的K。
2. 超参数优化
构造估计器时被提供的任何参数或许都能被优化,搜索包括:
- 估计器(回归器或分类器,例如 sklearn.svm.SVC())
- 参数空间
- 搜寻或采样候选的方法
- 交叉验证方案
- 计分函数
3. 超参数优化:网格搜索
网格搜索函数:GridSearchCV,候选参数通过参数param_grid传入,参数值的所有可能组合都会被评估,以估计最佳组合。下面是文本特征提取的例子:
# 设定不同的pipeline
pipeline = Pipeline([
    ('vect', CountVectorizer()),
    ('tfidf', TfidfTransformer()),
    ('clf', SGDClassifier(tol=1e-3)),
])

# 设定要搜索的参数及值空间
parameters = {
    'vect__max_df': (0.5, 0.75, 1.0),
    # 'vect__max_features': (None, 5000, 10000, 50000),
    'vect__ngram_range': ((1, 1), (1, 2)),  # unigrams or bigrams
    # 'tfidf__use_idf': (True, False),
    # 'tfidf__norm': ('l1', 'l2'),
    'clf__max_iter': (20,),
    'clf__alpha': (0.00001, 0.000001),
    'clf__penalty': ('l2', 'elasticnet'),
    # 'clf__max_iter': (10, 50, 80),
}

if __name__ == "__main__":
    # find the best parameters for both the feature extraction and the classifier
    grid_search = GridSearchCV(pipeline, parameters, cv=5,
                               n_jobs=-1, verbose=1)
4. 超参数优化:随机参数优化
随机参数优化: - 实现了参数的随机搜索 - 从可能的参数值的分布中进行取样 - 可以选择独立于参数个数和可能值的预算 - 添加不影响性能的参数不会降低效率
# specify parameters and distributions to sample from
param_dist = {"max_depth": [3, None],
              "max_features": sp_randint(1, 11),
              "min_samples_split": sp_randint(2, 11),
              "bootstrap": [True, False],
              "criterion": ["gini", "entropy"]}

# run randomized search
n_iter_search = 20
random_search = RandomizedSearchCV(clf, param_distributions=param_dist,
                                   n_iter=n_iter_search, cv=5, iid=False)
5. 超参数搜索技巧
-
指定目标量度:可以使用不同的度量参数进行评估
-
指定多个指标:上面的网格搜索和随机搜索均允许指定多个评分指标
X, y = make_hastie_10_2(n_samples=8000, random_state=42)

scoring = {'AUC': 'roc_auc', 'Accuracy': make_scorer(accuracy_score)}

gs = GridSearchCV(DecisionTreeClassifier(random_state=42),
                  param_grid={'min_samples_split': range(2, 403, 10)},
                  scoring=scoring, cv=5, refit='AUC', return_train_score=True)
gs.fit(X, y)
results = gs.cv_results_
-
模型选择:开发和评估,评估时在hold-out数据集上进行
-
并发机制:参数设定
n_jobs=-1即可使得计算并行进行
6. 暴力搜索的替代
有一些优化的参数搜索方案被开发出来,比如:linear_model.ElasticNetCV, linear_model.LassoCV
量化模型预测质量
1. sklearn提供3种方法
- 估计器得分的方法(Estimator score method)
- 评分参数(Scoring parameter)
- 指标函数(Metric functions):
metrics模块实现了针对特定目的评估预测误差的函数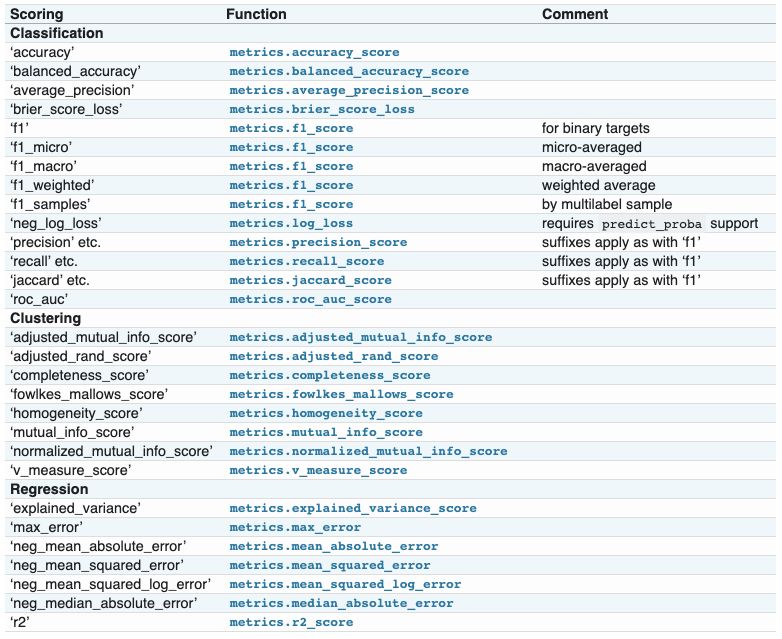
2. 评分参数(Scoring parameter): 分类、聚类、回归
在评估模型的效果时,可以指定特定的评分策略,通过参数scoring进行指定:
>>> from sklearn import svm, datasets
>>> from sklearn.model_selection import cross_val_score
>>> iris = datasets.load_iris()
>>> X, y = iris.data, iris.target
>>> clf = svm.SVC(probability=True, random_state=0)
>>> cross_val_score(clf, X, y, scoring='neg_log_loss')
array([-0.07..., -0.16..., -0.06...])
>>> model = svm.SVC()
>>> cross_val_score(model, X, y, scoring='wrong_choice')
3. 使用metric函数定义评分策略
sklearn.metrics模块可提供评估预测分数或者误差_score:预测分数值,越大越好_error,_loss:损失值,越小越好- 为什么不在上面的
scoring策略中指定?这些评价函数需要额外的参数,不是直接指定一个评估名称字符即可的!
4. metric函数:现有函数的非默认参数指定
需要调用make_scorer函数把评估的量值变成一个打分对象(scoring object):
>>> from sklearn.metrics import fbeta_score, make_scorer
>>> ftwo_scorer = make_scorer(fbeta_score, beta=2)
>>> from sklearn.model_selection import GridSearchCV
>>> from sklearn.svm import LinearSVC
>>> grid = GridSearchCV(LinearSVC(), param_grid={'C': [1, 10]}, scoring=ftwo_scorer)
5. metric函数:构建全新的自定义打分函数
>>> import numpy as np
>>> def my_custom_loss_func(y_true, y_pred):
...     diff = np.abs(y_true - y_pred).max()
...     return np.log1p(diff)

>>> score = make_scorer(my_custom_loss_func, greater_is_better=False)
>>> X = [[1], [1]]
>>> y = [0, 1]
>>> from sklearn.dummy import DummyClassifier
>>> clf = DummyClassifier(strategy='most_frequent', random_state=0)
>>> clf = clf.fit(X, y)
>>> my_custom_loss_func(clf.predict(X), y)
0.69...
>>> score(clf, X, y)
-0.69...
6. 指定多个评估参数
在几个函数(GridSearchCV,RandomizedSearchCV,cross_validate)中,均有scoring参数,可以指定多个评估参数,可以通过列表指定名称,也可以通过字典:
>>> scoring = ['accuracy', 'precision']

>>> scoring = {'accuracy': make_scorer(accuracy_score),
...            'prec': 'precision'}

>>> cv_results = cross_validate(svm.fit(X, y), X, y,
...                             scoring=scoring, cv=5)
7. 分类指标
仅二分类:
| Metric | Formule |
|---|---|
| precision_recall_curve | \(precision=\frac{TP}{TP+FP}, recall=\frac{TP}{TP+FN}\) |
| roc_curve | \(FPR=\frac{FP}{FP+TP}, TPR=\frac{TP}{TP+FN}\) |
可用于多分类:
| Metric | Formule |
|---|---|
| cohen_kappa_score | \(\kappa = (p_o - p_e) / (1 - p_e)\) |
| confusion_matrix | By definition a confusion matrix C is such that C_{i, j} is equal to the number of observations known to be in group i but predicted to be in group j.Thus in binary classification, the count of true negatives is C_{0,0}, false negatives is C_{1,0}, true positives is C_{1,1} and false positives is C_{0,1}. |
| hinge_loss(binary) | \(L_\text{Hinge}(y, w) = \max\left\{1 - wy, 0\right\} = \left|1 - wy\right|_+\) |
| hinge_loss(multi) | \(L_\text{Hinge}(y_w, y_t) = \max\left\{1 + y_t - y_w, 0\right\}\) |
| mattews_corrcoef(binary) | \(MCC = \frac{tp \times tn - fp \times fn}{\sqrt{(tp + fp)(tp + fn)(tn + fp)(tn + fn)}}\),马修斯相关系数 |
| mattews_corrcoef(multi) | \(MCC = \frac{c \times s - \sum_{k}^{K} p_k \times t_k}{\sqrt{(s^2 - \sum_{k}^{K} p_k^2) \times (s^2 - \sum_{k}^{K} t_k^2)}}\) |
可用于multilabel case(有多个标签的):
| Metric | Formule |
|---|---|
| accuracy_score | \(\texttt{accuracy}(y, \hat{y}) = \frac{1}{n_\text{samples}} \sum_{i=0}^{n_\text{samples}-1} 1(\hat{y}_i = y_i)\) |
| classfication_report | precision,recall,f1-score,support, accuracy,macro avg,weighted avg |
| f1_score | \(F_1 = \frac{2 \times \text{precision} \times \text{recall}}{ \text{precision} + \text{recall}}\) |
| fbeta_score | \(F_\beta = (1 + \beta^2) \frac{\text{precision} \times \text{recall}}{\beta^2 \text{precision} + \text{recall}}\) |
| hamming_loss | \(L_{Hamming}(y, \hat{y}) = \frac{1}{n_\text{labels}} \sum_{j=0}^{n_\text{labels} - 1} 1(\hat{y}_j \not= y_j)\) |
| jaccard_similarity_score | \(J(y_i, \hat{y}_i) = \frac{|y_i \cap \hat{y}_i|}{|y_i \cup \hat{y}_i|}\) |
| log_loss(binary) | \(L_{\log}(y, p) = -\log \operatorname{Pr}(y|p) \\ = -(y \log (p) + (1 - y) \log (1 - p))\),又被称为 logistic regression loss(logistic 回归损失)或者 cross-entropy loss(交叉熵损失) 定义在 probability estimates (概率估计) |
| log_loss(multi) | \(L_{\log}(Y, P) = -\log \operatorname{Pr}(Y|P) \\ = - \frac{1}{N} \sum_{i=0}^{N-1} \sum_{k=0}^{K-1} y_{i,k} \log p_{i,k}\) |
| precision_recall_fscore_support | Compute precision, recall, F-measure and support for each class |
| recall_score | \(\frac{TP}{TP+FN}\) |
| zero_one_loss | \(L_{0-1}(y_i, \hat{y}_i) = 1(\hat{y}_i \not= y_i)\) |
8. 回归指标
| Metric | Formule |
|---|---|
| explained_variance_score | \(explained\_{}variance(y, \hat{y}) = 1 - \frac{Var\{ y - \hat{y}\}}{Var\{y\}}\) |
| max_error | \(\text{Max Error}(y, \hat{y}) = max(| y_i - \hat{y}_i |)\) |
| mean_absolute_error | \(\text{MAE}(y, \hat{y}) = \frac{1}{n_{\text{samples}}} \sum_{i=0}^{n_{\text{samples}}-1} \left| y_i - \hat{y}_i \right|\) |
| mean_squared_error | \(\text{MSE}(y, \hat{y}) = \frac{1}{n_\text{samples}} \sum_{i=0}^{n_\text{samples} - 1} (y_i - \hat{y}_i)^2.\) |
| mean_squared_log_error | \(\text{MSLE}(y, \hat{y}) = \frac{1}{n_\text{samples}} \sum_{i=0}^{n_\text{samples} - 1} (\log_e (1 + y_i) - \log_e (1 + \hat{y}_i) )^2\) |
| median_absolute_error | \(\text{MedAE}(y, \hat{y}) =\text{median}(\mid y_1 - \hat{y}_1 \mid, \ldots, \mid y_n -\hat{y}_n \mid)\) |
| r2_score | \(R^2(y, \hat{y}) = 1 - \frac{\sum_{i=1}^{n} (y_i - \hat{y}_i)^2}{\sum_{i=1}^{n} (y_i - \bar{y})^2}\) |
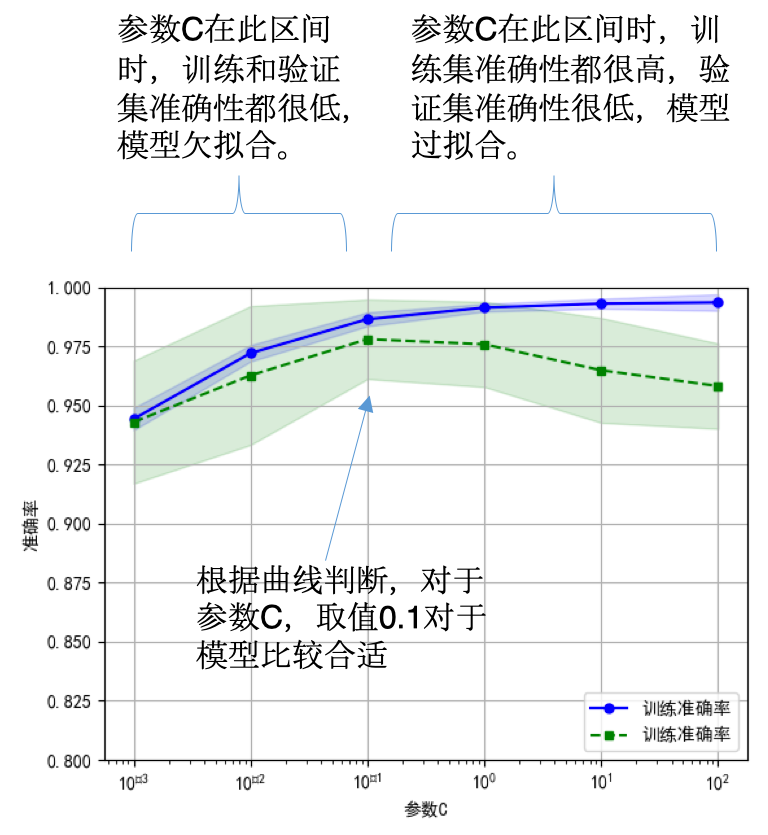
验证曲线与学习曲线
1. 泛化误差=偏差+方差+噪声
- 偏差:不同训练集的平均误差
- 方差:模型对训练集的变化有多敏感
- 噪声:数据的属性
2. 偏差、方差困境
- 1)选择合适的学习算法和超参数【验证曲线】
- 2)使用更多的训练数据【学习曲线】
3. 验证曲线
>>> np.random.seed(0)
>>> iris = load_iris()
>>> X, y = iris.data, iris.target
>>> indices = np.arange(y.shape[0])
>>> np.random.shuffle(indices)
>>> X, y = X[indices], y[indices]

>>> train_scores, valid_scores = validation_curve(Ridge(), X, y, "alpha",
...                                               np.logspace(-7, 3, 3),
...                                               cv=5)
4. 学习曲线
- 训练样本数量和模型性能度量值(比如训练集和验证集的准确率)之间的关系
- 帮助我们发现从增加更多的训 练数据中能获益多少
- 判断模型的偏差和方差
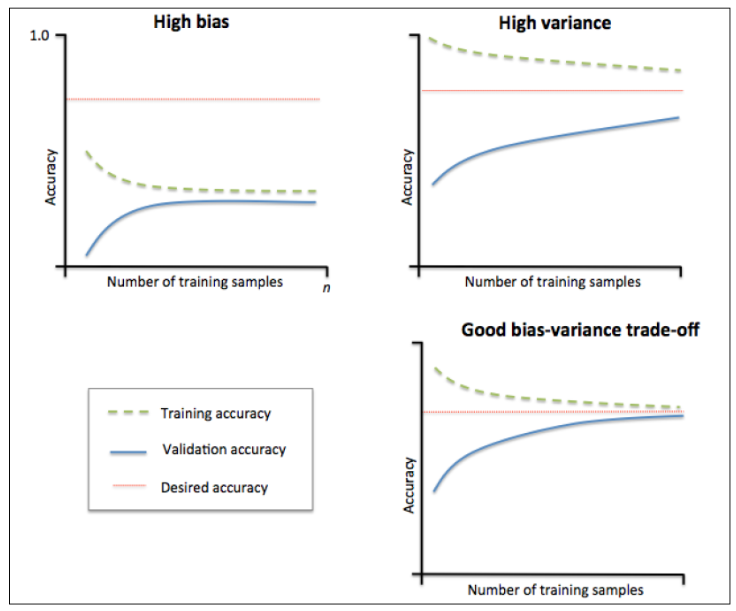
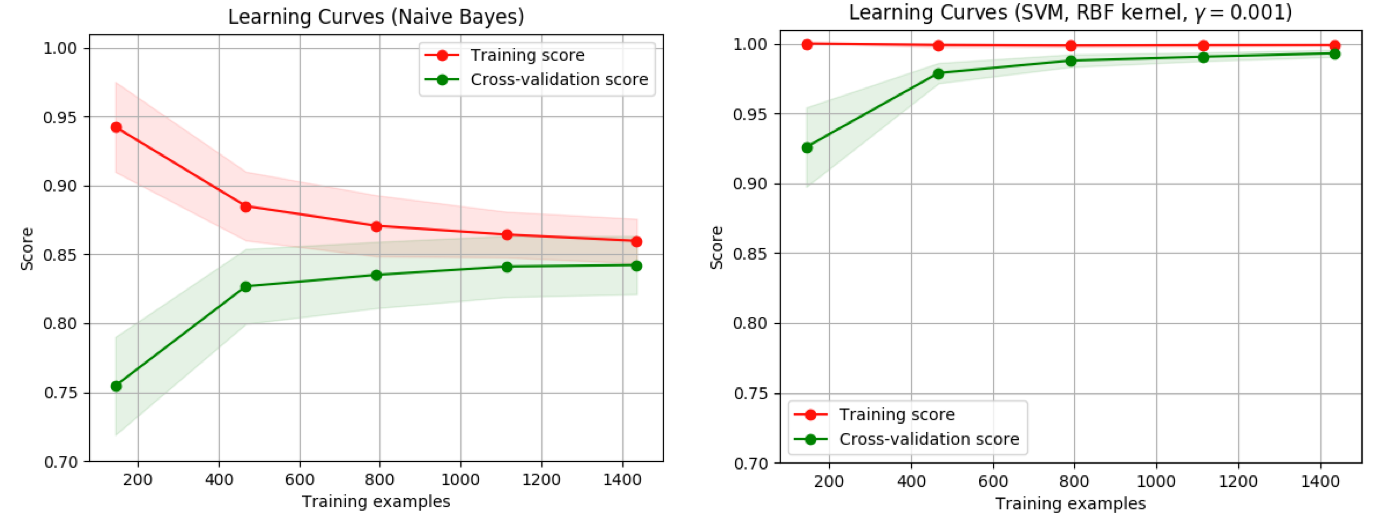
- 不同的曲线可以看出样本对模型性能的影响,比如下面的例子
- 左边的:当增大训练样本数目时,训练集和验证集都收敛于较低的分数,即使再增加样本数量,不会收益
- 右边的:当增加训练样本时,验证分数有很大提高,能够收益于样本数目的增加
>>> from sklearn.model_selection import learning_curve
>>> from sklearn.svm import SVC

>>> train_sizes, train_scores, valid_scores = learning_curve(
...     SVC(kernel='linear'), X, y, train_sizes=[50, 80, 110], cv=5)
>>> train_sizes
array([ 50, 80, 110])
>>> train_scores
array([[0.98..., 0.98 , 0.98..., 0.98..., 0.98...],
       [0.98..., 1.   , 0.98..., 0.98..., 0.98...],
       [0.98..., 1.   , 0.98..., 0.98..., 0.99...]])
>>> valid_scores
array([[1. ,  0.93...,  1. ,  1. ,  0.96...],
       [1. ,  0.96...,  1. ,  1. ,  0.96...],
       [1. ,  0.96...,  1. ,  1. ,  0.96...]])
模型持久化(存储)
可以使用pickle模块操作模型:
- 保存已经训练好的模型:
s = pickle.dumps(clf) - 之后直接导入使用:
clf2 = pickle.loads(s) - 用于新数据的预测:
clf2.predict(X[0:1])
>>> from sklearn import svm
>>> from sklearn import datasets
>>> clf = svm.SVC()
>>> iris = datasets.load_iris()
>>> X, y = iris.data, iris.target
>>> clf.fit(X, y)
SVC(C=1.0, cache_size=200, class_weight=None, coef0=0.0,
 decision_function_shape='ovr', degree=3, gamma='auto', kernel='rbf',
 max_iter=-1, probability=False, random_state=None, shrinking=True,
 tol=0.001, verbose=False)

>>> import pickle
>>> s = pickle.dumps(clf)
>>> clf2 = pickle.loads(s)
>>> clf2.predict(X[0:1])
array([0])
>>> y[0]
0
参考
Read full-text »
模型评估与选择
2018-10-05
目录
经验误差与过拟合
- 错误率(error rate):分类错误的样本数占样本总数。m个样本中有a个分类错误:\(E = \frac{a}{m}\)
- 精度(accuracy):1-错误率,\(1-\frac{a}{m}\)
- 误差(error):模型的实际预测输出与样本的真实输出之间的差异。
- 训练集:训练误差(training error),或经验误差(empirical error)
- 新样本:泛化误差(generalization error)
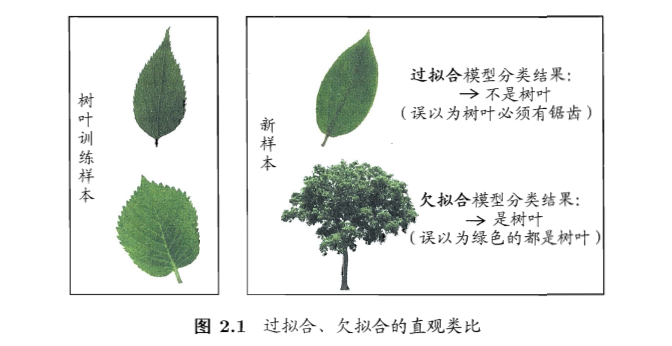
- 过拟合(overfitting):把训练样本学习得太好了,训练样本自身的一些特点当做了所有潜在样本都有的一般性质,泛化性能下降
- 无法彻底避免,只能缓解或者减小风险
- 为啥不可避免?面临的问题通常是NP难,有效算法是在多项式时间内运行完成,如可彻底避免过拟合,意味着构造性的证明“P=NP”,所以不可避免
- 欠拟合(underfitting):对训练样本的一般性质尚未学好
模型评估方法
- 一般用一个测试集测试模型在新样本上的效果,用这个测试误差去近似泛化误差。
- 一个数据集如何训练与测试?
- 留出法(hold-out):
- 数据集D划分为互斥的两个集合,训练集S,测试集T
- S上训练模型,T上测试模型,其测试误差用于近似泛化误差
- 注意:训练、测试集的划分要尽可能保持数据分布的一致性,避免引入额外误差。类似于分层采样(stratified sampling):保持样本的类别比例。
- 注意:需要若干次随机划分、重复进行实验,以多次结果的平均值作为留出法的结果。
- 问题:希望评估数据集D(所有数据)训练出的模型。S大T小,则评估结果不够稳定准确;S小T大,则训练的模型与真实的存在大的差别,降低了保真性(fidelity)。
- 常见做法:约2/3-4/5用于训练,其余用于测试
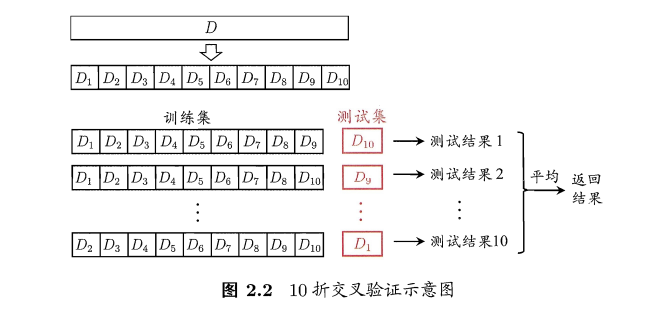
- 交叉验证法(cross validation):
- 自助法(bootstrapping):
- 留出法、交叉验证:样本规模不一样导致的估计偏差
-
留一法:计算复杂度太高
- 基于自助采样(bootstrap sampling):每次随机挑选一个,放回再随机抽取,重复m次,获得和样本数目相同的抽样样本。
- 有的样本出现多次,有的一次不出现。
- 样本在m次抽样中始终不被采到的概率:\((1 - \frac{1}{m})^m\),对其求取极限:\(=\frac{1}{e}=0.368\),即约有36.8%的样本未出现在采样集合中。
- 训练集:抽样样本,测试集:总体样本-抽样样本
- 约1/3没有用于测试,称为包外估计(out-of-bag estimate)
- 应用场景:数据集小、难以有效区分训练/测试集时;生成多个不同训练集,利于集成学习。在数据量足够时,留出法和交叉验证更常用。
- 改变了初始数据集分布,会引入估计偏差
- 调参与最终模型:
- 选择算法
- 对算法参数进行设定:参数调节(parameter tuning)
- 通常:每个参数选定范围和变化步长
模型性能度量
- 性能度量(performance measure):评价泛化能力
- 错误率和精度:上面已经介绍了
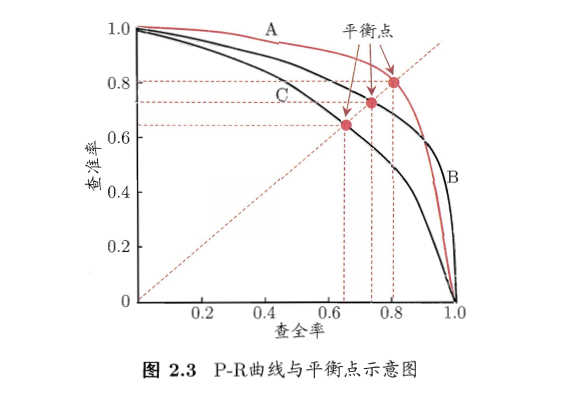
- 准确率(查准率,precision):\(P = \frac{TP}{TP+FP}\)
- 召回率(查全率,recall):\(R = \frac{TP}{TP+FN}\)
- 基于准确率和召回率的PR曲线:
- F1度量:
- F1 score: \(F1 = \frac{2 \times P \times R}{P + R} = \frac{2 \times TP}{样本总数 + TP - TN}\)
- 不同情形下,对准确率和召回率重视程度不同,所以F1有更一般的形式:\(F_\beta = \frac{(1+\beta^2) \times P \times R}{(\beta^2 \times P) + R}\)。\(\beta=1\),标准的F1;\(\beta>1\),召回率更大影响;\(\beta<1\),准确率更大影响。
- n个混淆矩阵上综合考察准确率和召回率:
- 1)宏版本:
- 在各混淆矩阵上分别计算出准确率和召回率:(P1,R1),(P2,R2),…,(Pn,Rn),再计算平均值,得到:
- 宏准确率:\(macro-P = \frac{1}{n}\sum_{i=1}^{n}P_i\)
- 宏召回率:\(macro-R = \frac{1}{n}\sum_{i=1}^{n}R_i\)
-
宏F1:\(macro-F1 = \frac{2 \times macro-P \times macro-R}{macro-P + macro-R}\)
- 2)微版本:
- 将各混淆矩阵的对应元素进行平均,得到TP、FP、TN、FN的平均值:\(\overline{TP}, \overline{FP}, \overline{TN}, \overline{FN},\),再基于平均值计算,得到:
- 微准确率:\(micro-P = \frac{\overline{TP}}{\overline{TP} + \overline{FP}}\)
- 微召回率:\(micro-R = \frac{\overline{TP}}{\overline{TP} + \overline{FN}}\)
- 微F1:\(micro-F1 = \frac{2 \times micro-P \times micro-R}{micro-P + micro-R}\)
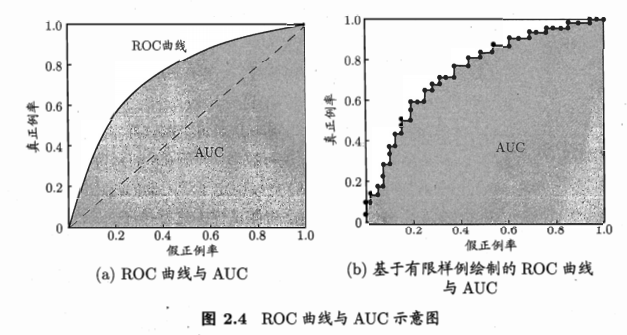
- ROC & AUC:
- 模型:很多情况是预测一个实数概率值,与给定阈值进行比较,高则预测为正,低则预测为负。例子:神经网络,输出值与0.5比较
- 根据测试排序,最前面则最可能是正,后面的最可能为负。排序质量的好坏,体现了泛化性能的好坏。
- ROC(receiver operating characteristic,受试者工作特征)曲线:源于二战敌机雷达信号检测。基于预测结果进行排序,逐个把样本作为正例进行预测,计算两个量值,作为曲线的横纵坐标。
- 纵轴:真正例率(True positive rate,TPR),\(TPR = \frac{TP}{TP+FN}\)
- 横轴:假正例率(False positive rate,FPR),\(FPR = \frac{FP}{TN+FP}\)
- AUC:曲线下面积,近似计算如下,\(AUC=\frac{1}{2}\sum_{i=1}^{m-1}(x_{i+1}-x_i)(y_i+y_{i+1})\)
偏差与方差
- 解释泛化性能:
- 上面是估计的模型的泛化性能
- 为什么是这样的性能?解释:偏差-方差分解(bias-variance decomposition)
- 偏差-方差分解:
- 对学习算法的期望泛化错误率进行拆解
- 例子:回归,
- \[测试样本x\]
- \[y_D为x在数据集中的标记\]
- \[y为x的真实标记\]
- \[f(x;D)为训练D上学习的模型f在x上的预测输出\]
- 算法期望预测:\(\overline{f}(x)=E_D[f(x;D)]\)
- 方差:\(var(x)=E_D[(f(x;D)-\overline{f}(x))^2]\),同样大小的训练集的变动所导致的学习性能的变化,刻画了数据扰动所造成的影响。
- 噪声:\(\epsilon^2=E_D[(y_D-y)^2]\),当前任务上任何学习算法所能达到的期望泛化误差的下界,刻画了学习问题本身的难度。
- 偏差(bias):\(bias^2(x)=(\overline{f}(x)-y)^2\),期望输出与真实标记的差别,学习算法的期望预测与真实结果的偏离程度,刻画了算法本身的拟合能力。
-
期望泛化误差分解:\(E(f;D)=E_D[(f(x;D)-\overline{f}(x))^2] + (\overline{f}(x)-y)^2 + E_D[(y_D-y)^2]=var(x) + bias^2(x) + \epsilon^2\),即为方差、偏差、噪声之和。
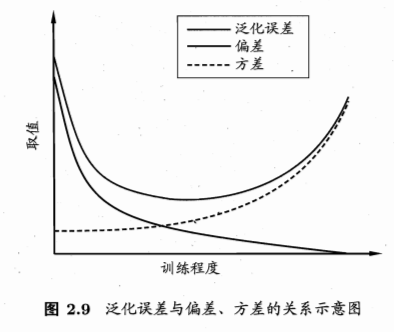
- 偏差-方差窘境(bias-variance dilemma):偏差与方差的冲突
- 训练不足:拟合能力弱,训练数据的扰动不影响结果,偏差主导泛化错误率
- 训练充足:拟合能力强,训练数据的轻微扰动被学习到,学习模型发生显著变化,过拟合,方差主导泛化错误率
参考
Read full-text »
sklearn: 缺失值插补
2018-09-30
目录
1. 缺失值
- 真实的数据集包含缺失数据
- 缺失数据编码:空格,NaN,或其他占位符
- 使用含有缺失值数据基本策略:舍弃含有缺失值的行或者列。弊端:舍弃了可能有价值的(不完整的)数据。
-
更好的策略:从已有的数据进行推断,从而进行缺失数据填充(imputation)。
- 下面的表是现有的缺失值处理的方法的总结:
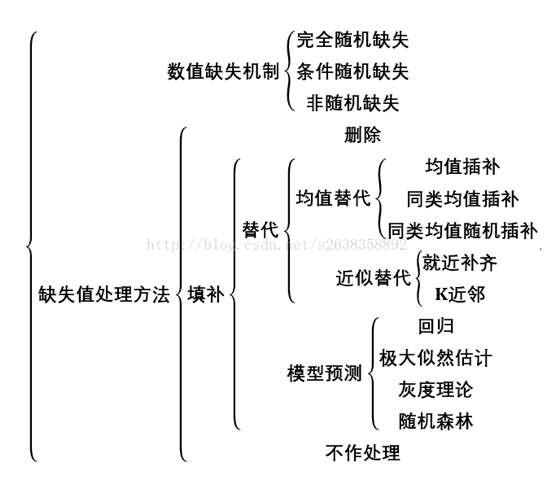
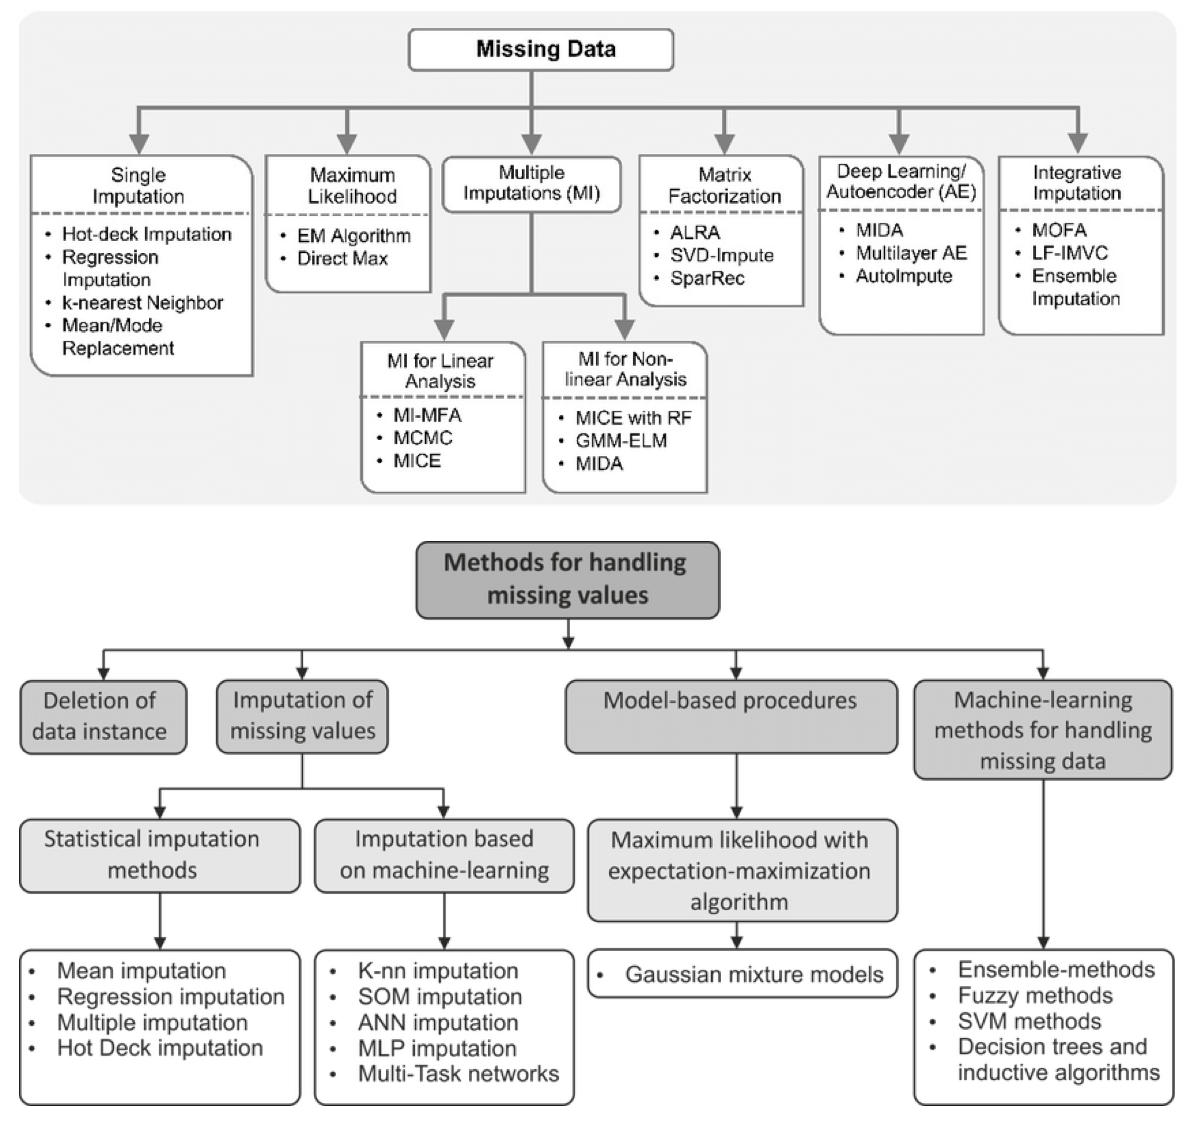
2. 插补方法:单变量 vs 多变量
- 单变量:值使用第
i个特征维度中的非缺失值来插补这个特征中的缺失值。类函数:impute.SimpleImputer - 多变量:使用整个可用特征维度来估计缺失值。类函数:
impute.IterativeImputer
3. 单变量插补
- 类函数:
impute.SimpleImputer - 可提供常数进行插补
- 可使用缺失特征列的统计量进行插补,比如平均值、中位数、众数
- 支持不同的缺失编码:比如数值型、字符型
>>> import numpy as np
>>> from sklearn.preprocessing import Imputer

# 使用特征列平均值插补
>>> imp = Imputer(missing_values='NaN', strategy='mean', axis=0)
>>> imp.fit([[1, 2], [np.nan, 3], [7, 6]])
Imputer(axis=0, copy=True, missing_values='NaN', strategy='mean', verbose=0)
>>> X = [[np.nan, 2], [6, np.nan], [7, 6]]
>>> print(imp.transform(X))
[[ 4.          2.        ]
 [ 6.          3.666...]
 [ 7.          6.        ]]

# 对分类数据,使用频率进行插补
>>> df = pd.DataFrame([["a", "x"],
...                    [np.nan, "y"],
...                    ["a", np.nan],
...                    ["b", "y"]], dtype="category")
...
>>> imp = SimpleImputer(strategy="most_frequent")
>>> print(imp.fit_transform(df))
[['a' 'x']
 ['a' 'y']
 ['a' 'y']
 ['b' 'y']]
4. 多变量插补
- 类函数:
IterativeImputer - 原理:将每个缺失值的特征建模为其他特征的函数,建立好关系模型之后就可以对缺失的值进行估计。
- 具体步骤:每一轮,其他特征列为X(如果其他特征也含有缺失值,怎么使用?),缺失值包含列为输出y,使用回归器在未缺失数据上拟合,然后使用拟合模型对缺失的y值进行预测。迭代的方式对每个特征进行,重复
max_iter轮,最后一轮的计算结果被返回。
>>> import numpy as np
>>> from sklearn.experimental import enable_iterative_imputer
>>> from sklearn.impute import IterativeImputer
>>> imp = IterativeImputer(max_iter=10, random_state=0)
>>> imp.fit([[1, 2], [3, 6], [4, 8], [np.nan, 3], [7, np.nan]])
IterativeImputer(add_indicator=False, estimator=None,
                 imputation_order='ascending', initial_strategy='mean',
                 max_iter=10, max_value=None, min_value=None,
                 missing_values=nan, n_nearest_features=None,
                 random_state=0, sample_posterior=False, tol=0.001,
                 verbose=0)
>>> X_test = [[np.nan, 2], [6, np.nan], [np.nan, 6]]
>>> # the model learns that the second feature is double the first
>>> print(np.round(imp.transform(X_test)))
[[ 1.  2.]
 [ 6. 12.]
 [ 3.  6.]]
5. 缺失值标记
- 有时需要找到数据集中的缺失值
- 转换器:
MissingIndicator,将数据集转换为矩阵,可指示缺失值的存在 - 通常
NaN是占位符,可指定其他值为占位符
>>> from sklearn.impute import MissingIndicator
>>> X = np.array([[-1, -1, 1, 3],
...               [4, -1, 0, -1],
...               [8, -1, 1, 0]])

# 指定-1为缺失值
# 默认只返回包含缺失值的列,所以这里值显示了3列
>>> indicator = MissingIndicator(missing_values=-1)
>>> mask_missing_values_only = indicator.fit_transform(X)
>>> indicator.features_
array([0, 1, 3])

>>> mask_missing_values_only
array([[ True,  True, False],
       [False,  True,  True],
       [False,  True, False]])

# 设置参数 features="all"可以把其他的列的数据也指示出来
# 这种做法通常是我们想要的
>>> indicator = MissingIndicator(missing_values=-1, features="all")
>>> mask_all = indicator.fit_transform(X)
>>> mask_all
array([[ True,  True, False, False],
       [False,  True, False,  True],
       [False,  True, False, False]])
>>> indicator.features_
array([0, 1, 2, 3])
- 创建FeatureUnion,是的分类器能够处理数据
>>> transformer = FeatureUnion(
...     transformer_list=[
...         ('features', SimpleImputer(strategy='mean')),
...         ('indicators', MissingIndicator())])
>>> transformer = transformer.fit(X_train, y_train)
>>> results = transformer.transform(X_test)
>>> results.shape
(100, 8)

# 使用pipeline,把特征转换放在模型之前
# 这样就会对数据先进行转换,再fitting
>>> clf = make_pipeline(transformer, DecisionTreeClassifier())
>>> clf = clf.fit(X_train, y_train)
>>> results = clf.predict(X_test)
>>> results.shape
(100,)
参考
- 缺失值插补@sklearn 中文
- 缺失值处理方法
- Machine learning with missing data
- Summary of methods for handling missing values in data instances
Read full-text »
sklearn: 数据预处理2
2018-09-27
数据预处理
关于数据的预处理,sklearn提供了一个专门的模块
sklearn.preprocessing,可用于常规的预处理操作,详情可参见这里(英文,中文)。
标准化(standardization)或去均值(mean removal)和方差按比例缩放(variance scaling)
a. 为什么?
- 常见要求
- 如果特征不是(不像)标准正太分布(0均值和单位方差),表现可能较差
- 目标函数:假设所有特征都是0均值并且具有同一阶数上的方差。如果某个特征的方差比其他特征大几个数量级,则会占据主导地位
b. 函数scale:数组的标准化
from sklearn import preprocessing
import numpy as np
X_train = np.array([[ 1., -1.,  2.],
                    [ 2.,  0.,  0.],
                    [ 0.,  1., -1.]])
X_scaled = preprocessing.scale(X_train)

X_scaled
# array([[ 0.  ..., -1.22...,  1.33...],
#       [ 1.22...,  0.  ..., -0.26...],
#       [-1.22...,  1.22..., -1.06...]])

# 缩放后的数据具有零均值以及标准方差
X_scaled.mean(axis=0)
# array([0., 0., 0.])

X_scaled.std(axis=0)
# array([1., 1., 1.])
c. 类StandardScaler:
- 在训练集上计算平均值和标准偏差
- 可在测试集上直接使用相同变换
- 适用于pipeline的早起构建
scaler = preprocessing.StandardScaler().fit(X_train)
scaler
# StandardScaler(copy=True, with_mean=True, with_std=True)

scaler.mean_
# array([1. ..., 0. ..., 0.33...])

scaler.scale_
# array([0.81..., 0.81..., 1.24...])

scaler.transform(X_train)
# array([[ 0.  ..., -1.22...,  1.33...],
#       [ 1.22...,  0.  ..., -0.26...],
#       [-1.22...,  1.22..., -1.06...]])
- 在训练集计算的缩放直接应用于测试集:
X_test = [[-1., 1., 0.]]
scaler.transform(X_test)
# array([[-2.44...,  1.22..., -0.26...]])
d. 将特征缩放至特定范围
- 给定的最大、最小值之间,通常[0,1]
- 类
MinMaxScaler
X_train = np.array([[ 1., -1.,  2.],
                    [ 2.,  0.,  0.],
                    [ 0.,  1., -1.]])

min_max_scaler = preprocessing.MinMaxScaler()
X_train_minmax = min_max_scaler.fit_transform(X_train)
X_train_minmax
# array([[0.5       , 0.        , 1.        ],
#       [1.        , 0.5       , 0.33333333],
#       [0.        , 1.        , 0.        ]])

# 应用于测试集
X_test = np.array([[ -3., -1.,  4.]])
X_test_minmax = min_max_scaler.transform(X_test)
X_test_minmax
# array([[-1.5       ,  0.        ,  1.66666667]])
- 每个特征的最大绝对值转换为单位大小
- 除以每个特征的最大值,转换为[-1,1]之间
- 类
MaxAbsScaler
X_train = np.array([[ 1., -1.,  2.],
                    [ 2.,  0.,  0.],
                    [ 0.,  1., -1.]])

max_abs_scaler = preprocessing.MaxAbsScaler()
X_train_maxabs = max_abs_scaler.fit_transform(X_train)
X_train_maxabs                # doctest +NORMALIZE_WHITESPACE^
# array([[ 0.5, -1. ,  1. ],
#       [ 1. ,  0. ,  0. ],
#       [ 0. ,  1. , -0.5]])


X_test = np.array([[ -3., -1.,  4.]])
X_test_maxabs = max_abs_scaler.transform(X_test)
X_test_maxabs
# array([[-1.5, -1. ,  2. ]])

max_abs_scaler.scale_
# array([2.,  1.,  2.])
e. 缩放系数矩阵
- 中心化会破坏原始的稀疏结构
scale,StandardScaler可以接受稀疏输入,构造时指定with_mean=False
f. 缩放含有离群值的数据
- 此种情况下均值和方差缩放不是很好的选择
robust_scale,RobustScaler可作为替代
非线性变换
a. 常见可用:
- 分位数转换:可是异常分布更平滑,受异常值影响小,但是使得特征间或内的关联失真,均匀分布在[0,1]
- 幂函数转换:参数变换,目的是转换为接近高斯分布
- 两者均基于特征的单调变换,保持了特征值的秩
b. 映射到均匀分布:
- 分位数类:
QuantileTransformer - 分位数函数:
quantile_transform
from sklearn.datasets import load_iris
from sklearn.model_selection import train_test_split
iris = load_iris()
X, y = iris.data, iris.target
X_train, X_test, y_train, y_test = train_test_split(X, y, random_state=0)
quantile_transformer = preprocessing.QuantileTransformer(random_state=0)
X_train_trans = quantile_transformer.fit_transform(X_train)
X_test_trans = quantile_transformer.transform(X_test)
np.percentile(X_train[:, 0], [0, 25, 50, 75, 100])
# array([ 4.3,  5.1,  5.8,  6.5,  7.9])

# 转换后接近于百分位数定义
np.percentile(X_train_trans[:, 0], [0, 25, 50, 75, 100])
# array([ 0.00... ,  0.24...,  0.49...,  0.73...,  0.99... ])
c. 映射到高斯分布
- 幂变换是一类参数化的单调变换
- 将数据从任何分布映射到尽可能接近高斯分布,以便稳定方差和最小化偏斜。
PowerTransformer提供两种:Yeo-Johnson transform,the Box-Cox transform
pt = preprocessing.PowerTransformer(method='box-cox', standardize=False)
X_lognormal = np.random.RandomState(616).lognormal(size=(3, 3))
X_lognormal
# array([[1.28..., 1.18..., 0.84...],
#       [0.94..., 1.60..., 0.38...],
#       [1.35..., 0.21..., 1.09...]])

pt.fit_transform(X_lognormal)
# array([[ 0.49...,  0.17..., -0.15...],
#       [-0.05...,  0.58..., -0.57...],
#       [ 0.69..., -0.84...,  0.10...]])
- 不同的原始分布经过变化,有的可以变为高斯分布,有的可能效果不太好 
归一化(normalization)
- 缩放单个样本以具有单位范数的过程
- 函数`normalize`:用于数组,`l1`或`l2`范式
X = [[ 1., -1.,  2.],
     [ 2.,  0.,  0.],
     [ 0.,  1., -1.]]
X_normalized = preprocessing.normalize(X, norm='l2')

X_normalized
# array([[ 0.40..., -0.40...,  0.81...],
#       [ 1.  ...,  0.  ...,  0.  ...],
#       [ 0.  ...,  0.70..., -0.70...]])
类别特征编码
a. 标称型特征:非连续的数值,可编码为整数
b. 类OrdinalEncoder:
- 将类别特征值编码为一个新的整数型特征(0到num_category-1之间的一个数)
- 但是这个数值不能直接使用,因为会被认为是有序的(实际是无序的)
- 一般使用独热编码
enc = preprocessing.OrdinalEncoder()
X = [['male', 'from US', 'uses Safari'], ['female', 'from Europe', 'uses Firefox']]
enc.fit(X)
# OrdinalEncoder(categories='auto', dtype=<... 'numpy.float64'>)

enc.transform([['female', 'from US', 'uses Safari']])
# array([[0., 1., 1.]])
c. 独热编码(dummy encoding)
- 该类把每一个具有n_categories个可能取值的categorical特征变换为长度为n_categories的二进制特征向量,里面只有一个地方是1,其余位置都是0。
enc = preprocessing.OneHotEncoder()
X = [['male', 'from US', 'uses Safari'], ['female', 'from Europe', 'uses Firefox']]
enc.fit(X)
# OneHotEncoder(categorical_features=None, categories=None, drop=None,
#       dtype=<... 'numpy.float64'>, handle_unknown='error',
#       n_values=None, sparse=True)

enc.transform([['female', 'from US', 'uses Safari'],
               ['male', 'from Europe', 'uses Safari']]).toarray()
# array([[1., 0., 0., 1., 0., 1.],
#        [0., 1., 1., 0., 0., 1.]])

# 在category_属性中找到,编码后是几维的
enc.categories_
# [array(['female', 'male'], dtype=object), array(['from Europe', 'from US'], dtype=object), array(['uses Firefox', 'uses Safari'], dtype=object)]
可以显示的指定,某个特征需要被编码为几维的,最开始提供一个可能的取值集合,基于这个集合进行编码:
genders = ['female', 'male']
locations = ['from Africa', 'from Asia', 'from Europe', 'from US']
browsers = ['uses Chrome', 'uses Firefox', 'uses IE', 'uses Safari']
enc = preprocessing.OneHotEncoder(categories=[genders, locations, browsers])
# Note that for there are missing categorical values for the 2nd and 3rd
# feature
X = [['male', 'from US', 'uses Safari'], ['female', 'from Europe', 'uses Firefox']]
enc.fit(X)


enc.transform([['female', 'from Asia', 'uses Chrome']]).toarray()
# array([[1., 0., 0., 1., 0., 0., 1., 0., 0., 0.]])
离散化
a. 离散化(discretization):
- 又叫量化(quantization) 或 装箱(binning)
- 将连续特征划分为离散特征值
b. K-bins离散化:
- 使用k个等宽的bins把特征离散化
- 对每一个特征, bin的边界以及总数目在 fit过程中被计算出来
X = np.array([[ -3., 5., 15 ],
              [  0., 6., 14 ],
              [  6., 3., 11 ]])
est = preprocessing.KBinsDiscretizer(n_bins=[3, 2, 2], encode='ordinal').fit(X)

est.transform(X)
# array([[ 0., 1., 1.],
#       [ 1., 1., 1.],
#       [ 2., 0., 0.]])
d. 特征二值化 - 将数值特征用阈值过滤得到布尔值的过程
X = [[ 1., -1.,  2.],
     [ 2.,  0.,  0.],
     [ 0.,  1., -1.]]

binarizer = preprocessing.Binarizer().fit(X)  # fit does nothing
binarizer


binarizer.transform(X)
# array([[1., 0., 1.],
#       [1., 0., 0.],
#       [0., 1., 0.]])

# 可使用不同的阈值
binarizer = preprocessing.Binarizer(threshold=1.1)
binarizer.transform(X)
# array([[0., 0., 1.],
#       [1., 0., 0.],
#       [0., 0., 0.]])
生成多项式特征
a. 为什么? - 添加非线性特征 - 增加模型的复杂度 - 常用:添加多项式
b. 生成多项式类PolynomialFeatures:
import numpy as np
from sklearn.preprocessing import PolynomialFeatures
X = np.arange(6).reshape(3, 2)
X
# array([[0, 1],
#       [2, 3],
#       [4, 5]])

poly = PolynomialFeatures(2)
poly.fit_transform(X)
# array([[ 1.,  0.,  1.,  0.,  0.,  1.],
#        [ 1.,  2.,  3.,  4.,  6.,  9.],
#       [ 1.,  4.,  5., 16., 20., 25.]])
X = np.arange(9).reshape(3, 3)
X
# array([[0, 1, 2],
#       [3, 4, 5],
#       [6, 7, 8]])

# 指定度,且只要具有交叉的项,像上面的自己平方的项不要了
poly = PolynomialFeatures(degree=3, interaction_only=True)
poly.fit_transform(X)
# array([[  1.,   0.,   1.,   2.,   0.,   0.,   2.,   0.],
#       [  1.,   3.,   4.,   5.,  12.,  15.,  20.,  60.],
#       [  1.,   6.,   7.,   8.,  42.,  48.,  56., 336.]])
自定义转换器
类FunctionTransformer:
import numpy as np
from sklearn.preprocessing import FunctionTransformer
transformer = FunctionTransformer(np.log1p, validate=True)
X = np.array([[0, 1], [2, 3]])
transformer.transform(X)
# array([[0.        , 0.69314718],
#       [1.09861229, 1.38629436]])
Read full-text »
sklearn: 数据预处理
2018-09-25
如下图所示,通过6步完成数据预处理操作:
第1步:导入库
import numpy as np
import pandas as pd
第2步:导入数据集
数据集通常是.csv格式。CSV文件以文本形式保存表格数据。文件的每一行是一条数据记录。我们使用Pandas的read_csv方法读取本地csv文件为一个数据帧。然后,从数据帧中制作自变量和因变量的矩阵和向量。
查看数据集,前3列是特征,最后1列是否购买(标签):
gongjing@hekekedeiMac ..yn/github/100-Days-Of-ML-Code/datasets (git)-[master] % cat Data.csv
Country,Age,Salary,Purchased
France,44,72000,No
Spain,27,48000,Yes
Germany,30,54000,No
Spain,38,61000,No
Germany,40,,Yes
France,35,58000,Yes
Spain,,52000,No
France,48,79000,Yes
Germany,50,83000,No
France,37,67000,Yes%
读取数据集:
dataset = pd.read_csv('Data.csv')//读取csv文件
X = dataset.iloc[ : , :-1].values//.iloc[行,列]
Y = dataset.iloc[ : , 3].values  // : 全部行 or 列;[a]第a行 or 列
                                 // [a,b,c]第 a,b,c 行 or 列
查看读取的数据集:
print("X")
print(X)
print("Y")
print(Y)

X
[['France' 44.0 72000.0]
 ['Spain' 27.0 48000.0]
 ['Germany' 30.0 54000.0]
 ['Spain' 38.0 61000.0]
 ['Germany' 40.0 nan]
 ['France' 35.0 58000.0]
 ['Spain' nan 52000.0]
 ['France' 48.0 79000.0]
 ['Germany' 50.0 83000.0]
 ['France' 37.0 67000.0]]
Y
['No' 'Yes' 'No' 'No' 'Yes' 'Yes' 'No' 'Yes' 'No' 'Yes']
第3步:处理丢失数据
我们得到的数据很少是完整的。数据可能因为各种原因丢失,为了不降低机器学习模型的性能,需要处理数据。我们可以用整列的平均值或中间值替换丢失的数据。我们用sklearn.preprocessing库中的Imputer类完成这项任务。
from sklearn.preprocessing import Imputer
imputer = Imputer(missing_values = "NaN", strategy = "mean", axis = 0)
# 对第2、3列进行imputing,因为这两个特征是数值项
imputer = imputer.fit(X[ : , 1:3])
X[ : , 1:3] = imputer.transform(X[ : , 1:3])
第4步:解析分类数据
分类数据指的是含有标签值而不是数字值的变量。取值范围通常是固定的。例如”Yes”和”No”不能用于模型的数学计算,所以需要解析成数字。为实现这一功能,我们从sklearn.preprocessing库导入LabelEncoder类。
from sklearn.preprocessing import LabelEncoder, OneHotEncoder
labelencoder_X = LabelEncoder()
X[ : , 0] = labelencoder_X.fit_transform(X[ : , 0])
创建虚拟变量
onehotencoder = OneHotEncoder(categorical_features = [0])
X = onehotencoder.fit_transform(X).toarray()
labelencoder_Y = LabelEncoder()
Y =  labelencoder_Y.fit_transform(Y)
查看编码之后的数据。从这里可以看到,原来的第一列是国家(类别特征),包含3个:France、Spain、Germany,在做了转换之后,特征多了两个,相当于原来的1个特征现在用3个特征来表示:
print("Step 4: Encoding categorical data")
print("X")
print(X)
print("Y")
print(Y)

X
[[1.00000000e+00 0.00000000e+00 0.00000000e+00 4.40000000e+01
  7.20000000e+04]
 [0.00000000e+00 0.00000000e+00 1.00000000e+00 2.70000000e+01
  4.80000000e+04]
 [0.00000000e+00 1.00000000e+00 0.00000000e+00 3.00000000e+01
  5.40000000e+04]
 [0.00000000e+00 0.00000000e+00 1.00000000e+00 3.80000000e+01
  6.10000000e+04]
 [0.00000000e+00 1.00000000e+00 0.00000000e+00 4.00000000e+01
  6.37777778e+04]
 [1.00000000e+00 0.00000000e+00 0.00000000e+00 3.50000000e+01
  5.80000000e+04]
 [0.00000000e+00 0.00000000e+00 1.00000000e+00 3.87777778e+01
  5.20000000e+04]
 [1.00000000e+00 0.00000000e+00 0.00000000e+00 4.80000000e+01
  7.90000000e+04]
 [0.00000000e+00 1.00000000e+00 0.00000000e+00 5.00000000e+01
  8.30000000e+04]
 [1.00000000e+00 0.00000000e+00 0.00000000e+00 3.70000000e+01
  6.70000000e+04]]
Y
[0 1 0 0 1 1 0 1 0 1]
第5步:拆分数据集为训练集合和测试集合
把数据集拆分成两个:一个是用来训练模型的训练集合,另一个是用来验证模型的测试集合。两者比例一般是80:20。我们导入sklearn.model_selection库中的train_test_split()方法。
from sklearn.model_selection import train_test_split
X_train, X_test, Y_train, Y_test = train_test_split( X , Y , test_size = 0.2, random_state = 0)
查看查分后的数据:
print("Step 5: Splitting the datasets into training sets and Test sets")
print("X_train")
print(X_train)
print("X_test")
print(X_test)
print("Y_train")
print(Y_train)
print("Y_test")
print(Y_test)

Step 5: Splitting the datasets into training sets and Test sets
X_train
[[  0.00000000e+00   1.00000000e+00   0.00000000e+00   4.00000000e+01
    6.37777778e+04]
 [  1.00000000e+00   0.00000000e+00   0.00000000e+00   3.70000000e+01
    6.70000000e+04]
 [  0.00000000e+00   0.00000000e+00   1.00000000e+00   2.70000000e+01
    4.80000000e+04]
 [  0.00000000e+00   0.00000000e+00   1.00000000e+00   3.87777778e+01
    5.20000000e+04]
 [  1.00000000e+00   0.00000000e+00   0.00000000e+00   4.80000000e+01
    7.90000000e+04]
 [  0.00000000e+00   0.00000000e+00   1.00000000e+00   3.80000000e+01
    6.10000000e+04]
 [  1.00000000e+00   0.00000000e+00   0.00000000e+00   4.40000000e+01
    7.20000000e+04]
 [  1.00000000e+00   0.00000000e+00   0.00000000e+00   3.50000000e+01
    5.80000000e+04]]
X_test
[[  0.00000000e+00   1.00000000e+00   0.00000000e+00   3.00000000e+01
    5.40000000e+04]
 [  0.00000000e+00   1.00000000e+00   0.00000000e+00   5.00000000e+01
    8.30000000e+04]]
Y_train
[1 1 1 0 1 0 0 1]
Y_test
[0 0]
第6步:特征量化
大部分模型算法使用两点间的欧氏距离表示,但此特征在幅度、单位和范围姿态问题上变化很大。在距离计算中,高幅度的特征比低幅度特征权重更大。可用特征标准化或Z值归一化解决。导入sklearn.preprocessing库的StandardScalar类
from sklearn.preprocessing import StandardScaler
sc_X = StandardScaler()
X_train = sc_X.fit_transform(X_train)
X_test = sc_X.transform(X_test)
print("Step 6: Feature Scaling")
print("X_train")
print(X_train)
print("X_test")
print(X_test)

Step 6: Feature Scaling
X_train
[[-1.          2.64575131 -0.77459667  0.26306757  0.12381479]
 [ 1.         -0.37796447 -0.77459667 -0.25350148  0.46175632]
 [-1.         -0.37796447  1.29099445 -1.97539832 -1.53093341]
 [-1.         -0.37796447  1.29099445  0.05261351 -1.11141978]
 [ 1.         -0.37796447 -0.77459667  1.64058505  1.7202972 ]
 [-1.         -0.37796447  1.29099445 -0.0813118  -0.16751412]
 [ 1.         -0.37796447 -0.77459667  0.95182631  0.98614835]
 [ 1.         -0.37796447 -0.77459667 -0.59788085 -0.48214934]]
X_test
[[ 0.  0.  0. -1. -1.]
 [ 0.  0.  0.  1.  1.]]
Read full-text »
降维与度量学习
2018-09-23
目录
K-近邻学习
- 常用的监督式学习方法。具体算法参见另一篇博文:K-近邻算法
- 分类:投票法;回归:平均法
- 懒惰学习的代表:lazy learning
- 没有显示的训练过程
- 在训练阶段保存样本,训练开销为0
- 收到测试样本后再进行处理
- 急切学习:eager learning
- 在训练阶段就对样本进行学习处理的方法
- 重要参数:
- k取值:取值不同,可能结果也不同
- 距离计算方式不同,找出的近邻可能不同。【这也是为什么在这一章会开始讲述k近邻,因为涉及距离的度量和计算】
- KNN特殊的二分类问题:
低维嵌入
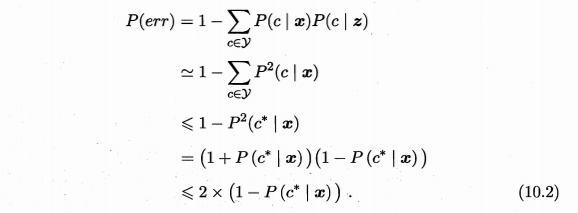
- 1NN特殊的二分类问题:重要假设是,对任意\(x\)和任意小正数\(\delta\),在\(x\)附近\(\delta\)距离范围内,总能找到一个训练样本,即训练样本的采样密度足够大 =》密采样(dense sampling)
- 现实难以满足
- 如果\(\delta=0.001\),只有1个属性,则需1000个点平均才能满足,如果有多个属性呢?样本巨大!=》密采样条件所需样本数一般无法达到。
- 维数灾难:curse of dimensionality,高维情形下出现的数据样本系数、距离计算困难
- 解决方案:降维
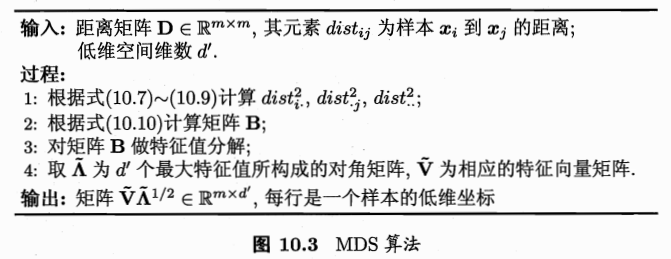
多维缩放(MDS)
- 多维缩放:multiple dimensional scaling,MDS
- 经典的降维方法
- 要求:原始空间中样本之间的距离在低维空间中得以保持
- 定义:
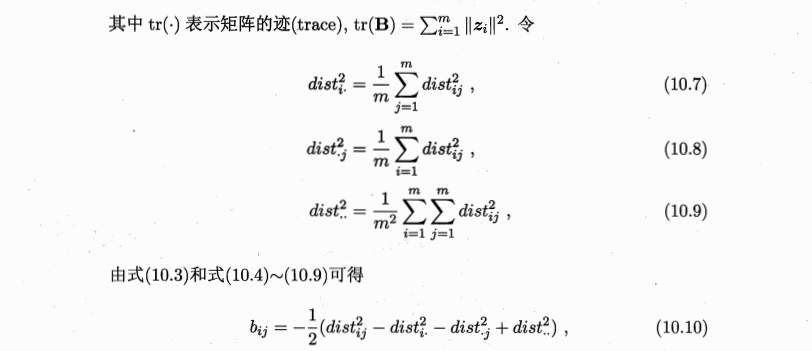
- 原始空间:\(距离矩阵D\in R^{m\times m}, m个样本, dist_{ij}: x_i和x_j之间的距离\)
- 目标:\(降维后的空间Z\in R^{d'\times m},d‘空间中的距离=原始空间的,\|\|z_i-z_j\|\|=dist_{ij}\)
- 线性降维方法:基于线性变换来进行降维,都符合基本形式:\(Z=W^TX\)
-
不同:对低维子空间的性质有不同的要求,即对\(W\)施加了不同的约束
- 降维效果评估:
- 比较降维前后学习器的性能,若性能有所提高则认为降维起到了作用【这么。。?】
- 若维数将至二或者三维,可借助可视化技术直观判断降维效果
主成分分析
- 最常用降维方法。具体可参见另一篇博文[CS229] 14: Dimensionality Reduction
- 问题:对于正交属性空间的样本,如何用一个超平面对所有样本进行恰当表达?
- 若存在,具有以下两个性质
- 【1】最近重构性。样本点到这个超平面的距离足够近。
- 【2】最大可分性。样本点在这个超平面上的投影尽可能分开。
- 上面两个能分别得到主成分分析的等价推导。
- 算法:
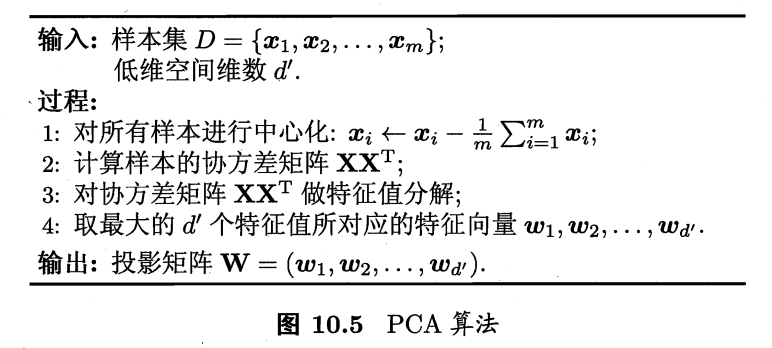
核化线性降维、KPCA
- 线性降维:假设从高维到低维空间的函数映射是线性的
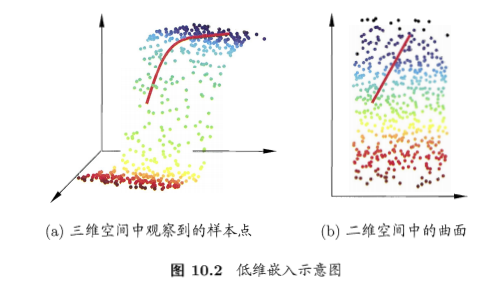
- 现实:需要非线性映射才能找到恰当的低维嵌入
- 例子:二维采样以S曲面投到3维,如果使用线性降维(c图的PCA),则会丢失掉二维空间原本的信息
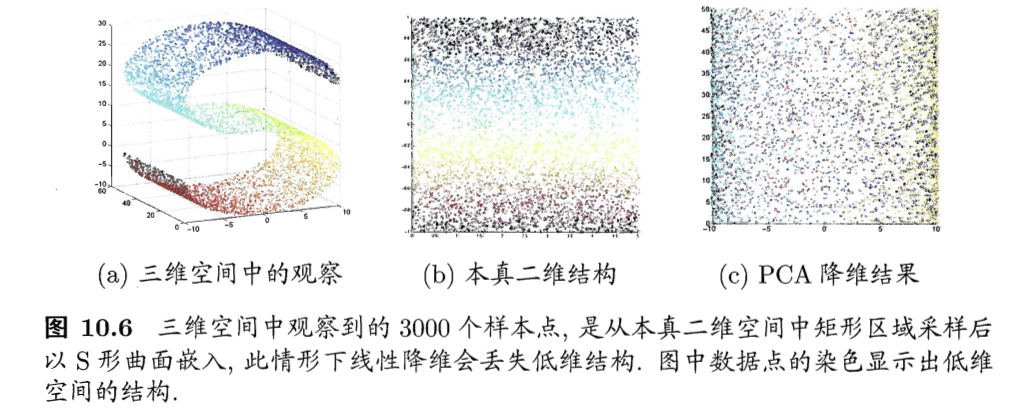
-
非线性降维:基于核技巧对线性降维方法进行核化(kernelized)
- KPCA:核主成分分析,对线性降维的PCA进行核化
- PCA求解:\((\sum_{i=1}^mz_iz_i^T)W= \lambda W\)
- \(z_i\)是\(x_i\)在高维特征中的像,则:\(W=\frac{1}{\lambda}(\sum_{i=1}^mz_iz_i^T)W=\sum_{i=1}^mz_i\frac{z_i^TW}{\lambda}=\sum_{i=1}^mz_i\alpha_i, 其中\alpha_i=\frac{1}{\lambda}z_i^TW\)
- 假设\(z_i\)是原始空间样本点\(x_i\)通过映射\(\phi\)产生,即\(z_i=\phi(x_i)\)
- 若\(\phi\)能被显式的表达出来,则通过它将样本映射到高维空间,再在特征空间中实施PCA即可
- 引入\(\phi\)后有:
- 求解:\((\sum_{i=1}^m\phi(x_i)\phi(x_i)^T)W= \lambda W, W=\sum_{i=1}^m\phi(x_i)\alpha_i\)
- 不清楚\(\phi\)形式,引入核函数
- 有:\(\kappa(x_i,x_j)=\phi(x_i)^T\phi(x_j)\)
- \(KA=\lambda A, K为\kappa的核矩阵\),属于特征值分解问题,取\(K\)最大的\(d'\)个特征值对应的特征向量即可
- 为获得投影后的坐标,KPCA需对所有样本求和,计算开销大
流形学习
- 流形学习:manifold learning
- 借鉴拓扑流形的概念
- 流形:在局部与欧式空间同坯的空间。在局部具有欧式空间的性质,能用欧式距离进行计算。
- 启发:
- 若低维流形嵌入到高维,虽然整体很杂乱,但是局部仍然具有欧式空间的性质。
- 高维中局部建立降维的映射关系,再设法将局部映射关系推广到全局
等度量映射
- 等度量映射:isometric mapping,Isomap
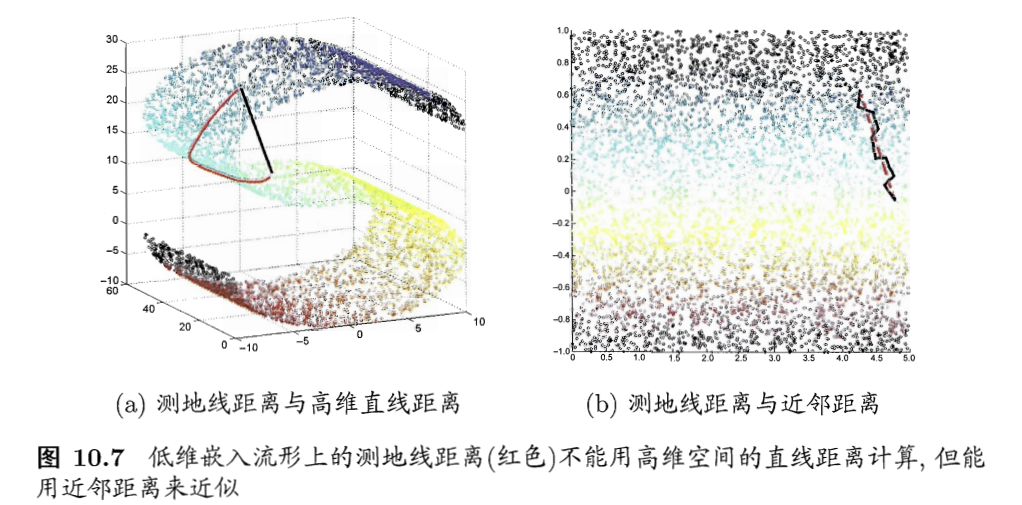
- 基础:认为低维流形嵌入到高维之后,直接在高维空间中计算直线距离具有误导性,因为在高维空间中直线距离在低维嵌入流形上是不可达的
- 例子:
- 如何计算测地线距离?
- 流形在局部是可以计算的性质
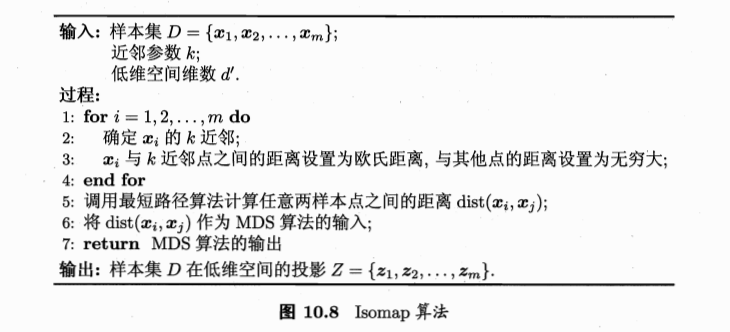
- 对于每个点基于欧式距离找出近邻点
- 建立近邻连接图,邻近点存在连接,非邻近点不存在连接
- 地线距离 =》邻近连接图上两点的最短路径问题
- 最短路径:可采用经典的Dijkstra算法或者Floyd算法
- 注意:
- 得到的是训练样本在低维空间的坐标
- 新样本,如何映射?【不是基于流形性质获得了映射关系吗?不能直接使用吗?】
- 训练一个回归学习器,预测新样本在低维空间的坐标
- 近邻图构建:
- k近邻图:指定近邻点个数
- \(\epsilon\)近邻图:指定距离阈值,小于阈值的认为是近邻点
局部线性嵌入
- Isomap:保持近邻样本之间的距离一样
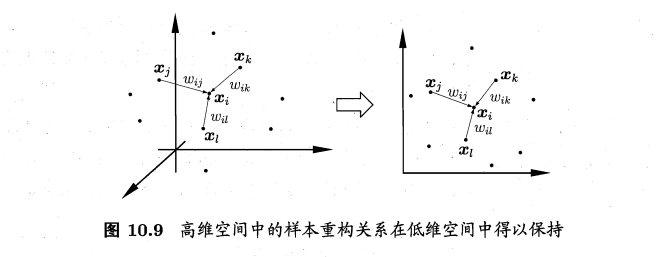
- 局部线性嵌入:locally linear embedding, LLE,保持邻域内样本之间的线性关系
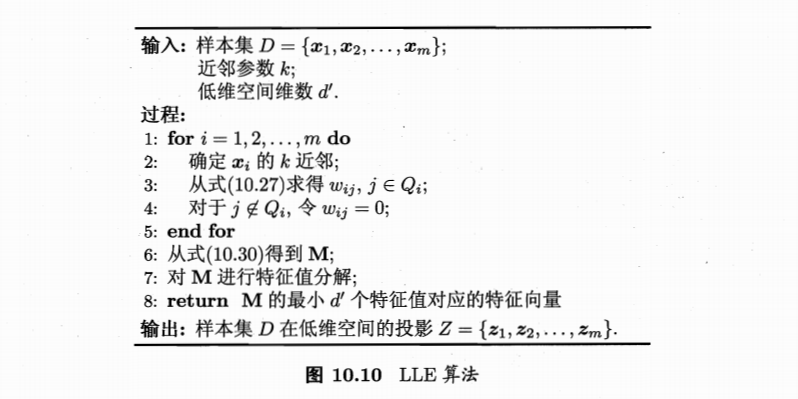
- 样本点\(x_i\)的坐标可通过邻域点表示: \(x_i=w_{ij}x_j+w_{ik}x_k+w_{il}x_l\),LLE希望这个关系能在低维空间中保持
- 算法:
度量学习
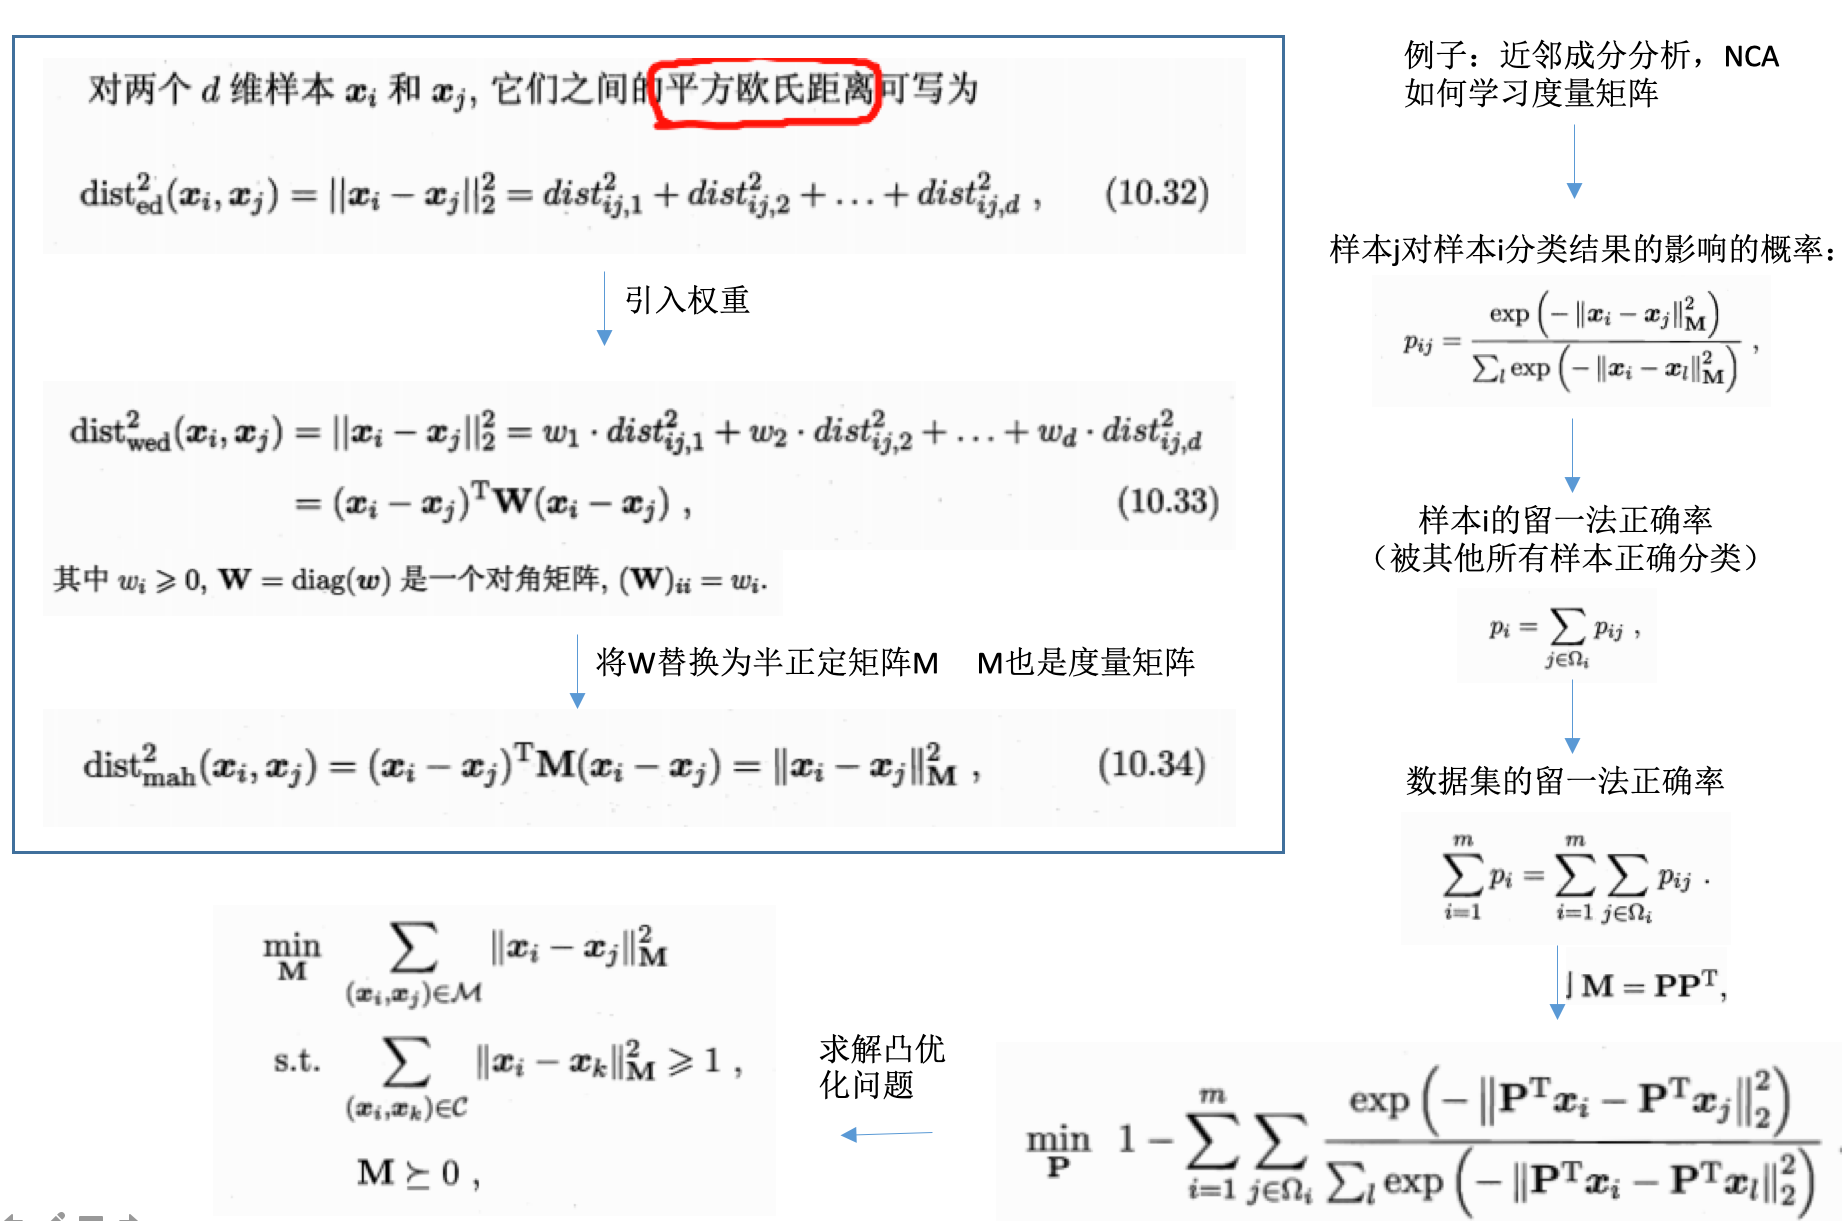
- 度量学习:metric learning
- 高维 =》低维,低维空间学习性能更好
- 每个空间(高维或者低维),对应了样本属性上定义的一个距离度量
- 寻找合适空间 =》寻找合适度量
-
能否学习一个合适的距离度量?
- 距离度量表达形式,便于学习的?
- 需要有可调节的参数
参考
- 机器学习周志华第10章
Read full-text »
自适应上升决策树、梯度提升决策树及aggregation方法
2018-09-20
目录
随机森林:bagging
- 随机森林:通过boostrap从原样本D随机选取得到新样本D‘,对每个D’训练得到不同的模型\(g_t\),最后通过uniform(投票)形式组合起成G。
- uniform:bagging方式
自适应上升决策树(adaptive boosted decision tree):Adaboost
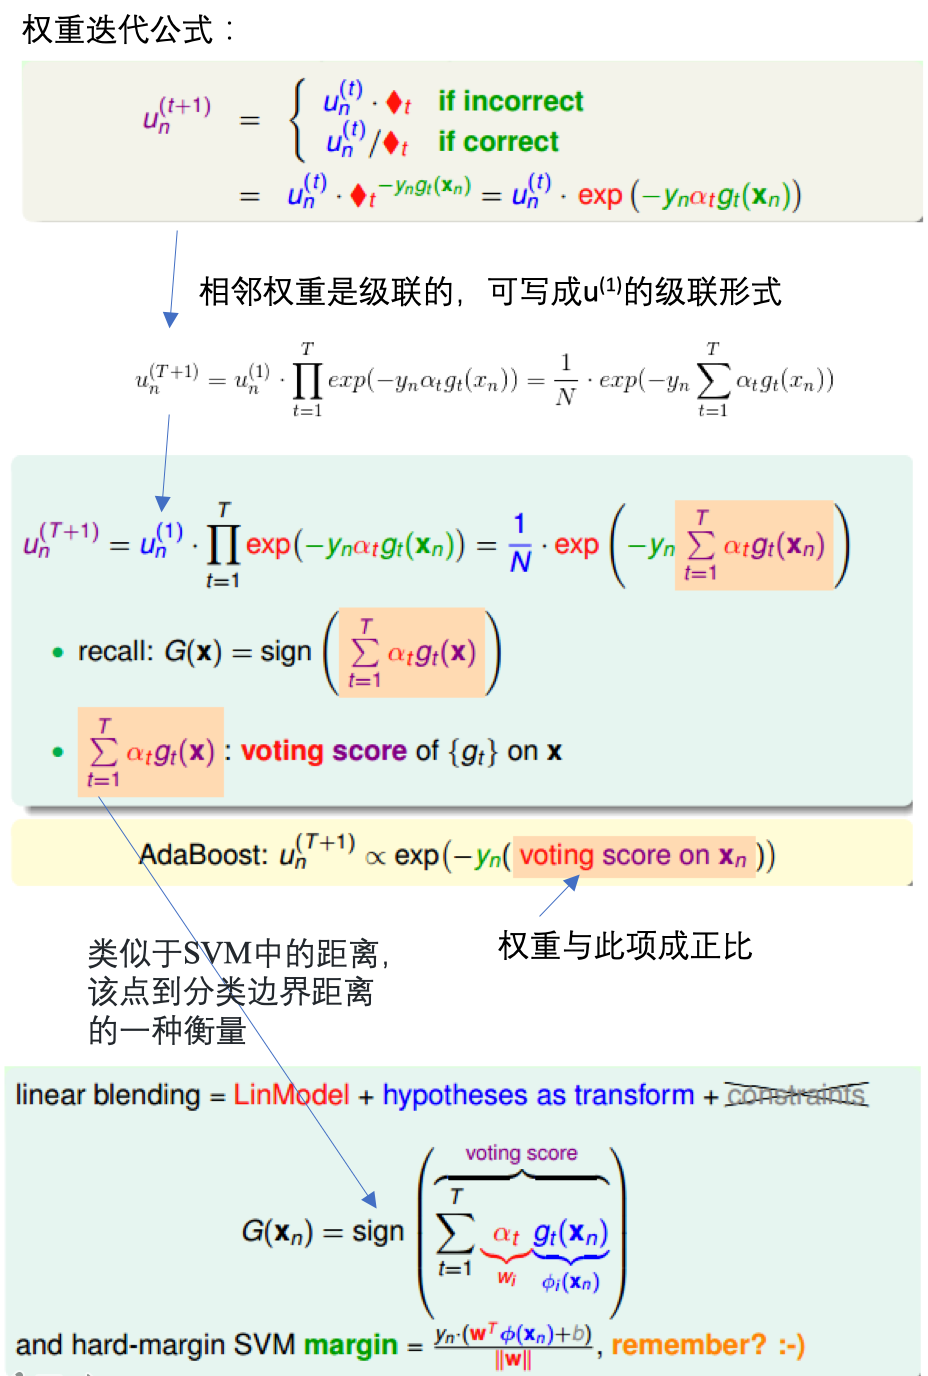
- 【AdaBoost-D Tree】如果将随机森林中的bagging换为AdaBoost:每轮bootstrap得到的D‘中每个样本会赋予不同的权重\(u^{(t)}\),然后每个决策树中,利用权重得到对应的最好模型\(g_t\),最后得出每个\(g_t\)所占的权重,线性组合得到G。
- Adaptive Boosting的bootstrap操作:有放回的抽样,\(u^{(t)}\)表示每个样本在D’中出现的次数。
通过带权重的采样引入权重
- 决策树CART中没有引入\(u^{(t)}\),如果把权重引入进来?
- 采用weighted算法:\(E_{in}^{u}(h)=\frac{1}{N}\sum_{n-1}^N * err(y_n, h(x_n))\),即:每个犯错的样本点乘以权重,求和取平均
-
同理:对决策树的每个分支进行如此计算。复杂不易求解!!!
- 权重\(u^{(t)}\):该样本在bootstrap中出现的次数(概率)
- 根据u值,对原样本进行一次重新的带权重的随机抽样(sampling),得到的新D‘每个样本出现的几率与其权重是近似的。
- 因此使用带权重的随机抽样得到的数据,直接进行决策树训练,从而无需改变决策树结构。
- sampling可认为是bootstrap的反操作
- AdaBoost-DTree:AdaBoost+sampling+DTree
- 每个训练的\(g_t\)权重:计算其错误率,转换为权重
采用弱的决策树
- 问题:
- 完全长成的树(fully grown tree):
- 所有样本x训练而成
- 如果每个样本均不同,错误率为0,权重为无限大(其他模型没有效果)。
- 这就是autocracy(专制的),不是我们想要的结果
- 希望通过把不同的\(g_t\) aggregation起来,发挥集体智慧。
- 专制的原因:【1】使用了所有样本进行训练,【2】树的分支过多
- 解法:对树做一些修剪,比如只使用部分样本;限制树的高度,不要那么多分支。
- AdaBoost-DTree:使用的是pruned tree,将较弱的树结合起来,得到最好的G,避免出现专制。
- AdaBoost-DTree:AdaBoost+sampling+pruned DTree
高度为1时就是AdaBoost-Stump(切割)
- 限制树高为1?
- 整棵树两个分支,一次切割即可
- 此时的AdaBoost-DTree就跟AdaBoost-Stump没什么两样
- AdaBoost-Stump是AdaBoost-DTree的一种特殊情况
目标优化函数及求解
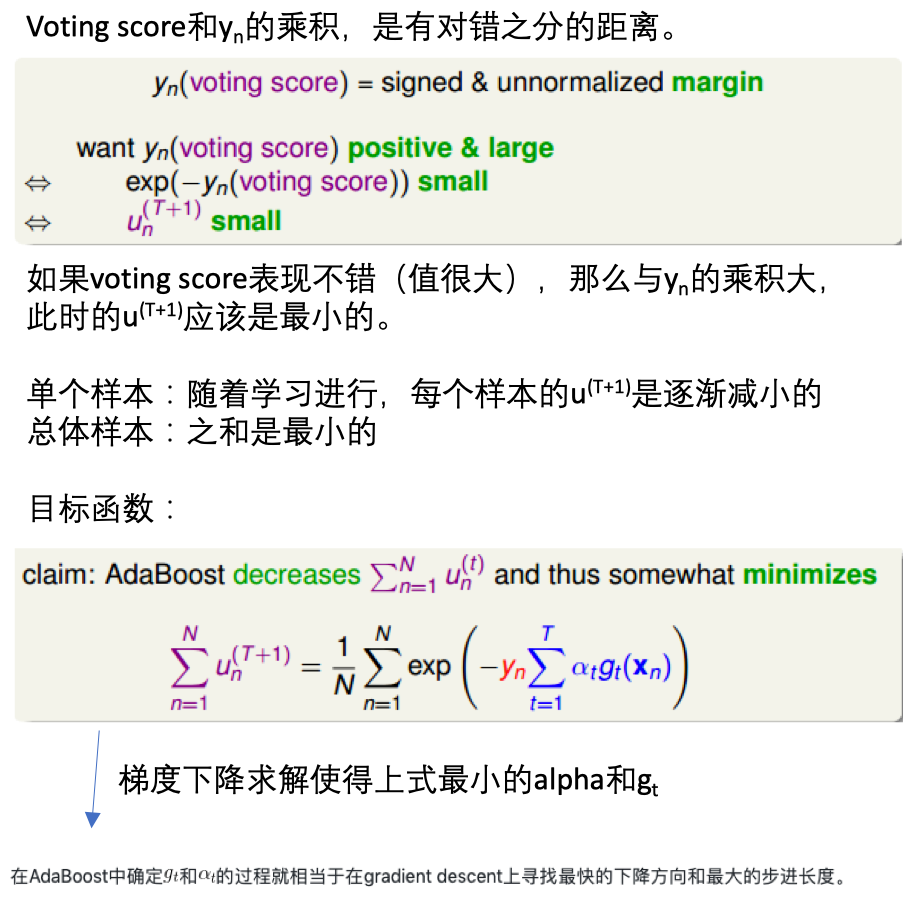
先由单个数据的权重更新,到整体样本的更新,推出需要使得最小化的函数:
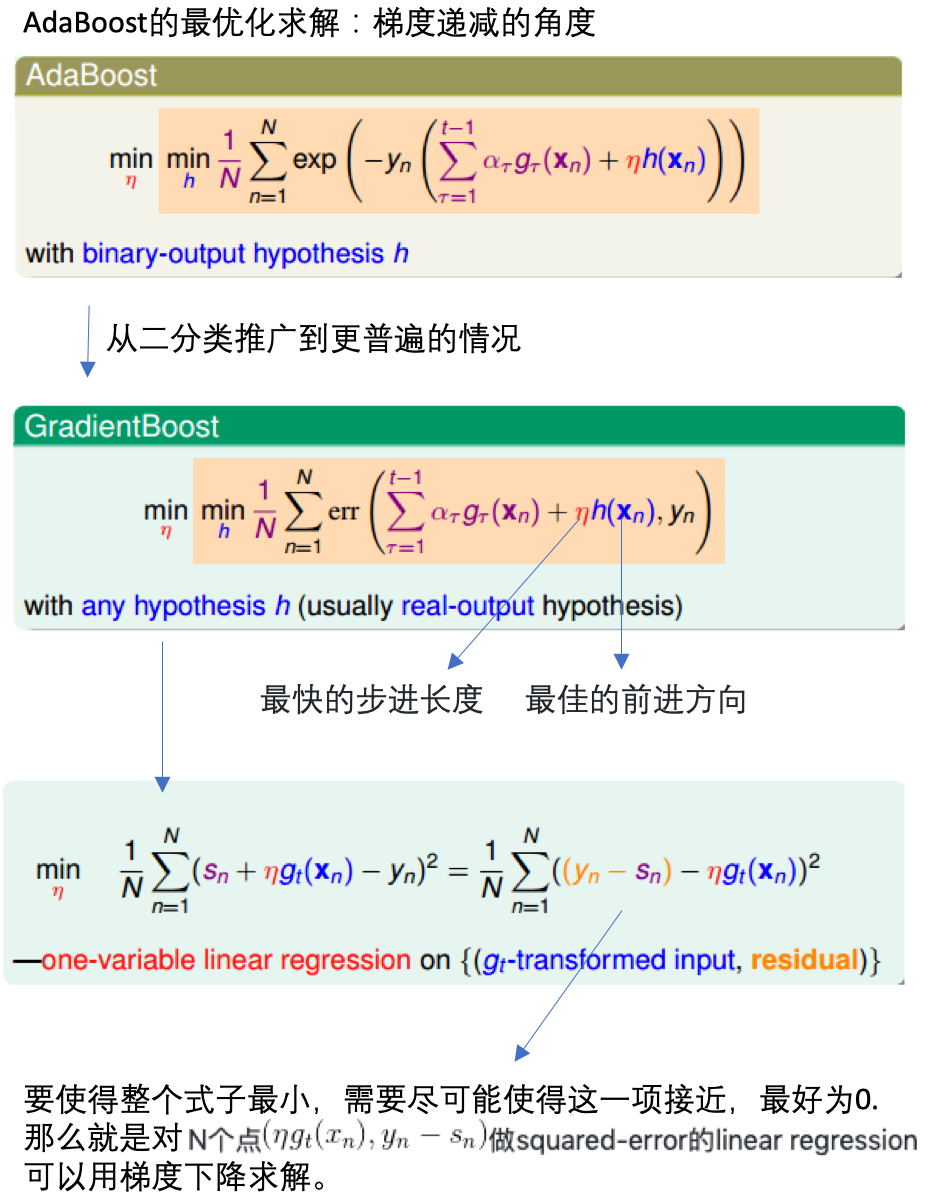
通过梯度递减,求解使得满足函数最小时的模型\(g_t\)和每个决策树的权重\(\alpha_t\):
二分类扩展到普遍
sklearn调用AdaBoost
from sklearn.model_selection import cross_val_score
from sklearn.datasets import load_iris
from sklearn.ensemble import AdaBoostClassifier

X, y = load_iris(return_X_y=True)
clf = AdaBoostClassifier(n_estimators=100)
scores = cross_val_score(clf, X, y, cv=5)
scores.mean()
梯度上升决策树
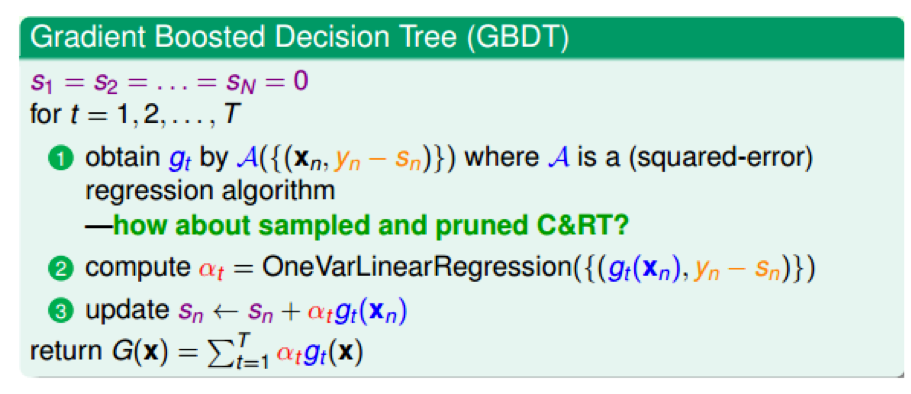
- 把上面的概念都合并起来,得到一个新的算法:梯度上升决策树。
- 那里用到了决策树?在对N个点\((x_n, y_n-s_n)\)进行回归时使用了,决策树也是可以用于回归的。
- GBDT:gradient boost + decision tree
具体步骤:
- 初始化:\(s_1=s_2=...=s_n=0\)
- 每轮迭代:方向函数\(g_t\)通过CART算法做回归求得
- 步长通过简单线性回归求解
- 更新每轮的\(s_n:s_n=s_n+\alpha_tg_t(x_n)\)
- T轮迭代结束,得到最终模型:\(G(x)=\sum_{i=1}^T\alpha_tg_t(x)\)
sklearn调用GBDT
# 分类
from sklearn.datasets import make_hastie_10_2
from sklearn.ensemble import GradientBoostingClassifier

X, y = make_hastie_10_2(random_state=0)
X_train, X_test = X[:2000], X[2000:]
y_train, y_test = y[:2000], y[2000:]

clf = GradientBoostingClassifier(n_estimators=100, learning_rate=1.0,
    max_depth=1, random_state=0).fit(X_train, y_train)
clf.score(X_test, y_test)

# 回归
import numpy as np
from sklearn.metrics import mean_squared_error
from sklearn.datasets import make_friedman1
from sklearn.ensemble import GradientBoostingRegressor

X, y = make_friedman1(n_samples=1200, random_state=0, noise=1.0)
X_train, X_test = X[:200], X[200:]
y_train, y_test = y[:200], y[200:]
est = GradientBoostingRegressor(n_estimators=100, learning_rate=0.1,
    max_depth=1, random_state=0, loss='ls').fit(X_train, y_train)
mean_squared_error(y_test, est.predict(X_test))
aggregation模型总结
5种aggregation方法
- 7.blending and bagging
- 8.adaptive boosting
- 9.decision tree
- 10.random forest
- 11.gradient boosted decision tree
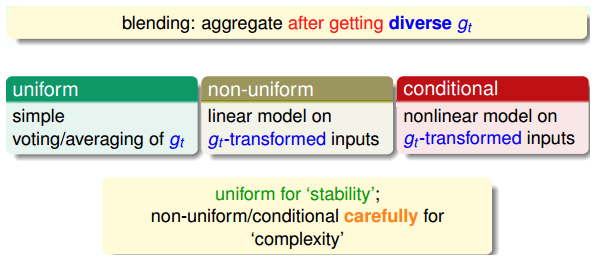
blending(混合):单个模型已知
blending:将所有已知的\(g_t\) aggregate起来,得到G,通常有3种:
- uniform:简单地计算所有\(g_t\)的平均值。投票,求平均,更注重稳定性。
- non-uniform:所有\(g_t\)的线性组合。追求更复杂的模型,存在过拟合风险。
- conditional:所有\(g_t\)的非线性组合。追求更复杂的模型,存在过拟合风险。
learning:单个模型未知
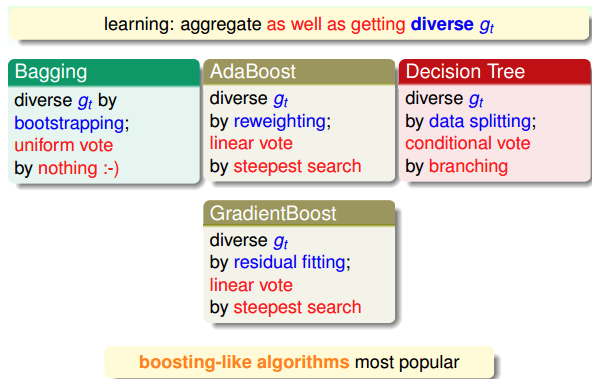
learning:一边学\(g_t\),一边将他们结合起来,通常有3种(与blending对应):
- bagging:通过boostrap方法,得到不同的\(g_t\),计算所有\(g_t\)的平均值
- AdaBoost:通过boostrap方法,得到不同的\(g_t\),所有\(g_t\)的线性组合
- decision tree:通过数据分割的形式得到不同的\(g_t\),所有\(g_t\)的非线性组合
learning中的aggregate模型的再组合
对于aggregate模型,可以进行再次组合,以得到更强大的模型: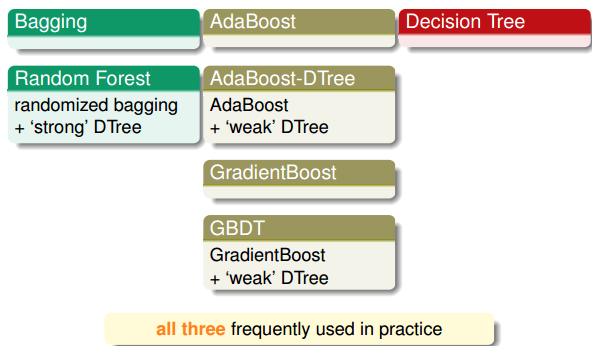
aggregation优点
- 防止欠拟合:把弱的\(g_t\)结合起来,以获得较好的G,相当于是feature转换,获得复杂的模型。
- 防止过拟合:把所有的\(g_t\)结合起来,容易得到一个比较中庸的模型,利用平均化,避免一些极端情况的发生。
参考
Read full-text »
Latest articles
Links
- ZhangLab , RISE database , THU life , THU info
- Data analysis: pandas , numpy , scipy
- ML/DL: sklearn , sklearn(中文) , pytorch
- Visualization: seaborn , matplotlib , gallery
- Github: me

