树回归算法
2018-08-30
概述
- 决策树:将数据不断切分,直到目标变量相同或者不可分为止。是一种贪心算法,做出最佳选择,不考虑到达全局最优。
- ID3建树:
- 切分过于迅速,使用某特征进行分割之后,此特征不再使用。切割数目与特征值取值个数有关,比如取4个值,则分为4类。
- 不能直接处理连续型特征:需事先进行转换,此转换可能破坏连续型变量的内在性质
- 二元切分:设定特征阈值,分为大于此阈值的和小于此阈值的,进行切分。
- CART(Classification and Regression Tree):二元切分处理连续型变量
- 可处理标称型【分类】或者连续型【回归】变量
- 分类:采用基尼系数选择最优特征
- 回归:平方误差和选取特征和阈值。回归又包含以下两类:
- 回归树(regression tree):每个节点包含单个值
- 模型树(model tree):每个节点包含一个线性方程

- 回归树:
- 叶子节点是(分段)常数值
- 恒量数据一致性(误差计算):1)求数据均值,2)所有点到均值的差值的平方,3)平方和。类似于方差,方差是平方误差的均值(均方差),这里是平方误差的总值(总方差)。
- 树剪枝(tree pruning):
- 为什么剪枝?节点过多,模型对数据过拟合。如何判断是否过拟合?交叉验证!
-
剪枝(purning):降低决策树的复杂度来避免过拟合的过程。
- 预剪枝(prepurning):设定提前终止条件等
-
对于某些参数很敏感,比如设定的:tolS容许的误差下降值,tolN切分的最少样本数。当有的特征其数值数量级发生变化时,可能很影响最后的回归结果。
- 后剪枝(postpurning):使用测试集和训练集
- 不用用户指定参数,更加的友好,基本过程如下:
-
基于已有的树切分测试数据
 如果存在任一子集是一棵树,则在该子集递归剪枝过程
 计算将当前两个叶节点合并后的误差
 计算不合并的误差
 如果合并误差会降低误差的话,就将叶节点合并
- 模型树:
- 把叶节点设置为分段线性函数(piecewise linear),每一段可用普通的线性回归
- 模型由多个线性片段组成,与回归树相比,叶节点的返回值是一个模型,而不是一个数值(目标值的均值)
- 结果更易于理解,具有更高的预测准确度
实现
Python源码版本
回归树的构建:
# 在给定特征和阈值,将数据集进行切割
def binSplitDataSet(dataSet, feature, value):
    mat0 = dataSet[nonzero(dataSet[:,feature] > value)[0],:][0]
    mat1 = dataSet[nonzero(dataSet[:,feature] <= value)[0],:][0]
    return mat0,mat1

# 递归调用creatTree函数,进行树构建
def createTree(dataSet, leafType=regLeaf, errType=regErr, ops=(1,4)):#assume dataSet is NumPy Mat so we can array filtering
    feat, val = chooseBestSplit(dataSet, leafType, errType, ops)#choose the best split
    if feat == None: return val #if the splitting hit a stop condition return val
    retTree = {}
    retTree['spInd'] = feat
    retTree['spVal'] = val
    lSet, rSet = binSplitDataSet(dataSet, feat, val)
    retTree['left'] = createTree(lSet, leafType, errType, ops)
    retTree['right'] = createTree(rSet, leafType, errType, ops)
    return retTree
回归树的切分:
def regLeaf(dataSet):#returns the value used for each leaf
    return mean(dataSet[:,-1])

def regErr(dataSet):
    return var(dataSet[:,-1]) * shape(dataSet)[0]

# leafType:这里是regLeaf回归树,目标变量的均值
# errType: 这里是目标变量的平方误差 * 样本数目=平方误差和
# tolS = ops[0]; tolN = ops[1] tolS容许的误差下降值,tolN切分的最少样本数(确保有的支数目不能过少)
def chooseBestSplit(dataSet, leafType=regLeaf, errType=regErr, ops=(1,4)):
    tolS = ops[0]; tolN = ops[1]
    #if all the target variables are the same value: quit and return value
    if len(set(dataSet[:,-1].T.tolist()[0])) == 1: #exit cond 1
        return None, leafType(dataSet)
    m,n = shape(dataSet)
    #the choice of the best feature is driven by Reduction in RSS error from mean
    S = errType(dataSet)
    bestS = inf; bestIndex = 0; bestValue = 0
    for featIndex in range(n-1):
        # 这里是遍历要切分的feature的所有可能取值集合,而不是这个范围内的所有值?
        for splitVal in set(dataSet[:,featIndex]):
            mat0, mat1 = binSplitDataSet(dataSet, featIndex, splitVal)
            if (shape(mat0)[0] < tolN) or (shape(mat1)[0] < tolN): continue
            newS = errType(mat0) + errType(mat1)
            if newS < bestS:
                bestIndex = featIndex
                bestValue = splitVal
                bestS = newS
    #if the decrease (S-bestS) is less than a threshold don't do the split
    if (S - bestS) < tolS:
        return None, leafType(dataSet) #exit cond 2
    mat0, mat1 = binSplitDataSet(dataSet, bestIndex, bestValue)
    if (shape(mat0)[0] < tolN) or (shape(mat1)[0] < tolN):  #exit cond 3
        return None, leafType(dataSet)
    return bestIndex,bestValue#returns the best feature to split on
                              #and the value used for that split
回归树剪枝:
def isTree(obj):
    return (type(obj).__name__=='dict')

def getMean(tree):
    if isTree(tree['right']): tree['right'] = getMean(tree['right'])
    if isTree(tree['left']): tree['left'] = getMean(tree['left'])
    return (tree['left']+tree['right'])/2.0

def prune(tree, testData):
    if shape(testData)[0] == 0: return getMean(tree) #if we have no test data collapse the tree
    if (isTree(tree['right']) or isTree(tree['left'])):#if the branches are not trees try to prune them
        lSet, rSet = binSplitDataSet(testData, tree['spInd'], tree['spVal'])
    if isTree(tree['left']): tree['left'] = prune(tree['left'], lSet)
    if isTree(tree['right']): tree['right'] =  prune(tree['right'], rSet)
    #if they are now both leafs, see if we can merge them
    if not isTree(tree['left']) and not isTree(tree['right']):
        lSet, rSet = binSplitDataSet(testData, tree['spInd'], tree['spVal'])
        errorNoMerge = sum(power(lSet[:,-1] - tree['left'],2)) +\
            sum(power(rSet[:,-1] - tree['right'],2))
        treeMean = (tree['left']+tree['right'])/2.0
        errorMerge = sum(power(testData[:,-1] - treeMean,2))
        if errorMerge < errorNoMerge:
            print "merging"
            return treeMean
        else: return tree
    else: return tree
模型树:
# 普通的线性回归,返回模型
def linearSolve(dataSet):   #helper function used in two places
    m,n = shape(dataSet)
    X = mat(ones((m,n))); Y = mat(ones((m,1)))#create a copy of data with 1 in 0th postion
    X[:,1:n] = dataSet[:,0:n-1]; Y = dataSet[:,-1]#and strip out Y
    xTx = X.T*X
    if linalg.det(xTx) == 0.0:
        raise NameError('This matrix is singular, cannot do inverse,\n\
        try increasing the second value of ops')
    ws = xTx.I * (X.T * Y)
    return ws,X,Y

def modelLeaf(dataSet):#create linear model and return coeficients
    ws,X,Y = linearSolve(dataSet)
    return ws

# 计算误差:预测值和真实值之间的平方误差
def modelErr(dataSet):
    ws,X,Y = linearSolve(dataSet)
    yHat = X * ws
    return sum(power(Y - yHat,2))
sklearn版本
from sklearn.datasets import load_boston
from sklearn.model_selection import cross_val_score
from sklearn.tree import DecisionTreeRegressor
boston = load_boston()
regressor = DecisionTreeRegressor(random_state=0)
cross_val_score(regressor, boston.data, boston.target, cv=10)

# array([ 0.61..., 0.57..., -0.34..., 0.41..., 0.75...,
#        0.07..., 0.29..., 0.33..., -1.42..., -1.77...])
参考
- 机器学习实战第9章
- 机器学习算法实践-树回归
Read full-text »
Convert coordinates
2018-08-28
liftOver command usage
[zhangqf7@loginview02 danRer7]$ liftOver
liftOver - Move annotations from one assembly to another
usage:
   liftOver oldFile map.chain newFile unMapped
oldFile and newFile are in bed format by default, but can be in GFF and
maybe eventually others with the appropriate flags below.
The map.chain file has the old genome as the target and the new genome
as the query.

***********************************************************************
WARNING: liftOver was only designed to work between different
         assemblies of the same organism. It may not do what you want
         if you are lifting between different organisms. If there has
         been a rearrangement in one of the species, the size of the
         region being mapped may change dramatically after mapping.
***********************************************************************

options:
   -minMatch=0.N Minimum ratio of bases that must remap. Default 0.95
   -gff  File is in gff/gtf format.  Note that the gff lines are converted
         separately.  It would be good to have a separate check after this
         that the lines that make up a gene model still make a plausible gene
         after liftOver
   -genePred - File is in genePred format
   -sample - File is in sample format
   -bedPlus=N - File is bed N+ format
   -positions - File is in browser "position" format
   -hasBin - File has bin value (used only with -bedPlus)
   -tab - Separate by tabs rather than space (used only with -bedPlus)
   -pslT - File is in psl format, map target side only
   -ends=N - Lift the first and last N bases of each record and combine the
             result. This is useful for lifting large regions like BAC end pairs.
   -minBlocks=0.N Minimum ratio of alignment blocks or exons that must map
                  (default 1.00)
   -fudgeThick    (bed 12 or 12+ only) If thickStart/thickEnd is not mapped,
                  use the closest mapped base.  Recommended if using
                  -minBlocks.
   -multiple               Allow multiple output regions
   -minChainT, -minChainQ  Minimum chain size in target/query, when mapping
                           to multiple output regions (default 0, 0)
   -minSizeT               deprecated synonym for -minChainT (ENCODE compat.)
   -minSizeQ               Min matching region size in query with -multiple.
   -chainTable             Used with -multiple, format is db.tablename,
                               to extend chains from net (preserves dups)
   -errorHelp              Explain error messages
CrossMap command usage
[zhangqf7@loginview02 danRer7]$ CrossMap.py
Program: CrossMap (v0.2.5)

Description:
  CrossMap is a program for convenient conversion of genome coordinates and
  genomeannotation files between assemblies (eg. lift from human hg18 to hg19 or
  vice versa).It supports file in BAM, SAM, BED, Wiggle, BigWig, GFF, GTF and VCF
  format.

Usage: CrossMap.py <command> [options]

  bam   convert alignment file in BAM or SAM format.
  bed   convert genome cooridnate or annotation file in BED or BED-like format.
  bigwig        convert genome coordinate file in BigWig format.
  gff   convert genome cooridnate or annotation file in GFF or GTF format.
  vcf   convert genome coordinate file in VCF format.
  wig   convert genome coordinate file in Wiggle, or bedGraph format.
Issues
1. bigWig file reduced dramatically using CrossMap
CrossMap supports more file formats than liftOver, like wig/bigWig. However, when I use CrossMap to convert a bigWig file, the output file seems much smaller.
# download phastCons score of zebrafish (only z7 provide)
# link: //hgdownload.cse.ucsc.edu/goldenPath/danRer7/phastCons8way/
# currently there is no z10 version: https://www.biostars.org/p/282330/

# convert from z7 to z10
# output: fish.phastCons8way.bw.bgr, fish.phastCons8way.bw.bw, fish.phastCons8way.bw.sorted.bgr
[zhangqf7@bnode02 conservation]$ CrossMap.py bigwig danRer7ToDanRer10.over.chain.gz danRer7/fish.phastCons8way.bw danRer10/fish.phastCons8way.bw
@ 2018-08-27 20:39:45: Read chain_file:  danRer7ToDanRer10.over.chain.gz
@ 2018-08-27 20:39:49: Liftover bigwig file: danRer7/fish.phastCons8way.bw ==> danRer10/fish.phastCons8way.bw.bgr
@ 2018-08-27 20:51:54: Merging overlapped entries in bedGraph file ...
@ 2018-08-27 20:51:54: Sorting bedGraph file:danRer10/fish.phastCons8way.bw.bgr
@ 2018-08-27 20:53:42: Convert wiggle to bigwig ...

# the converted .bw file is much smaller
[zhangqf7@loginview02 conservation]$ ll danRer7/fish.phastCons8way.bw
-rw-rw----+ 1 zhangqf7 zhangqf 757M Jan 20  2011 danRer7/fish.phastCons8way.bw
[zhangqf7@loginview02 conservation]$ ll danRer10/fish.phastCons8way.bw.bw
-rw-rw----+ 1 zhangqf7 zhangqf 22M Aug 27 20:53 danRer10/fish.phastCons8way.bw.bw

# convert z7 .bw to .bedgraph directly to check the line number
[zhangqf7@bnode02 danRer7]$ bigWigToBedGraph fish.phastCons8way.bw fish.phastCons8way.bgr
[zhangqf7@bnode02 danRer7]$ ll
total 8.1G
-rw-rw----+ 1 zhangqf7 zhangqf 5.5G Aug 27 21:59 fish.phastCons8way.bgr
-rw-rw----+ 1 zhangqf7 zhangqf 757M Jan 20  2011 fish.phastCons8way.bw
[zhangqf7@loginview02 conservation]$ wl danRer7/fish.phastCons8way.bgr
201830335 danRer7/fish.phastCons8way.bgr

# the convertd .bedgraph file line number is much smaller
[zhangqf7@loginview02 conservation]$ wl danRer10/fish.phastCons8way.bw.sorted.bgr
3213494 danRer10/fish.phastCons8way.bw.sorted.bgr
Read full-text »
线性回归
2018-08-27
概述
- 基本概念:
- 线性回归(linear regression):预测数值型的目标值。
- 回归方程(regression equation):依据输入写出一个目标值的计算公式。
- 回归系数(regression weights):方程中的不同特征的权重值。
- 回归:求解回归系数的过程。
- “回归”来历:Francis Galton在1877年,根据上一代豌豆种子的尺寸预测下一代的尺寸。没有提出回归的概念,但是采用了这个思想(或者叫研究方法)。
- 直接求解:
- 找出使得误差最小的\(w\)。误差:预测值和真实值之间的差值,如果简单累加,正负将低效,一般使用平方误差。
- 平方误差:\(\sum_{i=1}^{m}{(y_i - {x_i}^T w)^2}\)
- 矩阵表示:\((y - Xw)^T(y-Xw)\)
- 矩阵求导:通过对\(w\)求导(导数=\(X^T(y-Xw)\))
- 导数求解:当其导数=0时,即求解得到\(w\):\(w = (X^TX)^{-1}X^Ty\)
- 【注意】:\(X^TX^{-1}\)需要对矩阵求逆,所以只适用于逆矩阵存在的时候(需判断逆矩阵是否存在)。Numpy库含有求解的矩阵方法,称作普通最小二乘法(OLS,ordinary least squares)。
- 判断回归的好坏?
- 局部加权线性回归
- 直线拟合建模潜在问题:有可能局部数据不满足线性关系,欠拟合现象
- 局部调整:引入偏差,降低预测的均方误差
- 局部加权线性回归(Locally Weighted Linear Regression,LWLR):给待预测点附近的每个点赋予一定权重,在这个子集(待预测点及附近的点)上基于最小均方差进行普通回归。
- 使用核对附近点赋予更高权重,常用的是高斯核,其对应的权重如下: \(w(i,j) = exp{(\frac{\|x^i-x\|}{-2k^2})}\),距离预测点越近,则权重越大。这里需要指定的是参数k(唯一需要考虑的参数),决定了对附近的点赋予多大权重。
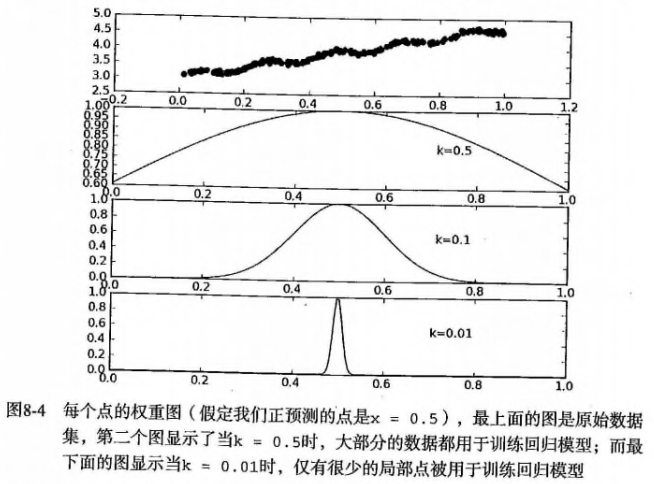
- 使用不同的k时,局部加权(平滑)的效果是不同的,当k太小时可能会过拟合:
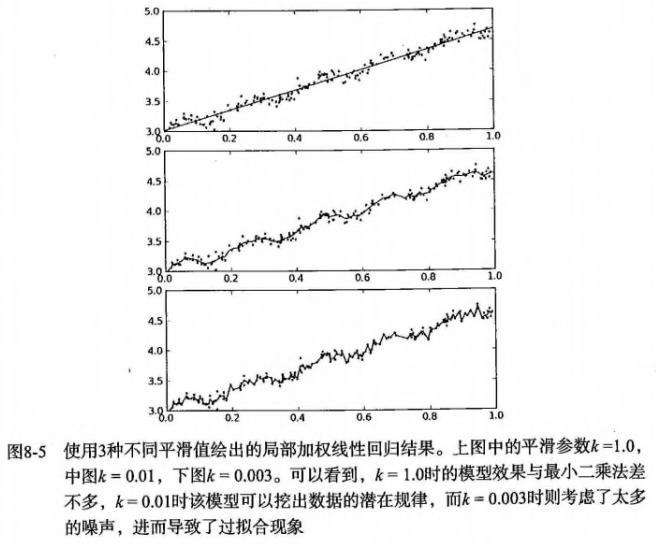
- 【注意】:局部加权对于每一个预测,都需要重新计算加权值?因为输入除了x、y还需要指定预测的点(\(x_i\)),增加了计算量(但其实很多时候大部分的数据点的权重接近于0,如果可以避免这些计算,可减少运行时间)。
- 缩减系数
-
问题:数据特征(n)比样本数目(m)还大(矩阵X不是满秩矩阵),怎么办?前面的方法不行,因为计算\(X^TX^{-1}\)会出错
- 岭回归(ridge regression):在矩阵\(X^TX\)加入\(lambda*I\)使得矩阵非奇异,从而能对\(X^T + lambda*I\)求逆矩阵。
- I:mxm的单位矩阵,对角线元素全为1,其他全为0。值1贯穿整个对角线,在0构成的平面上形成一条1的岭,所以称为岭回归。
- lambda:用户定义数值。可以通过不同的尝试,最后选取使得预测误差最小的lambda。
- 回归系数:\(w = (X^TX + lambda*I)^{-1}X^Ty\)
- 用途:1)处理特征数多于样本数的情况,2)在估计中引入偏差
- 缩减(shrinkage):引入参数lambda限制所有w的和,lambda作为引入的惩罚项,能减少不重要的参数,这个技术称为缩减。
-
其他缩减方法:lasso、LAR、PCA回归、子集选择
- lasso法:效果好、计算复杂
- 岭回归增加如下约束则回归结果和普通回归一样:\(\sum_{k=1}^{n}w_k^2 <= lambda\),此时限定回归系数的平方和不大于lambda。
-
lasso限定:\(\sum_{k=1}^{n}\|w_k\| <= lambda\),使用绝对值进行限定。当lambda足够小时,很多权重值会被限定为0,从而减少特征,更好的理解数。但是同时也增加了计算的复杂度。
- 前向逐步回归:效果与lasso接近,实现更简单。
- 原理:每一步尽可能减少误差(贪心算法),初始化所有权重为1,每一步对某一个权重增加或减少很小的值,使得误差减小。【在随机梯度下降里面,每次是同时更新所有的权重】
- 需要指定参数:x,y,eps(每次迭代需要调整的步长),numIt(迭代次数)
- 好处是利于理解数据,权重接近于0的特征可能是不重要的。
-
- 权衡偏差与方差
- 误差:预测值和测量值之间存在的差异【模型效果是否好,复杂度低效果不太好,复杂度高效果可能好偏差低】
- 误差来源:偏差、测量误差和随机噪声
- 缩减:增大模型偏差的例子,某些特征回归系数设为0,减少模型的复杂度
- 方差:从总体中选取一个子集训练得到一个模型,从总体中选取另外一个子集训练得到另外一个模型,模型系数之间的差异就反应了模型方差的大小。【模型是否稳定,复杂度低则稳定,复杂度高则不稳定(过拟合的)】
实现
标准回归(可直接矩阵求解):
# 注意判断矩阵是否可逆
def standRegres(xArr,yArr):
    xMat = mat(xArr); yMat = mat(yArr).T
    xTx = xMat.T*xMat
    if linalg.det(xTx) == 0.0:
        print "This matrix is singular, cannot do inverse"
        return
    ws = xTx.I * (xMat.T*yMat)
    return ws
标准回归(statsmodels’ module OLS and sklearn):
import statsmodels.api as sm

X=df[df.columns].values
y=target['MEDV'].values

#add constant
X=sm.add_constant(X)

# build model
model=sm.OLS(y,X).fit()

prediction=model.predict(X)

print(model.summary())
from sklearn import linear_model

lm = linear_model.LinearRegression()
model = lm.fit(X,y)

y_pred = lm.predict(X)

lm.score(X,y)

lm.coef_
lm.intercept_<br><br>evaluation(y,y_pred)
局部加权线性回归:
def lwlr(testPoint,xArr,yArr,k=1.0):
    xMat = mat(xArr); yMat = mat(yArr).T
    m = shape(xMat)[0]
    weights = mat(eye((m)))
    for j in range(m):                      #next 2 lines create weights matrix
        diffMat = testPoint - xMat[j,:]     #
        weights[j,j] = exp(diffMat*diffMat.T/(-2.0*k**2))
    xTx = xMat.T * (weights * xMat)
    if linalg.det(xTx) == 0.0:
        print "This matrix is singular, cannot do inverse"
        return
    ws = xTx.I * (xMat.T * (weights * yMat))
    return testPoint * ws
岭回归(使用缩减技术之前,先标准化不同的特征):
def ridgeRegres(xMat,yMat,lam=0.2):
    xTx = xMat.T*xMat
    denom = xTx + eye(shape(xMat)[1])*lam
    if linalg.det(denom) == 0.0:
        print "This matrix is singular, cannot do inverse"
        return
    ws = denom.I * (xMat.T*yMat)
    return ws

def ridgeTest(xArr,yArr):
    xMat = mat(xArr); yMat=mat(yArr).T
    yMean = mean(yMat,0)
    yMat = yMat - yMean     #to eliminate X0 take mean off of Y
    #regularize X's
    xMeans = mean(xMat,0)   #calc mean then subtract it off
    xVar = var(xMat,0)      #calc variance of Xi then divide by it
    xMat = (xMat - xMeans)/xVar
    numTestPts = 30
    wMat = zeros((numTestPts,shape(xMat)[1]))
    for i in range(numTestPts):
        ws = ridgeRegres(xMat,yMat,exp(i-10))
        wMat[i,:]=ws.T
    return wMat
岭回归(sklearn):
from sklearn.linear_model import Ridge

ridge_reg = Ridge(alpha=1, solver="cholesky")
ridge_reg.fit(X, y)

y_pred=ridge_reg.predict(X)

evaluation(y,y_pred,index_name='ridge_reg')
Lasso回归(sklearn):
from sklearn.linear_model import Lasso

lasso_reg = Lasso(alpha=0.1)
lasso_reg.fit(X, y)
y_pred=lasso_reg.predict(X)
evaluation(y,y_pred,index_name='lasso_reg')
前向逐步回归:
def stageWise(xArr,yArr,eps=0.01,numIt=100):
    xMat = mat(xArr); yMat=mat(yArr).T
    yMean = mean(yMat,0)
    yMat = yMat - yMean     #can also regularize ys but will get smaller coef
    xMat = regularize(xMat)
    m,n=shape(xMat)
    #returnMat = zeros((numIt,n)) #testing code remove
    ws = zeros((n,1)); wsTest = ws.copy(); wsMax = ws.copy()
    for i in range(numIt):
        print ws.T
        lowestError = inf;
        for j in range(n):
            for sign in [-1,1]:
                wsTest = ws.copy()
                wsTest[j] += eps*sign
                yTest = xMat*wsTest
                rssE = rssError(yMat.A,yTest.A)
                if rssE < lowestError:
                    lowestError = rssE
                    wsMax = wsTest
        ws = wsMax.copy()
        #returnMat[i,:]=ws.T
    #return returnMat
多项式回归(sklearn):
from sklearn.preprocessing import PolynomialFeatures

poly_reg = PolynomialFeatures(degree = 4)
X_Poly = poly_reg.fit_transform(X)

lin_reg_2 =linear_model.LinearRegression()
lin_reg_2.fit(X_Poly, y)


y_pred=lin_reg_2.predict(poly_reg.fit_transform(X))

evaluation(y,y_pred,index_name=['poly_reg'])
弹性网络回归(sklearn):
enet_reg = linear_model.ElasticNet(l1_ratio=0.7)

enet_reg.fit(X,y)

y_pred=enet_reg.predict(X)
evaluation(y,y_pred,index_name='enet_reg ')
参考
- 机器学习实战第8章
- 你应该掌握的 7 种回归模型!@知乎
- 45 questions to test a Data Scientist on Regression (Skill test – Regression Solution)
- 五种回归方法的比较
Read full-text »
集成算法和AdaBoost
2018-08-25
目录
集成算法
例子:股票推荐
问题:多个朋友推荐股票的走势,分别是\(g_1, g_2, ..., g_t\),如何选择(如何确定\(g_t(x)\))?
方案:
| 编号 | 做法 | 类别 |
|---|---|---|
| 1 | 从T个选择最信任的对股票预测能力最强的一个 | validation,犯错最小模型 |
| 2 | 都比较厉害,同时考虑T个朋友建议,投票表决 | uniformly |
| 3 | 水平不一,同时考虑T个朋友建议,投票表决,但是投票权重不一样 | non-uniformly |
| 4 | 水平不一,同时考虑T个朋友建议,投票表决,但是投票权重不固定 | conditionally |
以上每种选择其实对应一个模型:
集成算法效果更好
例子:平面上有需分类的点,如果只用一条水平或竖直直线进行分类,无论如何达不到最佳分类效果。可使用集体智慧,及多条线的组合,比如图中的折线(一条水平线+两条竖直线),即可将点完全分开。
为什么效果更好:
- 将不同的模型均匀结合,提高power,相当于特征转换
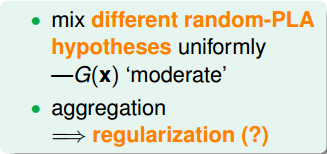
- 正则化效果:比如有多个模型选择,但是各种组合最后得到的是比较中庸、合适的(比如下图有很多不同的选择,但是黑色的是组合后最好的)
| 特征转换 | 正则化 |
|---|---|
 |
 |
好的集成需要基学习器“好而不同”
问题:一般经验中,如果把好坏的东西掺和在一起,通常会是比最坏的要好一些,比最好的要坏一些。集成学习为什么能比最好的单一学习器效果更好呢?
例子:
- (a)中每个分类器66.6%精度,集成的模型100%
- (b)中3个分类器没有差别,集成的也是一样的
- (c)每个分类器只有33.3%,集成后结果更糟糕

- 说明:好的集成,需要满足“好而不同”
- 个体学习器要有一定的准确性,不能太坏(c)
- 学习器之间具有差异(b)
理论分析:
- 二分类问题y={-1,1},基分类器错误率为\(\epsilon\)
- 每个基分类器\(h_i\)有:\(P(h_i(x) \neq f(x))=\epsilon\)
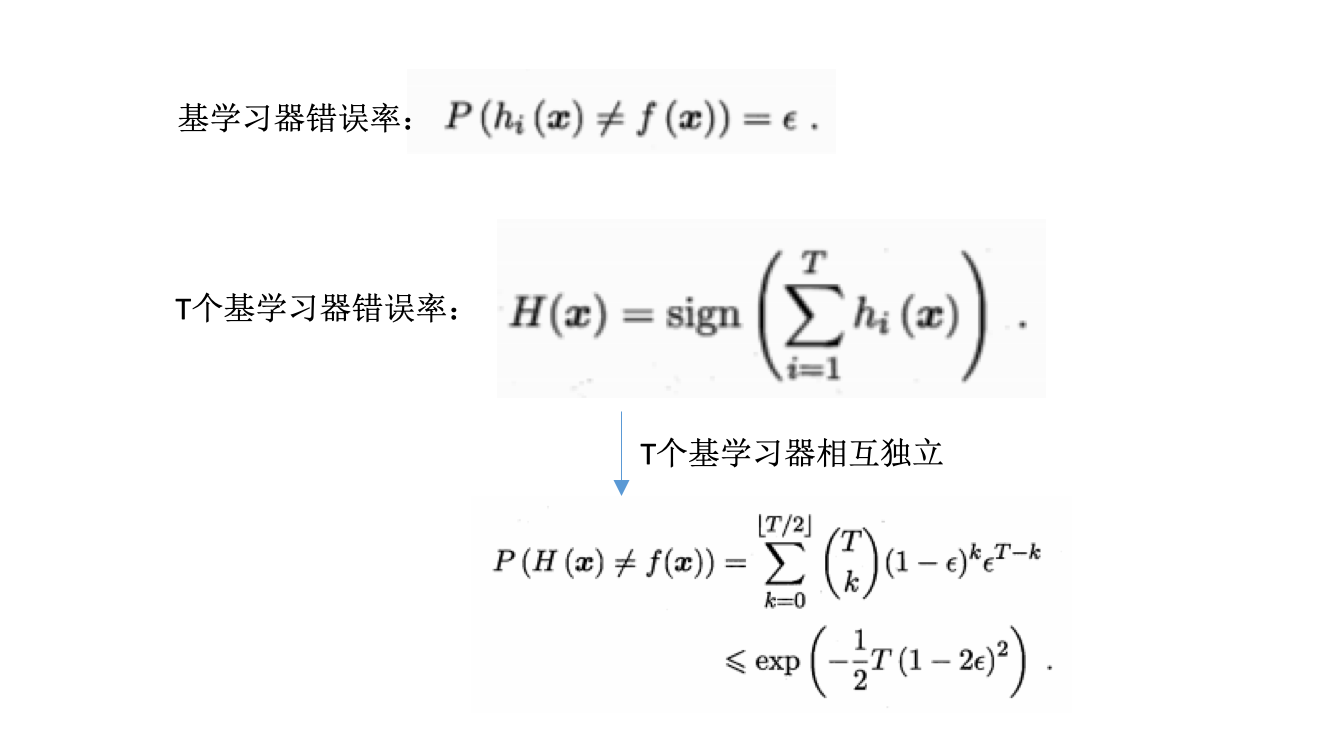
- 随着集成中个体分类器数目T的增大,集成的错误率将指数级下降,最终趋向于0.
误差-分歧(ambiguity)分解:
- 好:误差大小
-
不同:模型之间的分歧或者单个模型与整体模型的分歧
- 分歧:个体学习器在样本x上的不一致性
- 单个学习器的分歧:\(A(h_i\|x)=(h_i(x)-H(x))^2\)
-
集成学习器的分歧:\(\overline{A}(h\|x)=\sum_{i=1}^Tw_i(h_i\|x)=\sum_{i=1}^Tw_i(h_i(x)-H(x))^2\)
- 误差
- 单个学习器的误差:\(E(h_i\|x)=(f(x)-h_i(x))^2\)
-
集成学习器的误差:\(E(H\|x)=(f(x)-H(x))^2\)
- 个体学习器泛化误差的加权平均:\(\overline{E}=\sum_{i=1}^Tw_iE_i\)
- 个体学习器的加权分歧值:\(\overline{A}=\sum_{i=1}^Tw_iA_i\)
- 集成泛化误差:\(E=\overline{E} - \overline{A}\)
- 个体学习器的准确性越高(上面的\(\overline{E}\)越小)、多样性越大(上面的\(\overline{A}\)越大),则集成越好(上面的\(E\)越小)
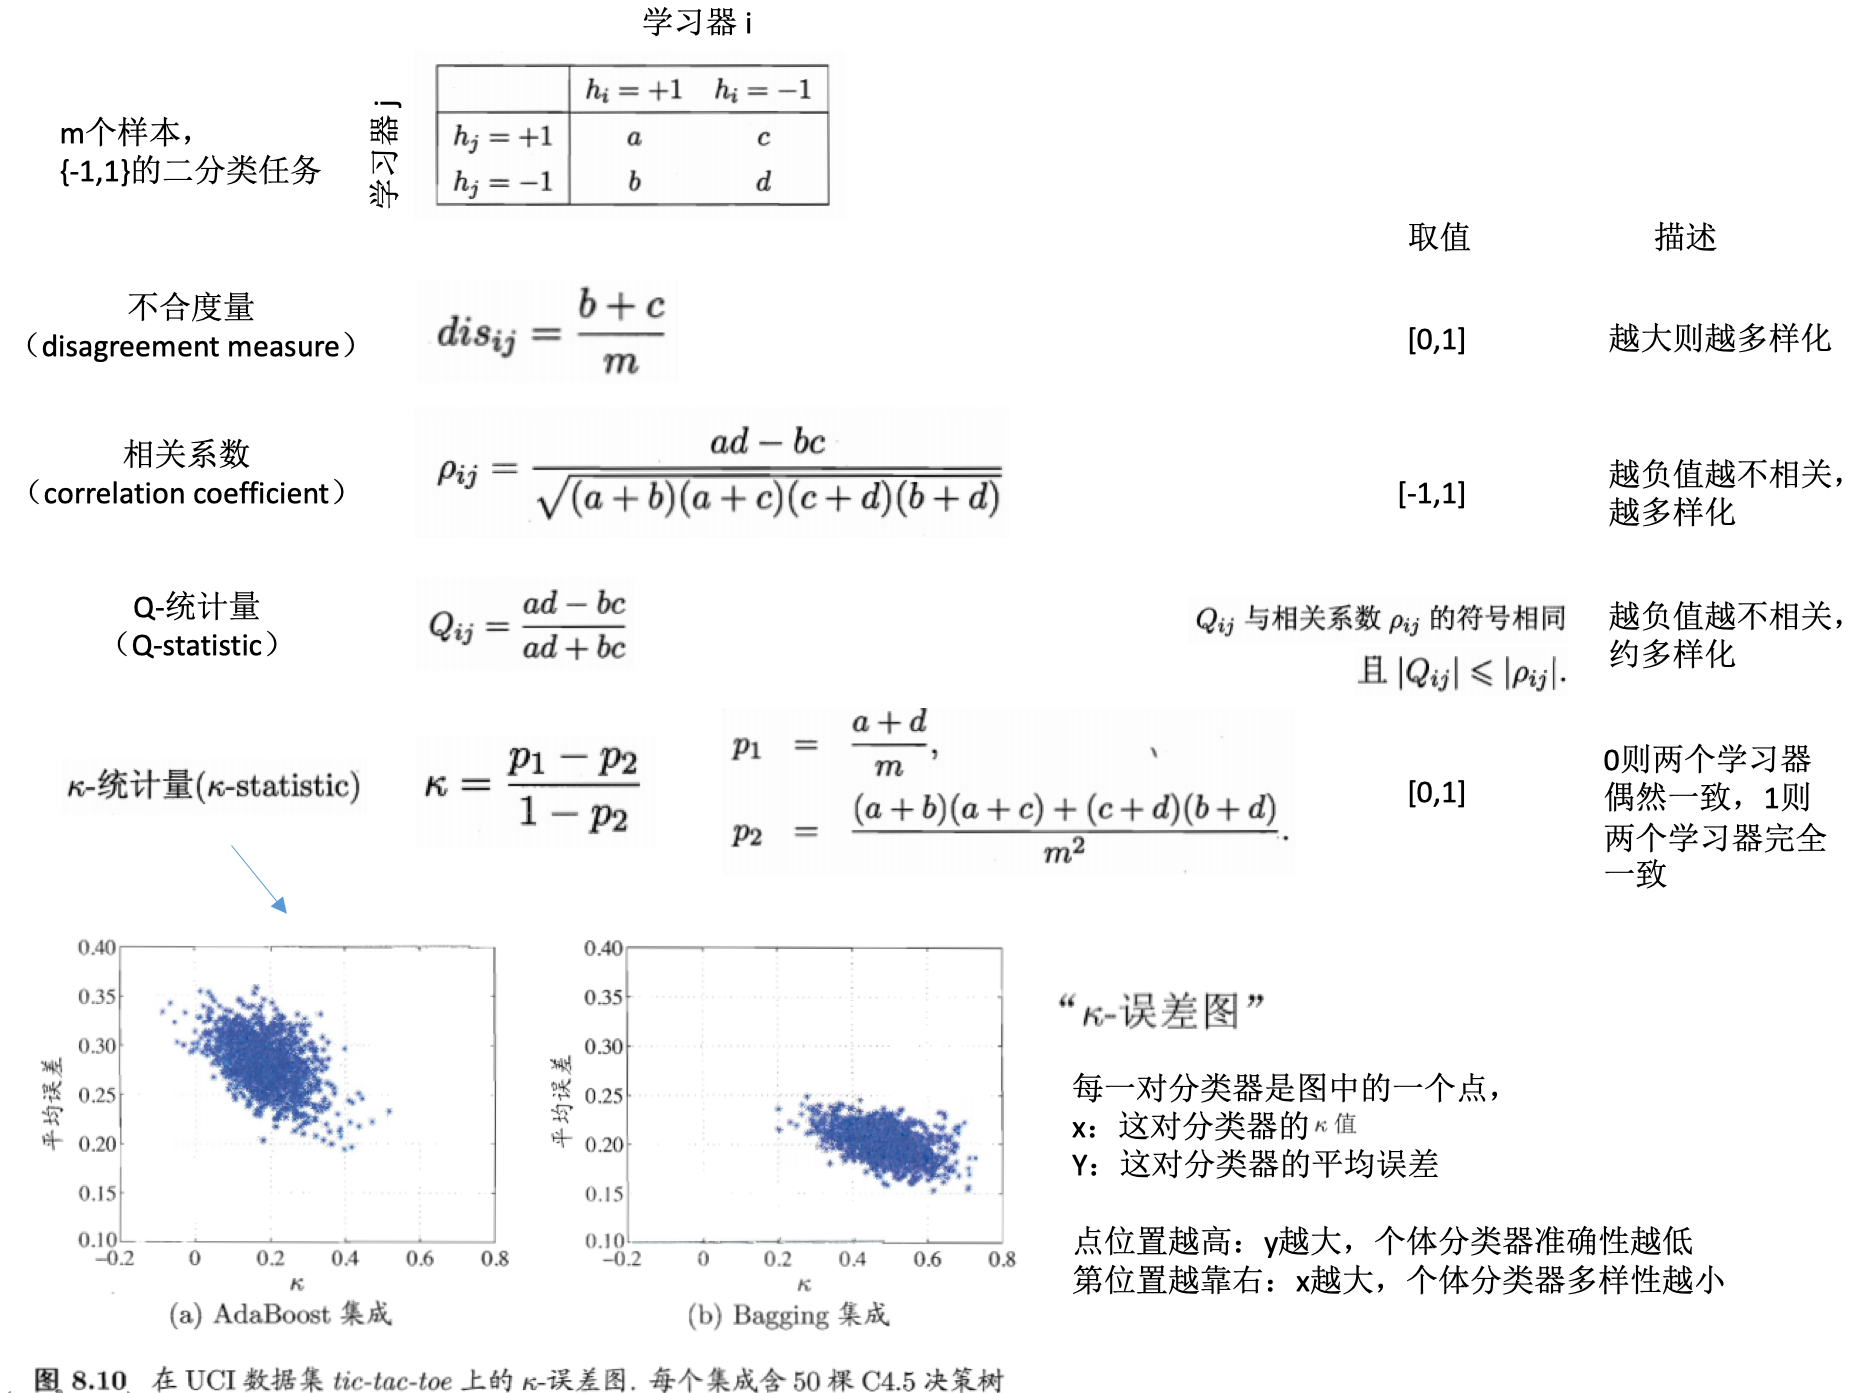
学习器多样性的度量
学习器多样性的增强
有不同的方法可以增强学习器的多样性:
- 核心思路:引入随机性
- 数据样本扰动:采样法
- 输入属性扰动:不同的子空间提供不同视角,随机子空间算法
- 输出表示扰动:对输出表示进行操纵,比如变动类标记,或者调制转换等
-
算法参数扰动:学习算法的参数设置差异
- 随机森林:使用了数据样本扰动和输入属性扰动
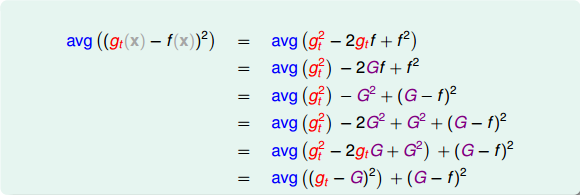
回归:多模型平均比单一模型效果更好的证明
在回归问题中,计算单个模型与真实值的差异,经过换算,可以表示为如下,即单个模型的差距是总的模型的差距,再加一个大于0的项,所以总的模型的差距是更小的:
不同类别的集成算法
集成算法(ensemble method):又叫元算法(meta-algorithm),将不同的分类器组合起来。
- 个体学习器的生成方式进行分类:
- 集成方式进行分类:
- 集成不同的算法
- 同一算法在不同设置下的集成
- 数据集不同部分分配给不同分类器之后的集成
uniform blending:权重相同
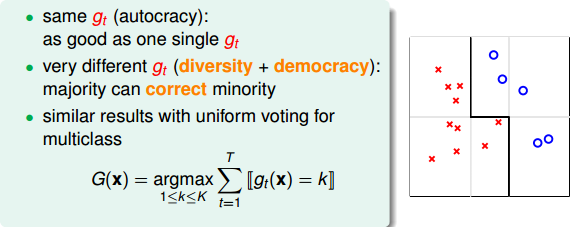
- 分类:每个模型权重为1,投票表决
- 每个\(g_t\)是一样的,此时跟选任意一个\(g_t\)效果一样
- 每个\(g_t\)有一些差别,投票表决
- 多分类,票数最多的一类
- 回归:所有的预测值求均值
- 每个\(g_t\)是一样的,此时跟选任意一个\(g_t\)计算是一样的
- 每个\(g_t\)有一些差别,求平均能消除不同的模型效果差异很大的情况
linear blending: 权重不同的线性组合

- 每个 g(t)的权重不同
- 如何确定权重?误差最小化思想

stacking(any blending):非线性组合
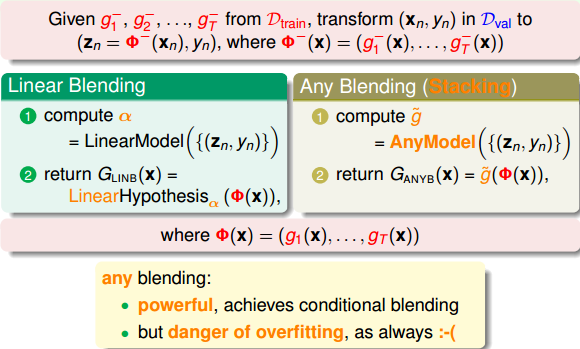
- G(t)是g(t)的任意组合:可以是非线性的
- 优点:提高模型复杂度,更好的预测模型
- 缺点:过拟合的危险。采用正则化。
如何得到不同的\(g_t\)
- 如何得到不同的\(g_t\),以用于模型的融合
- 不同的方法:
- 选取不同的模型
- 设置同一模型的不同参数
- 算法的随机性
- 选择不同的数据样本

\(g_t\)的结合策略
- 平均法:数值型输出(回归类型)
- 简单平均:每个学习器认为权重是一样的
- 加权平均:每个学习器有一个权重
- 投票法(voting):类别输出(分类任务)
- 绝对多数投票法:若某标记得票过半数,则预测为该标记;否则拒绝预测。
- 相对多数投票法:预测为得票最多的标记,若同时多个标记有相同最高票,随机选择一个。
-
加权投票法:类似加权平均,每个学习器有自己的权重,预测为得票最多的标记,若同时多个标记有相同最高票,随机选择一个。
- 每个学习器的输出类型
- 类标记:属于0或1类别,硬投票
- 类概率:输出某类的概率,软投票
- 学习法
- 训练数据很多
- 学习法:通过另一个学习器来进行结合
- 代表:stacking
- 初级学习器:个体学习器。相同则是同质的,不同则是异质的。
- 次级学习器(元学习器):用于结合的学习器
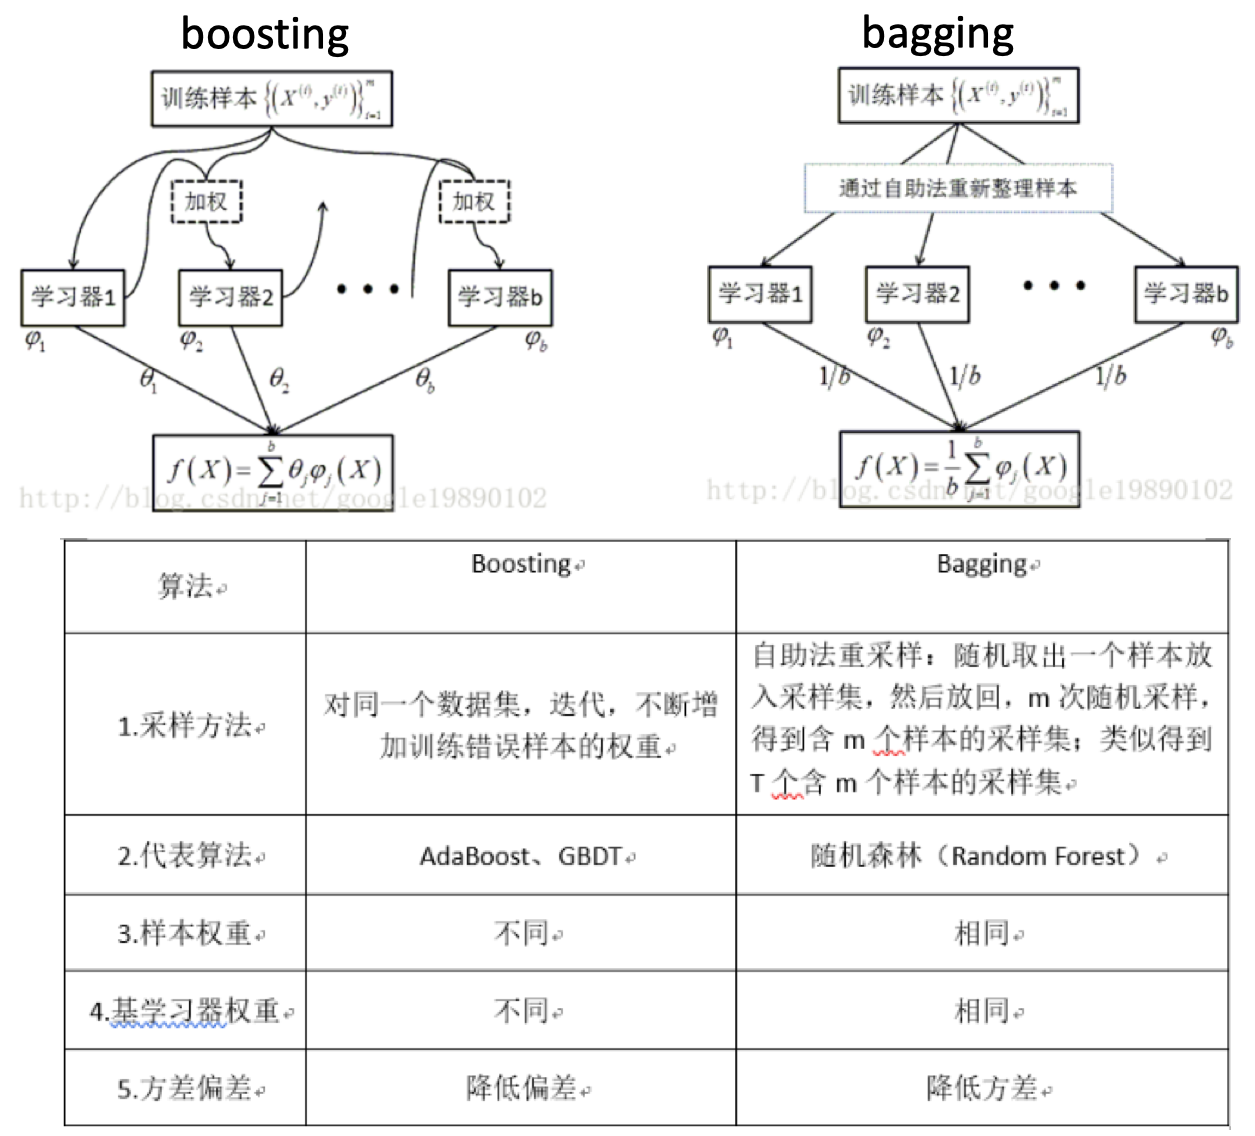
bagging vs random forest vs boosting
- bagging:
- 自举汇聚法(Bootstrap aggregating):从原始数据集选择S次以得到S个数据集。
- 每个数据集与原数据集大小相等,可以重复抽取。
- 训练:每个数据集训练一个模型,得到S个分类器模型。
- 预测:对于新数据,用S个分类器进行分类,然后投票,最多的分类即为最后的分类结果。若分类预测时出现两个类同样的票,最简单的做法是随机选择一个。
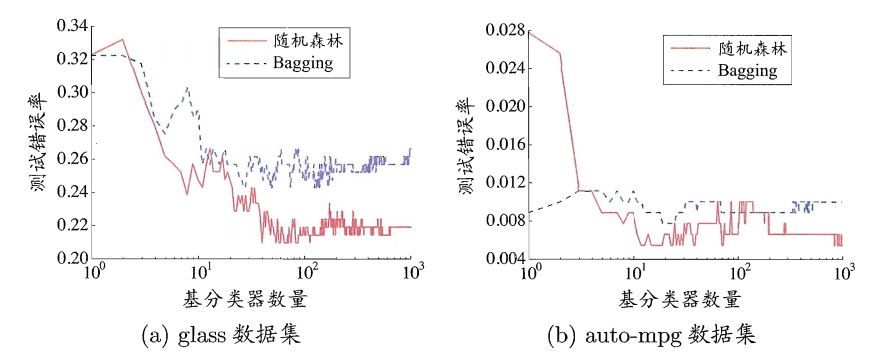
- bagging vs 随机森林:
- boosting:
AdaBoosting
- AdaBoosting:
- 加性模型(additive model):集学习器的线性组合
- 问题:使用弱分类器和数据集构建一个强分类器?弱是说模型的效果不太好,比随机好一点。
- AdaBoosting算法过程:
- 权重等值初始化:每个训练样本赋值一个权重,构成向量D;
- 第一次训练:训练一个弱分类器
- 第二次训练:在同一数据集上进行训练,只是此时的权重会发生改变。降低第一次分类对的样本的权重,增加分类错的权重。样本权重值更新的公式如下:
 。从这里可以看到,如果某个样本被分错了,则\(y_i * G_m(x_i)\)为负,负负得正,取指数后数值大于1,所以次样本权重值相对上一轮是增大的;如果某个样本被分对了,则\(y_i * G_m(x_i)\)为正,负正得负,取指数后数值小于1,所以次样本权重值相对上一轮是减小的。
 - ……
-
第n次训练:此时得到的模型是前n-1个模型的权重线性组合。当模型的分类错误率达到指定阈值(一般为0)时,即可停止训练,采用此时的分类器模型。比如3次训练即达到要求的模型最终是:\(G(x)=sign[f_3(x)]=sign[\alpha_1 * G_1(x) + \alpha_2 * G_2(x) + \alpha_3 * G_3(x)]\)

- 训练得到多个分类器,每个分类器的权重不等,权重值与其错误率相关。
- 错误率:\(\theta_m = \frac{分类错误的样本数目}{所有样本数目}\),其中\(m\)是第几次的训练。错误率是每一次训练结束后,此次的分类器的错误率,需要计算,因为这关乎到此分类器在最终的分类器里的权重。
- 分类器权重:\(\alpha_m = \frac{1}{2} ln(\frac{1-\theta_m}{\theta_m})\)。
- AdaBoosting算法示例:
- 这里以一个10个样本的数据集(每个样本1个特征),详细的解释了如何训练AdoBoost算法,及每一轮迭代中阈值的选取,样本权重值的更新,分类器错误率的计算,分类器权重值的计算等过程,可以参考。
- AdaBoosting算法损失函数:
- 这里的\(\theta_m\)就是分类器的权重值(即上面的\(\alpha_m\))
 。要求解使得该函数最小化,可以采用前向分步算法(forward stagewise)策略:从前向后,每一步只学习一个基函数及其系数。
- 这里的\(\theta_m\)就是分类器的权重值(即上面的\(\alpha_m\))
AdaBoost:Python源码版本
构建多个单层决策树的例子,比如对于一组数据样本(包含两个类别),具有两个特征,如何区分开来?
stumpClassify:对于样本指定的特征,基于一个阈值,对样本进行分类,比如高于这个阈值的设置为-1(取决于判断符号threshIneq)buildStump:对于样本、类别、权重D,构建一个多决策树。对样本的每一个特征进行查看,在每一个特征的取值范围内不断的尝试不同的阈值进行分类,同时不停的更新权重矩阵D,最终的目的是找到使得分类错误率最小时的特征、特征阈值、判断符号(大于还是小于,为啥这个会有影响?)。
def stumpClassify(dataMatrix,dimen,threshVal,threshIneq):#just classify the data
    retArray = ones((shape(dataMatrix)[0],1))
    if threshIneq == 'lt':
        retArray[dataMatrix[:,dimen] <= threshVal] = -1.0
    else:
        retArray[dataMatrix[:,dimen] > threshVal] = -1.0
    return retArray

def buildStump(dataArr,classLabels,D):
    dataMatrix = mat(dataArr); labelMat = mat(classLabels).T
    m,n = shape(dataMatrix)
    numSteps = 10.0; bestStump = {}; bestClasEst = mat(zeros((m,1)))
    minError = inf #init error sum, to +infinity
    for i in range(n):#loop over all dimensions
        rangeMin = dataMatrix[:,i].min(); rangeMax = dataMatrix[:,i].max();
        stepSize = (rangeMax-rangeMin)/numSteps
        for j in range(-1,int(numSteps)+1):#loop over all range in current dimension
            for inequal in ['lt', 'gt']: #go over less than and greater than
                threshVal = (rangeMin + float(j) * stepSize)
                predictedVals = stumpClassify(dataMatrix,i,threshVal,inequal)#call stump classify with i, j, lessThan
                errArr = mat(ones((m,1)))
                errArr[predictedVals == labelMat] = 0
                weightedError = D.T*errArr  #calc total error multiplied by D
                #print "split: dim %d, thresh %.2f, thresh ineqal: %s, the weighted error is %.3f" % (i, threshVal, inequal, weightedError)
                if weightedError < minError:
                    minError = weightedError
                    bestClasEst = predictedVals.copy()
                    bestStump['dim'] = i
                    bestStump['thresh'] = threshVal
                    bestStump['ineq'] = inequal
    return bestStump,minError,bestClasEst
AdaBoost:sklearn版本
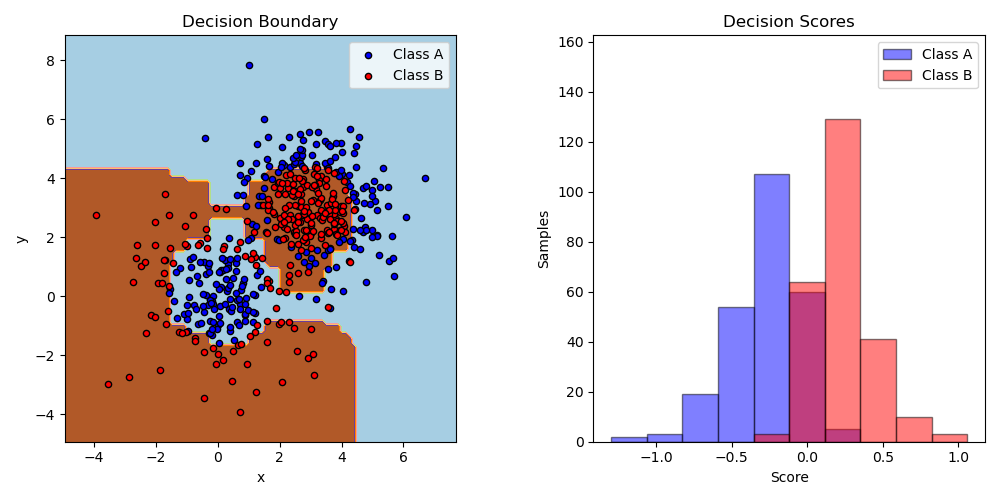
sklearn给出了一个二分类的例子,首先生成了一个数据集,两个高斯分布混合而成的。这些样本是线性不可分的,使用AdaBoost算法,构建基于决策树的分类器,可以很好的区分开来:
import numpy as np
import matplotlib.pyplot as plt

from sklearn.ensemble import AdaBoostClassifier
from sklearn.tree import DecisionTreeClassifier
from sklearn.datasets import make_gaussian_quantiles


# Construct dataset
X1, y1 = make_gaussian_quantiles(cov=2.,
                                 n_samples=200, n_features=2,
                                 n_classes=2, random_state=1)
X2, y2 = make_gaussian_quantiles(mean=(3, 3), cov=1.5,
                                 n_samples=300, n_features=2,
                                 n_classes=2, random_state=1)
X = np.concatenate((X1, X2))
y = np.concatenate((y1, - y2 + 1))

# Create and fit an AdaBoosted decision tree
bdt = AdaBoostClassifier(DecisionTreeClassifier(max_depth=1),
                         algorithm="SAMME",
                         n_estimators=200)

bdt.fit(X, y)

plot_colors = "br"
plot_step = 0.02
class_names = "AB"

plt.figure(figsize=(10, 5))

# Plot the decision boundaries
plt.subplot(121)
x_min, x_max = X[:, 0].min() - 1, X[:, 0].max() + 1
y_min, y_max = X[:, 1].min() - 1, X[:, 1].max() + 1
xx, yy = np.meshgrid(np.arange(x_min, x_max, plot_step),
                     np.arange(y_min, y_max, plot_step))

Z = bdt.predict(np.c_[xx.ravel(), yy.ravel()])
Z = Z.reshape(xx.shape)
cs = plt.contourf(xx, yy, Z, cmap=plt.cm.Paired)
plt.axis("tight")

# Plot the training points
for i, n, c in zip(range(2), class_names, plot_colors):
    idx = np.where(y == i)
    plt.scatter(X[idx, 0], X[idx, 1],
                c=c, cmap=plt.cm.Paired,
                s=20, edgecolor='k',
                label="Class %s" % n)
plt.xlim(x_min, x_max)
plt.ylim(y_min, y_max)
plt.legend(loc='upper right')
plt.xlabel('x')
plt.ylabel('y')
plt.title('Decision Boundary')
参考
- 机器学习实战第7章
- 机器学习周志华第8章
- 决策树、GBDT、XGBoost和LightGBM之GBDT
- Adaboost 算法的原理与推导
- Boosting algorithm: AdaBoost
Read full-text »
Python machine learning tricks
2018-08-21
目录
- 目录
- Extract clusters from seaborn clustermap stackoverflow
- 指定运行的CPU数目
- 数据并行时报错:NN module weights are not part of single contiguous chunk of memory
- 为什么RNN/LSTM很慢
- 异常值处理:Tukey’s Method
- PCA
- Python3.7sklearn包中缺失Imputer函数
- 保存模型到pickle并后续load
Extract clusters from seaborn clustermap stackoverflow
### direct call from clustermap
df = pd.read_csv(txt, header=0, sep='\t', index_col=0)
fig, ax = plt.subplots(figsize=(25,40))
sns.clustermap(df, standard_scale=False, row_cluster=True, col_cluster=True, figsize=(25, 40), yticklabels=False)
savefn = txt.replace('.txt', '.cluster.png')
plt.savefig(savefn)
plt.close()

### calc linkage in hierarchy
df_array = np.asarray(df)
row_linkage = hierarchy.linkage(distance.pdist(df), method='average')
col_linkage = hierarchy.linkage(distance.pdist(df.T), method='average')

fig, ax = plt.subplots(figsize=(25,40))
sns.clustermap(df, row_linkage=row_linkage, col_linkage=col_linkage, standard_scale=False, row_cluster=True, col_cluster=True, figsize=(25, 40), yticklabels=False, method="average")
savefn = txt.replace('.txt', '.cluster.png')
plt.savefig(savefn)
plt.close()
hierarchy.fcluster can be used to extract clusters based on max depth or cluster num as illustrated here:
### max depth
from scipy.cluster.hierarchy import fcluster
max_d = 50
clusters = fcluster(Z, max_d, criterion='distance')
clusters

array([2, 2, 2, 2, 2, 2, 2, 2, 2, 2, 2, 2, 2, 2, 2, 2, 2, 2, 2, 2, 2, 2, 2,
       2, 2, 2, 2, 2, 2, 2, 2, 2, 2, 2, 2, 2, 2, 2, 2, 2, 2, 2, 2, 2, 2, 2,
       2, 2, 2, 2, 2, 2, 2, 2, 2, 2, 2, 2, 2, 2, 2, 2, 2, 2, 2, 2, 2, 2, 2,
       2, 2, 2, 2, 2, 2, 2, 2, 2, 2, 2, 2, 2, 2, 2, 2, 2, 2, 2, 2, 2, 2, 2,
       2, 2, 2, 2, 2, 2, 2, 2, 1, 1, 1, 1, 1, 1, 1, 1, 1, 1, 1, 1, 1, 1, 1,
       1, 1, 1, 1, 1, 1, 1, 1, 1, 1, 1, 1, 1, 1, 1, 1, 1, 1, 1, 1, 1, 1, 1,
       1, 1, 1, 1, 1, 1, 1, 1, 1, 1, 1, 1], dtype=int32)

### user defined cluster number
k=2
fcluster(Z, k, criterion='maxclust')
Assign cluster id and plot (stackoverflow):
fcluster = hierarchy.fcluster(row_linkage, 10, criterion='maxclust')
lut = dict(zip(set(fcluster), sns.hls_palette(len(set(fcluster)), l=0.5, s=0.8)))
row_colors = pd.DataFrame(fcluster)[0].map(lut)

sns.clustermap(df, row_linkage=row_linkage, col_linkage=col_linkage,
				  standard_scale=False, row_cluster=True, col_cluster=False,
				  figsize=(50, 80), yticklabels=False, method="average",
				  cmap=cmap, row_colors=[row_colors])
指定运行的CPU数目
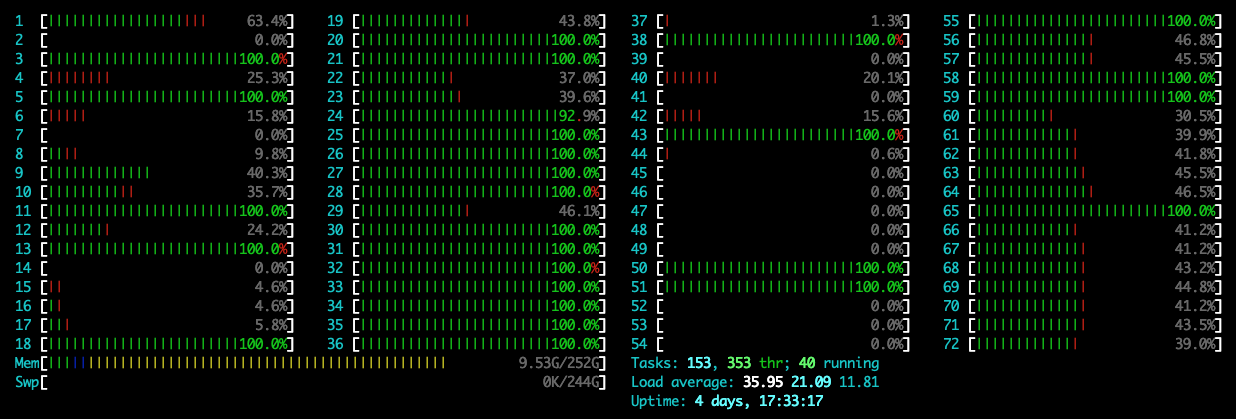
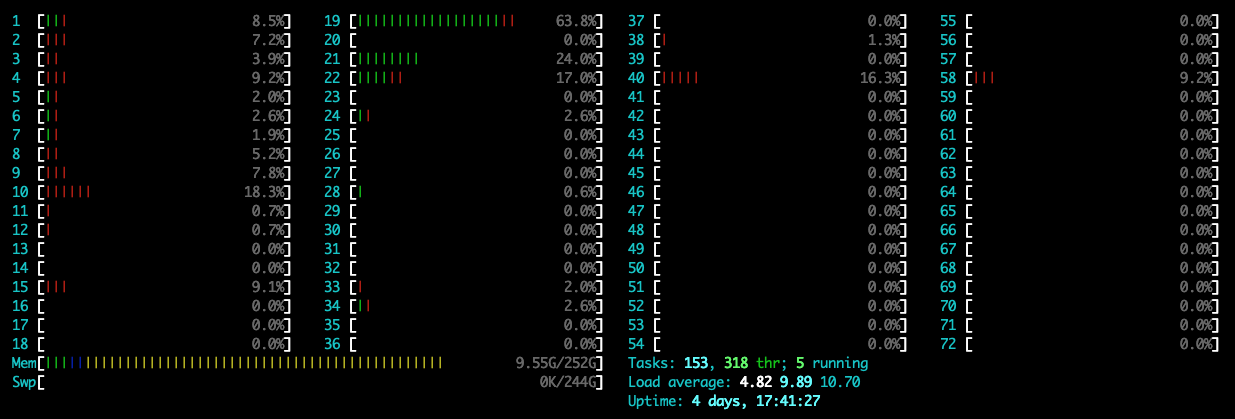
在新版本的pytorch里面,在运行程序时可能默认使用1个CPU的全部核,导致其他用户不能正常使用,可通过指定参数OMP_NUM_THREADS=1设置运行时使用的核数,下面是加和不加时的CPU监视截图:
不指定:
指定:
可以看到,在指定时,只使用了1个核,此时的CPU使用率是100%左右;在不指定时,CPU使用率到达了3600%,此时默认使用了36个核。具体命令如下:
# CUDA_VISIBLE_DEVICES: 指定GPU核
# OMP_NUM_THREADS: 指定使用的CPU核数
time CUDA_VISIBLE_DEVICES=0 OMP_NUM_THREADS=1 python $script_dir/main.py
数据并行时报错:NN module weights are not part of single contiguous chunk of memory
参考这里
# 之前
out1, _ = self.lstm(x, (h0, c0))

# 之后
self.lstm.flatten_parameters()
out1, _ = self.lstm(x, (h0, c0))
为什么RNN/LSTM很慢
在最近搭建的LSTM模型中,即使使用上了GPU,运行花费时间还是很长。模型不是很大,一个卷积层+一个resblock+一个LSTM,序列长度为100,使用双向的LSTM,两层、hidden size是128,基本运行需要10+h小时的时间,每一个epoch花费接近3min。有一些关于为什么LSTM运行很慢的文章(比如知乎帖子rnn为什么训练速度慢),可以参考一下,主要是:
- 每一个时间点的计算,依赖于上一时间点,不能并行
- 计算量大。计算复杂度:O(seq_len),序列越长越明显,且RNN内部使用的是全连接结构。
- 每个时间点还有1个memory I/O的操作
最近有个SRU的模块,可以实现如CNN级别的速度训练RNN网络,在github上star数目还挺高的,可以参考一下。
异常值处理:Tukey’s Method
- 计算异常值步进,即1.5倍的四分位数范围
- 所有IQR外超过异常值步进的数据定义为异常值并去除
for feature in log_data.keys():
    Q1 = np.percentile(log_data[feature], 25)
    Q3 = np.percentile(log_data[feature], 75)
    step = 1.5 * (Q3 - Q1)

    print("特征'{}'的异常值包括:".format(feature))
    display(log_data[~((log_data[feature] >= Q1 - step) & (log_data[feature] <= Q3 + step))])

outliers  = [95, 338, 86, 75, 161, 183, 154] # 选择需要删除的异常值index

good_data = log_data.drop(log_data.index[outliers]).reset_index(drop = True) #删除选择的异常值
PCA
参考这里:Feature/Variable importance after a PCA analysis,下面是一个完整的函数,并给出每个特征的重要性及可解释比例:
def PCA_df(df, n_components=6):
    from sklearn.decomposition import PCA
    pca = PCA(n_components=n_components)
    pca.fit(df)

    df_pc = pca.transform(df)

    # number of components
    n_pcs= pca.components_.shape[0]

    # get the index of the most important feature on EACH component
    # LIST COMPREHENSION HERE
    most_important = [np.abs(pca.components_[i]).argmax() for i in range(n_pcs)]
    # print('feature index of importance from 1st to last', most_important)

    initial_feature_names = df.columns
    # get the names
    most_important_names = [initial_feature_names[most_important[i]] for i in range(n_pcs)]

    # LIST COMPREHENSION HERE AGAIN
    dic = {'PC{}'.format(i): most_important_names[i] for i in range(n_pcs)}

    # build the dataframe
    feature_importance_df = pd.DataFrame(dic.items())

    feature_importance_df.columns = ['PC', 'Names']
    feature_importance_df['Column_index'] = most_important
    feature_importance_df['Explained_variance_ratio'] = pca.explained_variance_ratio_
    feature_importance_df['Singular_values'] = pca.singular_values_
    display(feature_importance_df)

    return feature_importance_df
Python3.7sklearn包中缺失Imputer函数
参考这里:
import numpy as np
import sklearn
from sklearn import preprocessing
from sklearn.preprocessing import Imputer
Traceback (most recent call last):
  File "<stdin>", line 1, in <module>
ImportError: cannot import name 'Imputer' from 'sklearn.preprocessing' (E:\python\lib\site-packages\sklearn\preprocessing\__init__.py)

# 现在
# https://scikit-learn.org/stable/modules/impute.html#impute
from sklearn.impute import SimpleImputer

imp = SimpleImputer()
imp.fit([[1, 2],
         [np.nan, 3],
         [7, 6]])
imp.transform([[np.nan, 2],
               [6, np.nan]])
保存模型到pickle并后续load
参考这里:
X_train, X_test, Y_train, Y_test = model_selection.train_test_split(X, Y, test_size=test_size, random_state=seed)
# Fit the model on training set
model = LogisticRegression()
model.fit(X_train, Y_train)
# save the model to disk
filename = 'finalized_model.sav'
pickle.dump(model, open(filename, 'wb'))

# some time later...

# load the model from disk
loaded_model = pickle.load(open(filename, 'rb'))
result = loaded_model.score(X_test, Y_test)
print(result)
Read full-text »
支持向量机
2018-08-18
概述
支持向量机(Support Vector Machines):在分类与回归分析中分析数据的监督式学习模型与相关的学习算法。
- 原理:对于支持向量机来说,数据点被视为
p维向量,而我们想知道是否可以用p-1维超平面来分开这些点。这就是所谓的线性分类器。可能有许多超平面可以把数据分类。最佳超平面的一个合理选择是以最大间隔把两个类分开的超平面。 - 优点:泛化错误率低,计算开销不大,结果易解释
- 缺点:对参数和核函数的选取敏感
- 适用:数值型,标称型
知识点
- 线性可分(linearly separable):比如对于两组两种类别的数据,可用一条直线将两组数据点分开。
- 分隔超平面(separating hyperplane):将数据集分隔开来的直线。
- 数据点在二维,超平面就是一条直线;
- 数据点在三维,超平面就是一个平面;
- 数据点是1024维,超平面是1023维的对象。这个对象就叫做超平面(hyperplane)或者决策边界,位于超平面一侧的数据属于某个类别,另一侧的数据另一个类别。
- 间隔(margin):点到分隔面的距离。
- 支持向量(support vector):离分隔超平面最近的那些点。(所以到底是多少点算作?1个还是指定的任意个?)

- 目标:构建分类器,数据点离超平面越远,则预测结果更可信。找到离分割面最近的点,确保他们离分割面越远越好。
- 寻找最大间隔:
- 单位阶跃函数:f(x), 如果 x<0, f(x)=-1; 如果 x > 0, f(x)=1。类似于逻辑回归使用sigmoid函数进行映射,获得分类标签值。这里方便数学处理,所以输出是正负1,而不是0和1。
- 点到超平面的距离:WX+b
- 点到分割面的间隔:label *(WT+b),如果点在正向(+1,label为+1)且到超平面很远(正值),则此间隔值为一个很大的正数;如果点在负向(-1,label为-1)且到超平面很远(负值),则此间隔值也是一个很大的正数。
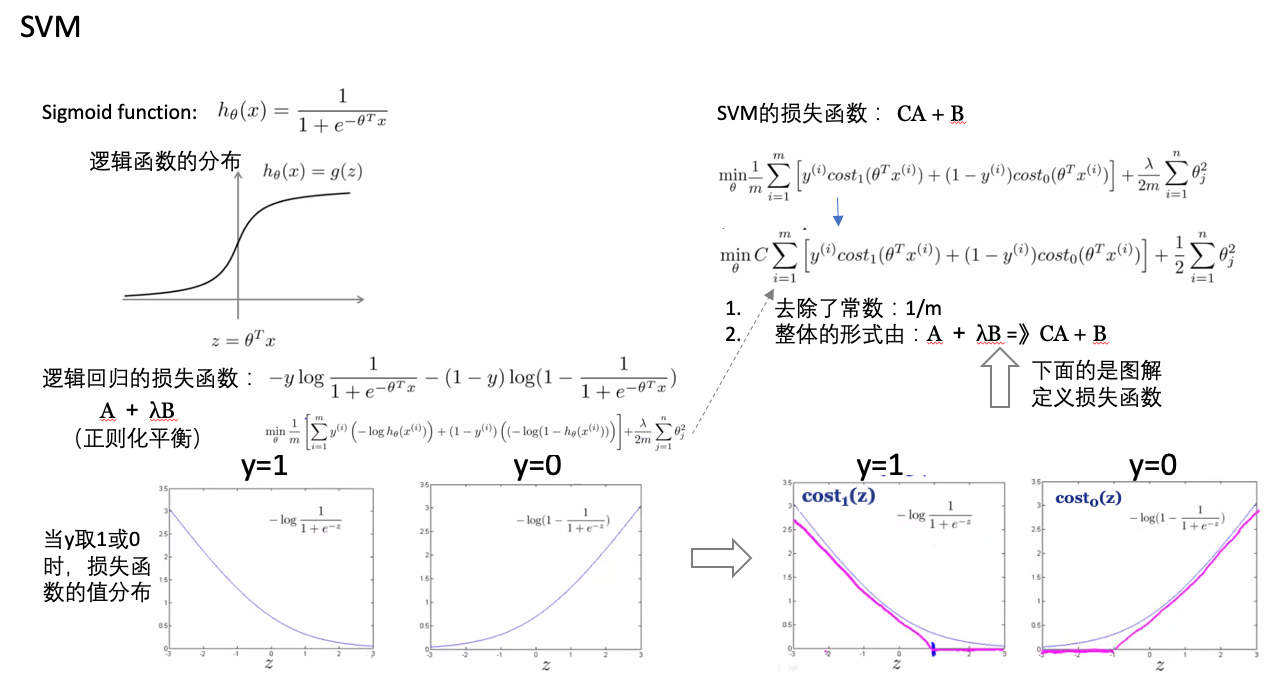
- 损失函数:
- SVM vs logistic regression:
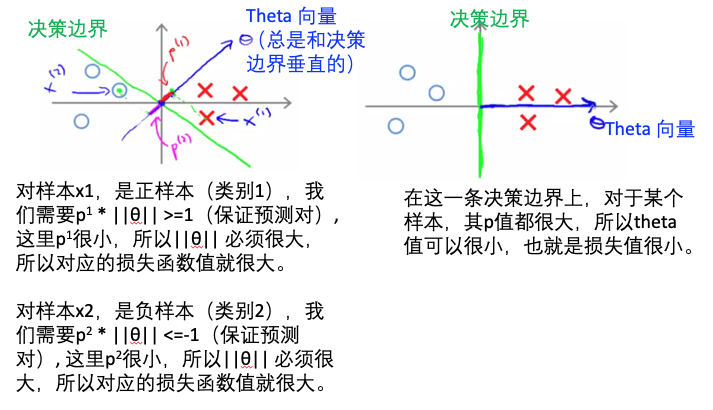
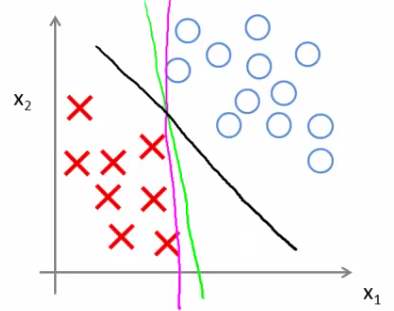
- 与逻辑回归相比,SVM是更稳健的,因为其选择的是最大距离(large margin),比如下图中逻辑回归选择了黄绿的边界,能够将现有数据分隔开,但是泛化能力差;黑色的是SVM选择的边界(最大化距离)。
实现
sklearn版本
用SVM预测肿瘤的类型:
#Import scikit-learn dataset library
from sklearn import datasets

#Load dataset
cancer = datasets.load_breast_cancer()

# print the names of the 13 features
print("Features: ", cancer.feature_names)

# print the label type of cancer('malignant' 'benign')
print("Labels: ", cancer.target_names)

# Import train_test_split function
from sklearn.model_selection import train_test_split

# Split dataset into training set and test set
X_train, X_test, y_train, y_test = train_test_split(cancer.data, cancer.target, test_size=0.3,random_state=109) # 70% training and 30% test

#Import svm model
from sklearn import svm

#Create a svm Classifier
clf = svm.SVC(kernel='linear') # Linear Kernel

#Train the model using the training sets
clf.fit(X_train, y_train)

#Predict the response for test dataset
y_pred = clf.predict(X_test)

#Import scikit-learn metrics module for accuracy calculation
from sklearn import metrics

# Model Accuracy: how often is the classifier correct?
print("Accuracy:",metrics.accuracy_score(y_test, y_pred))
参考
Read full-text »
Python common used tricks
2018-08-13
- Calculate distance between two intervals stackoverflow
- Sort a column by specific order in a df stackoverflow
- Free online jupyter
- Normalize data frame by row/column sum stackoverflow
- Write multiple df to one sheet with multiple tab stackoverflow
- 根据df某一列的值,找到其最大值所对应的index
- 设置画图时使用Helvetica字体
- 画图时支持中文
- 将array里面的NA值替换为其他实数值
- 核查文件夹是否存在否则创建
- 把df中的某一列按照特定字符分隔成多列
- 在
df中使用cut进行分bin,获得对应的bin值 - 更改pip安装包的源
- 获取一列数对应的排序
- 计算df中每一列的缺失值比例
- 在jupyter中使用运行时间
- df中分组,将某一列合并为一行
- 对于数组计算累计值
- 对于df指定列,找出最接近某个输入值的行
- 使用模块管理工具
importlib - 对df中缺失值进行填充
- csv写文件时全为逗号隔开的
- 设置
.pythonrc文件在打开python console时自动执行
Calculate distance between two intervals stackoverflow
def solve(r1, r2):
     # sort the two ranges such that the range with smaller first element
     # is assigned to x and the bigger one is assigned to y
     x, y = sorted((r1, r2))

     #now if x[1] lies between x[0] and y[0](x[1] != y[0] but can be equal to x[0])
     #then the ranges are not overlapping and return the differnce of y[0] and x[1]
     #otherwise return 0
     if x[0] <= x[1] < y[0] and all( y[0] <= y[1] for y in (r1,r2)):
        return y[0] - x[1]
     return 0
...
>>> solve([0,10],[12,20])
2
>>> solve([5,10],[1,5])
0
>>> solve([5,10],[1,4])
1
Sort a column by specific order in a df stackoverflow
# the specific order
sorter = ['a', 'c', 'b']

df['column'] = df['column'].astype("category")
df['column'].cat.set_categories(sorter, inplace=True)

df.sort_values(["column"], inplace=True)
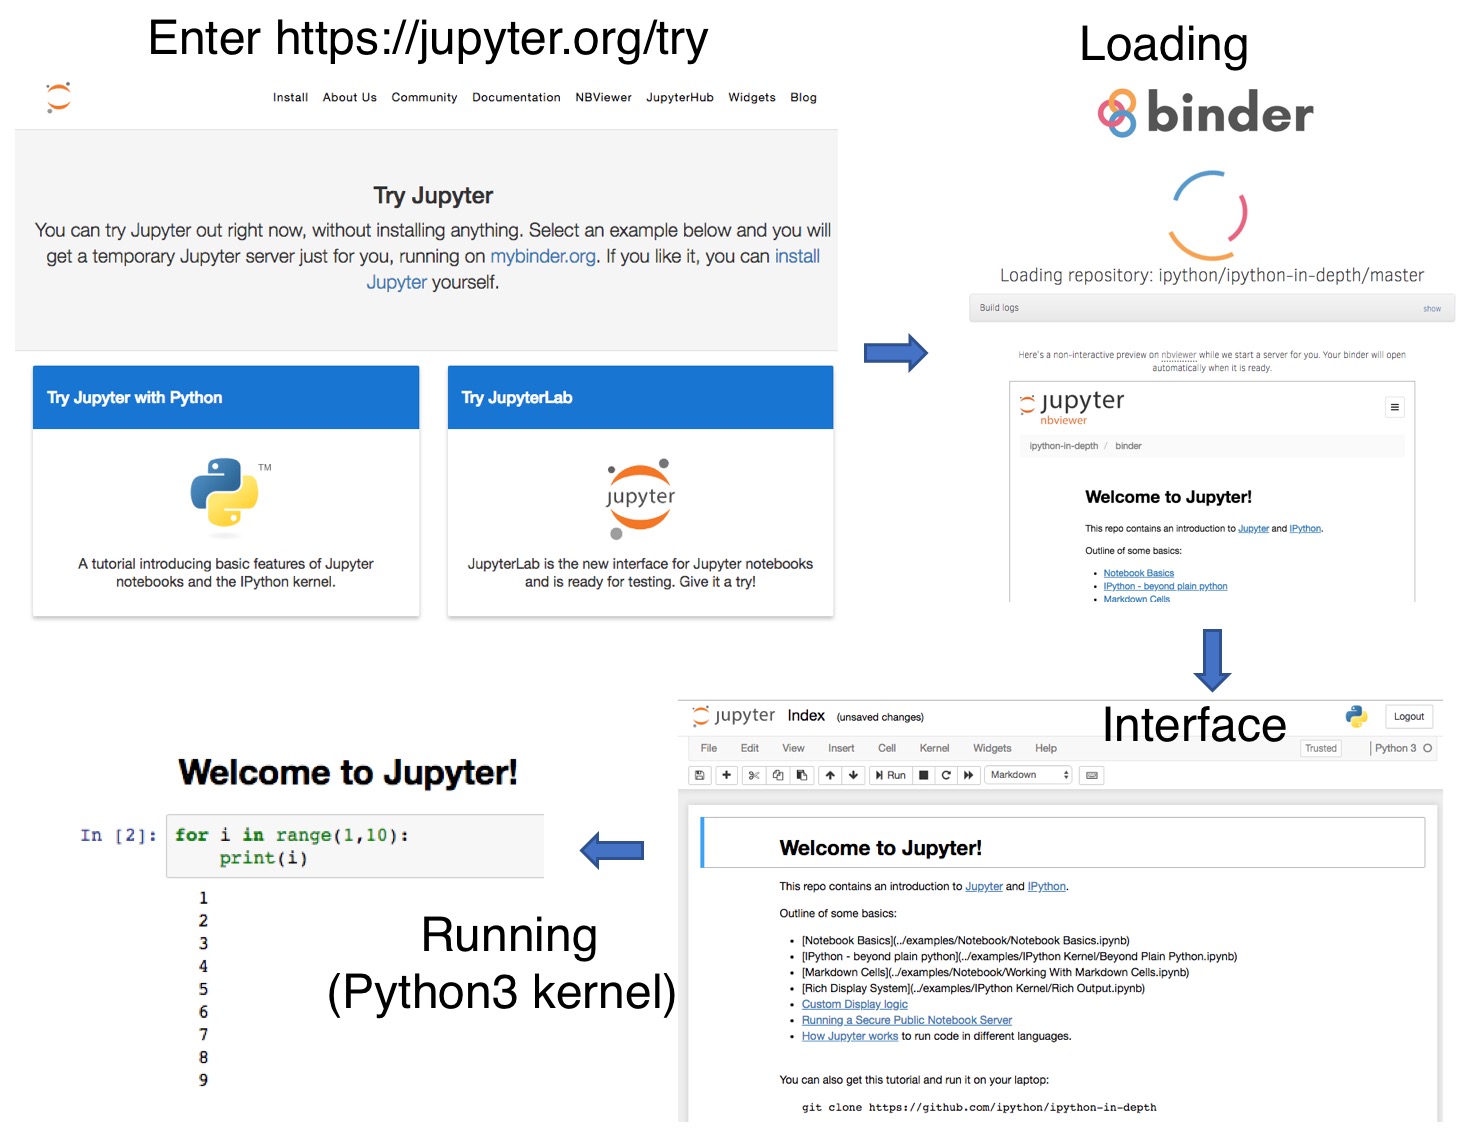
Free online jupyter
A free Python/R notebook can also be created online at https://rdrr.io/.
Normalize data frame by row/column sum stackoverflow
t = pd.DataFrame({1:[1,2,3], 2:[3,4,5], 3:[6,7,8]})
t

	1	2	3
0	1	3	6
1	2	4	7
2	3	5	8
# by row sum
t.div(t.sum(axis=1), axis=0)

	1	2	3
0	0.100000	0.300000	0.600000
1	0.153846	0.307692	0.538462
2	0.187500	0.312500	0.500000

# by column sum
t.div(t.sum(axis=0), axis=1)

	1	2	3
0	0.166667	0.250000	0.285714
1	0.333333	0.333333	0.333333
2	0.500000	0.416667	0.380952
Write multiple df to one sheet with multiple tab stackoverflow
def dfs_tabs(df_list, sheet_list, file_name):
    writer = pd.ExcelWriter(file_name,engine='xlsxwriter')
    for dataframe, sheet in zip(df_list, sheet_list):
        dataframe.to_excel(writer, sheet_name=sheet, startrow=0 , startcol=0, index=False)
    writer.save()
根据df某一列的值,找到其最大值所对应的index
As discussed here:
df = pd.DataFrame({'favcount':[1,2,3], 'sn':['a','b','c']})

print (df)
   favcount sn
0         1  a
1         2  b
2         3  c

print (df.favcount.idxmax())
2

print (df.ix[df.favcount.idxmax()])
favcount    3
sn          c
Name: 2, dtype: object

print (df.ix[df.favcount.idxmax(), 'sn'])
c
设置画图时使用Helvetica字体
主要参考这篇文章:Changing the sans-serif font to Helvetica。转换好的字体文件放在了这里,可下载使用。
# 在mac上找到Helvetica字体
$ ls /System/Library/Fonts/Helvetica.ttc

# 复制到其他的位置
$ cp /System/Library/Fonts/Helvetica.ttc ~/Desktop

# 使用online的工具转换为.tff文件
# 这里使用的是: https://www.files-conversion.com/font/ttc

# 定位python库的字体文件
$ python -c 'import matplotlib ; print(matplotlib.matplotlib_fname())'

/Users/gongjing/usr/anaconda2/lib/python2.7/site-packages/matplotlib/mpl-data/matplotlibrc

# 将tff文件放到上述路径的font目录下
$ cp Helvetica.ttf /Users/gongjing/usr/anaconda2/lib/python2.7/site-packages/matplotlib/mpl-data/fonts/ttf

# 修改matplotlibrc文件
#font.sans-serif : DejaVu Sans, Bitstream Vera Sans, Computer Modern Sans Serif, Lucida Grande, Verdana, Geneva, Helvetica, Lucid, Arial, Avant Garde, sans-serif

=》font.sans-serif : Helvetica, DejaVu Sans, Bitstream Vera Sans, Computer Modern Sans Serif, Lucida Grande, Verdana, Geneva, Lucid, Arial, Avant Garde, sans-serif

# 重启jupyter即可
上面是设置全局的,也可以显示的在代码中指定,可以参考这里:
# 显示指定在此脚本中用某个字体
import matplotlib.pyplot as plt
plt.rcParams["font.family"] = "Helvetica"

# 对于不同的部分(标题、刻度等)指定不同的字体
csfont = {'fontname':'Comic Sans MS'}
hfont = {'fontname':'Helvetica'}
plt.title('title',**csfont)
plt.xlabel('xlabel', **hfont)
plt.show()
画图时支持中文
画图时,如果需要使用中文label,需要设置,主要参考这里:
- 1、下载
SimHei黑体字体文件 - 2、将下载的
.tff文件放到matplotlib包的路径下,路径为:matplotlib/mpl-data/fonts/ttf,可以使用pip show matplotlib查看包安装的位置 - 3、修改配置文件:
matplotlibrc,一般在matplotlib/mpl-data/这个下面。- font.family : sans-serif
- font.sans-serif : SimHei, Bitstream Vera Sans, Lucida Grande, Verdana, Geneva, Lucid, Arial, Helvetica, Avant Garde, sans-serif
- axes.unicode_minus:False
- 4、删除
/Users/gongjing/.matplotlib下面缓存的字体文件 - 5、再直接调用即可
plt.rcParams["font.family"] = "SimHei"
将array里面的NA值替换为其他实数值
可以使用numpy的函数nan_to_num:numpy.nan_to_num(x, copy=True)]
x = np.array([np.inf, -np.inf, np.nan, -128, 128])

# 默认copy=True,不改变原来数组的值
np.nan_to_num(x)
array([  1.79769313e+308,  -1.79769313e+308,   0.00000000e+000,
        -1.28000000e+002,   1.28000000e+002])

# 设置copy=False,原来数组的值会被替换
np.nan_to_num(x, copy=False)
核查文件夹是否存在否则创建
As discussed here:
import os
def check_dir_or_make(d):
    if not os.path.exists(d):
        os.makedirs(d)
把df中的某一列按照特定字符分隔成多列
As discussed here:
df = pd.DataFrame({'Name': ['Steve_Smith', 'Joe_Nadal',
                           'Roger_Federer'],
                 'Age':[32,34,36]})

# Age	Name
# 0	32	Steve_Smith
# 1	34	Joe_Nadal
# 2	36	Roger_Federer

df[['First','Last']] = df.Name.str.split("_",expand=True,)
# expand需要设置为True,负责报错说原来df没有“first”,“last”列

# Age	Name	First	Last
# 0	32	Steve_Smith	Steve	Smith
# 1	34	Joe_Nadal	Joe	Nadal
# 2	36	Roger_Federer	Roger	Federer
在df中使用cut进行分bin,获得对应的bin值
# 将数据分成10组
bins = 10
df = pd.DataFrame.from_dict({'value':[i/10 for i in range(10+1)]})
df['bins'] = pd.cut(df['value'], bins=bins)
df

value	bins
0	0.0	(-0.001, 0.1]
1	0.1	(-0.001, 0.1]
2	0.2	(0.1, 0.2]
3	0.3	(0.2, 0.3]
4	0.4	(0.3, 0.4]
5	0.5	(0.4, 0.5]
6	0.6	(0.5, 0.6]
7	0.7	(0.6, 0.7]
8	0.8	(0.7, 0.8]
9	0.9	(0.8, 0.9]
10	1.0	(0.9, 1.0]

# 通过以value_counts()的index获得唯一的bin
# 打印:此时每一个i是interval对象
for i in list(df['bins'].value_counts().index):
    print(i)
(-0.001, 0.1]
(0.9, 1.0]
(0.8, 0.9]
(0.7, 0.8]
(0.6, 0.7]
(0.5, 0.6]
(0.4, 0.5]
(0.3, 0.4]
(0.2, 0.3]
(0.1, 0.2]

# interval对象不能通过index进行取值
i[0]

---------------------------------------------------------------------------
TypeError                                 Traceback (most recent call last)
<ipython-input-46-3aa51af8ff05> in <module>()
----> 1 i[0]

TypeError: 'pandas._libs.interval.Interval' object does not support indexing

# interval对象有特定的属性进行取值等操作
# closed, left, right, closed_left, closed_right, mid, open_left, open_right

i.left
0.1

i.right
0.2
更改pip安装包的源
国内有一些镜像,在安装时使用这些镜像会加快下载的速度,可参考这里。
临时修改(安装时指定):
pip install scrapy -i https://pypi.tuna.tsinghua.edu.cn/simple
永久修改(安装源写入配置文件~/.pip/pip.conf):
[global]
index-url = https://pypi.tuna.tsinghua.edu.cn/simple
获取一列数对应的排序
参考Efficient method to calculate the rank vector of a list in Python:
import scipy.stats as ss
ss.rankdata([3, 1, 4, 15, 92])
# array([ 2.,  1.,  3.,  4.,  5.])

ss.rankdata([1, 2, 3, 3, 3, 4, 5])
# array([ 1.,  2.,  4.,  4.,  4.,  6.,  7.])
计算df中每一列的缺失值比例
参考这里:
percent_missing = df.isnull().sum() * 100 / len(df)
missing_value_df = pd.DataFrame({'column_name': df.columns,
                                 'percent_missing': percent_missing})
在jupyter中使用运行时间
import time
start =time.clock()
#中间写上代码块
end = time.clock()
print('Running time: %s Seconds'%(end-start))
df中分组,将某一列合并为一行
参考这里:
In [326]:
df = pd.DataFrame({'id':['a','a','b','c','c'], 'words':['asd','rtr','s','rrtttt','dsfd']})
df

Out[326]:
  id   words
0  a     asd
1  a     rtr
2  b       s
3  c  rrtttt
4  c    dsfd

In [327]:
df.groupby('id')['words'].apply(','.join)

Out[327]:
id
a        asd,rtr
b              s
c    rrtttt,dsfd
Name: words, dtype: object

# 注意,这里是有两行,所以以id进行group之后,只剩下word
# groupby之后是得到一个df
# groupby()[col]是选取对应的column,但是选出的column是series,不是直接的list
df.groupby('photo_id')['like_flag'].apply(lambda x: np.cumsum(list(x))).to_dict()
对于数组计算累计值
参考这里:
import numpy as np

a = [4,6,12]

np.cumsum(a)
#array([4, 10, 22])
对于df指定列,找出最接近某个输入值的行
参考这里:
   num
0    1
1    6
2    4
3    5
4    2

input = 3

# 这里是选取的最接近的前2个,控制index可选择1个等
df.iloc[(df['num']-input).abs().argsort()[:2]]

   num
2    4
4    2
使用模块管理工具importlib
构建文件目录:
gongjing@bjzyx-c451:~/gj_py_func $ pwd
/home/gongjing/gj_py_func

gongjing@bjzyx-c451:~/gj_py_func $ lst
.
  |-list.py
  |-file.py
  |-dataframe.py
  |-init.py
  |-__pycache__
  |  |-list.cpython-37.pyc
  |  |-file.cpython-37.pyc
  |  |-dataframe.cpython-37.pyc
  |  |-load_packages.cpython-37.pyc
  |-.ipynb_checkpoints
  |  |-file-checkpoint.py
  |  |-dataframe-checkpoint.py
  |  |-list-checkpoint.py
调用:
import importlib, sys
if '/home/gongjing/' not in sys.path: sys.path.append('/home/gongjing/')

func_df = importlib.import_module('.dataframe', package='gj_py_func')
func_file = importlib.import_module('.file', package='gj_py_func')
func_ls = importlib.import_module('.list', package='gj_py_func')

importlib.reload(func_df)
importlib.reload(func_file)
importlib.reload(func_ls)

# 查看模块信息,包含哪些函数
help(func_df)
Help on module gj_py_func.dataframe in gj_py_func:

NAME
    gj_py_func.dataframe

FUNCTIONS
    df_col_missing_pct(df)

    df_col_sum(df)

    df_norm_by_colsum(df)

    df_norm_by_rowsum(df)

    df_row_sum(df)

    load_data(fn, col_ls=None)

FILE
    /home/gongjing/gj_py_func/dataframe.py
对df中缺失值进行填充
参考这里:
df.fillna({1:0}, inplace=True)

df[1].fillna(0, inplace=True)
csv写文件时全为逗号隔开的
参考这里:
if item:
        JD = item.group()
        csvwriter.writerow(JD)
# J,D,",", ,C,o,l,u,m,b,i,a, ,L,a,w, ,S,c,h,o,o,l,....

# one string per row
csvwriter.writerow([JD])
设置.pythonrc文件在打开python console时自动执行
参考这里:
1, 写.pythonrc文件
print("how_use_pythonstartup")
2, 设置PYTHONSTARTUP变量
export PYTHONSTARTUP=~/.pythonrc
3, 打开新的console
Python 2.7.6 (default, Nov 23 2017, 15:49:48)
[GCC 4.8.4] on linux2
Type "help", "copyright", "credits" or "license" for more information.
how_use_pythonstartup
>>>
Read full-text »
特征选择
2018-08-10
目录
基本概念
- 特征:属性
- 相关特征:relevant feature,对当前学习任务有用的属性
- 无关特征:irrelevant feature,对当前学习任务没什么用的属性
- 特征选择:feature selection,从给定的特征集合中选择出相关特征子集的过程
- 数据预处理过程
- 一般学习任务:先进行特征选择,再训练学习器
- 为什么要特征选择?
- 减轻维数灾难问题。属性过段时,可以选择出重要特征,这点目的类似于降维。降维和特征选择是处理高维数据的两大主流技术。
- 去除不相关特征能降低学习任务难度。
- 需要:确保不丢失重要信息
- 冗余特征:一般是没用的,如果能对应学习任务所需的中间概念,则是有益的。比如学习立方体对象,给定底面长、底面宽、底面积,此时底面积是冗余的。如果是学习立方体体积,此时底面积是有用的,可以更快的计算。
特征子集搜索
如何根据评价结果获取候选特征子集?【子集搜索】
- 前向搜索:逐渐增加相关特征,forward
- 每个(总共d个)特征看做一个候选子集
- 对d个进行评价,选择最佳的一个作为此轮选定集,比如{a2}
- 加入一个特征,看加入哪个时是最优的,且需要优于上一轮的{a2},比如是{a2,a4}
- 假定在k+1轮时,最优的(k+1,在上一轮添加了一个)子集不如上一轮的好,则停止搜索
- 后向搜索:逐渐减少特征的策略,backward
- 所有特征作为一个特征集合
- 每次尝试去掉一个无关特征
- 双向搜索:结合前向和后向,bidirectional
- 每一轮增加选定的相关特征
- 减少无关特征
- 特点:
- 都属于贪心策略
- 仅考虑了使得本轮选定集最优
特征子集评价
如何评价候选特征子集的好坏?【子集评价】
- 信息增益:信息增益越大,特征子集包含的有助于分类的信息越多
- 划分:子集A确定了对于数据集D的一个划分,样本标记Y对应着对D的真实划分,估算这两个划分的差异,对A进行评估
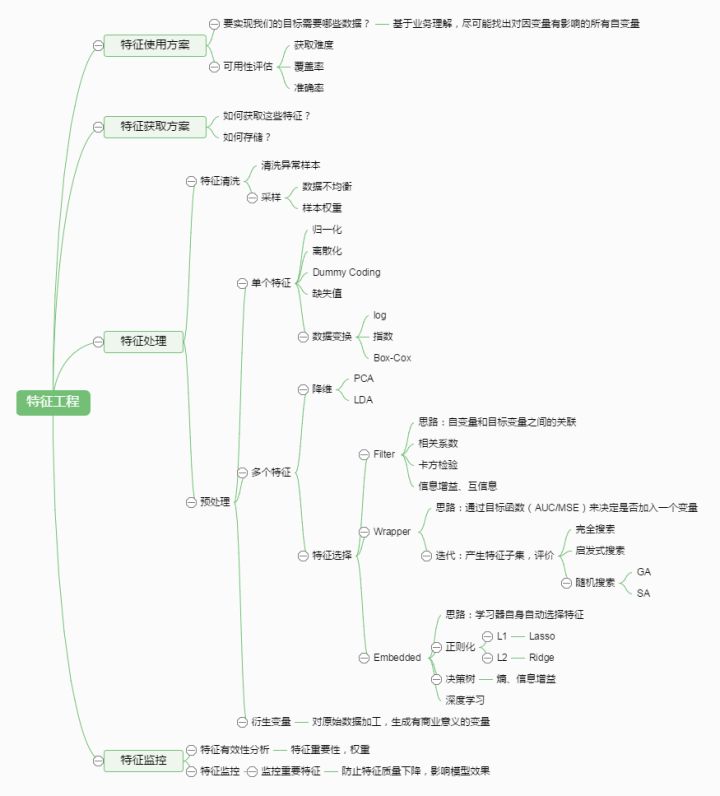
特征选择分类
特征选择:子集搜索+子集评价
- 前向搜索+信息熵 =》决策树
- 分类:
- 过滤式:filter
- 包裹式:wrapper
- 嵌入式:embedding
sklearn的特征选择
过滤式
- 过程:先进行特征选择,再训练学习器,特征选择与后续学习器无关
- Relief:
- Relevant Features
- 著名的过滤式特征选择方法
- 用“相关统计量”度量特征的重要性。是一个向量,每个分量分别对应一个初始特征。特征子集的重要性:等于子集中每个特征所对应的相关统计量分量之和。
- 【选择策略1】:指定阈值\(\tau\),比这个阈值大的分量所对应的特征保留
- 【选择策略2】:指定特征个数k,分量最大的k个特征保留
如何确定相关统计量?
- 训练集:\({(x_1,y_x),...,(x_m,y_m)}\)
- 每个样本\(x_i\),先在其同类样本中寻找其最近邻\(x_{i,nh}\) =》猜中近邻(near-hit)
- 再从其异类样本中寻找其最近邻\(x_{i,nm}\) =》猜错近邻(near-miss)
- 相关统计量关于属性j的分量为:\(\delta^j=\sum_{i}-diff(x_i^j,x_{i,nh}^j)^2+diff(x_i^j,x_{i,nm}^j)^2\)
- 属性j离散型:\(x_a^j=x_b^j => diff(x_a^j,x_b^j)=0\)
- 属性j连续型:\(diff(x_a^j,x_b^j)=\|x_a^j-x_b^j\|\)
- 如果样本\(x_i\)与其猜中近邻距离小于与猜错近邻的距离,则属性j对区分同类和异类样本是有益的 =》增大属性j对应的统计量分量
- 如果样本\(x_i\)与其猜中近邻距离大于与猜错近邻的距离,则属性j对区分同类和异类样本是无益的 =》减小属性j对应的统计量分量
- 上面是一个属性的一个样本的
- 推广到所有样本所有属性
- 所有样本得到的估计结果进行平均
- 各个属性的统计分量,分量值越大,对应属性的分类能力越强
- 注意:上面的式子是在给定的i上进行的,所以不一定非得在总的数据集上进行,可以在采样集合上进行
- 多分类:
过滤式:移除低方差特征
- 函数:VarianceThreshold
- 原理:移除方差不满足一些阈值的特征。默认: 移除所有方差为0(取值不变)的特征。
例子:布尔值类型的的数据聚集,移除0或者1超过80%的特征: 注意:布尔值是伯努利随机变量,方差:\(Var[X] = p(1-p)\),如果选择阈值为0.8,则方差阈值=0.8(1-0.8)=0.8*0.2=0.16。可以看到,第一列特征被移除:
>>> from sklearn.feature_selection import VarianceThreshold
>>> X = [[0, 0, 1], [0, 1, 0], [1, 0, 0], [0, 1, 1], [0, 1, 0], [0, 1, 1]]
>>> sel = VarianceThreshold(threshold=(.8 * (1 - .8)))
>>> sel.fit_transform(X)
array([[0, 1],
       [1, 0],
       [0, 0],
       [1, 1],
       [1, 0],
       [1, 1]])
过滤式:单变量特征选择
原理:对单变量进行统计测试,以选取最好的特征,可作为评估器的预处理步骤
- SelectKBest:只保留得分最高的k个特征
- SelectPercentile:移除指定的最高得分百分比之外的特征
- 常见统计测试量:SelectFpr(假阳性率), SelectFdr(假发现率), SelectFwe(族系误差)
- GenericUnivariateSelect:评估器超参数选择以选择最好的单变量
- 回归:f_regression,mutual_info_regression
- 分类:chi2,f_classif,mutual_info_classif
>>> from sklearn.datasets import load_iris
>>> from sklearn.feature_selection import SelectKBest
>>> from sklearn.feature_selection import chi2
>>> iris = load_iris()
>>> X, y = iris.data, iris.target
>>> X.shape
(150, 4)
>>> X_new = SelectKBest(chi2, k=2).fit_transform(X, y)
>>> X_new.shape
(150, 2)
包裹式
- 包裹式:直接把最终要使用的学习器的性能作为特征子集的评价准则
- 目的:为给定的学习器选择最有利于其性能、量身定做的特征子集
- 一般效果更好
-
计算开销会大得多
- LVW:Las Vegas Wrapper
- 典型的包裹式特征选择方法
- 随机策略进行子集搜索,最终分类器的误差作为特征子集评价准则
- 算法:
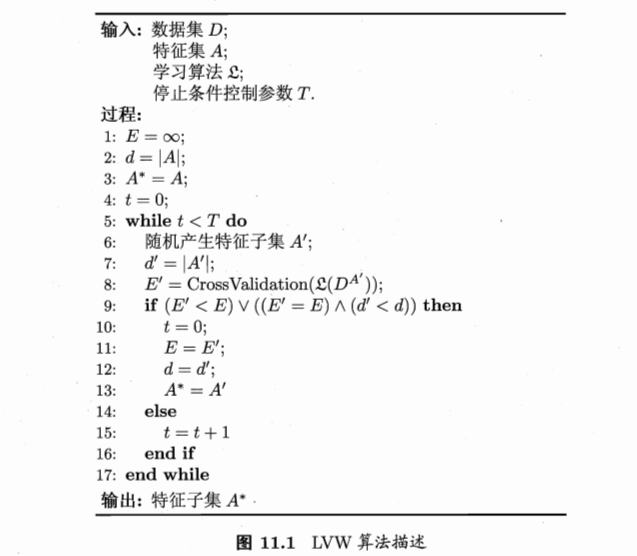
- 误差评价:是在特征子集A’上。本来就是要选择最好的子集特征,当然是在这个子集上进行。
- 初始特征数很多、T设置较大:算法运行时间长达不到停止条件
包裹式:递归式特征消除
- 给定一个外部评估器(学习器):所以这个属于包裹式的?
- 对每一个特征,进行重要性评估
- 去除最不重要的特征
- 重复去除步骤,直到剩余特征满足指定特征数量为止
嵌入式
- 嵌入式:将特征选择过程与学习器训练过程融为一体,两者在同一优化过程中完成。学习器训练过程中自动进行了特征选择。
- 例子:
- L1正则化求解:近端梯度下降PGD(proximal gradient descent)
嵌入式:SelectFromModel+L1的线性回归选取
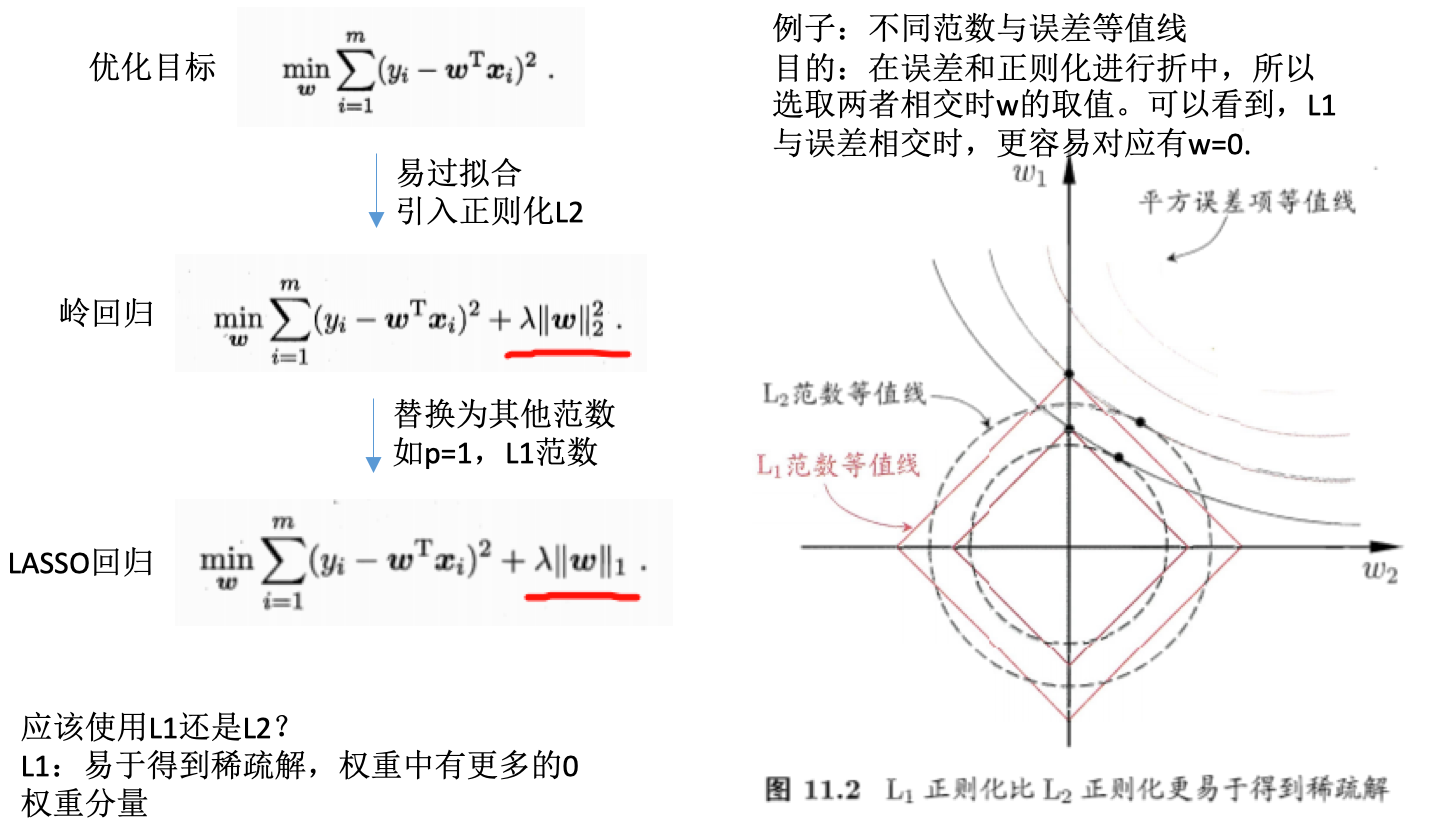
- L1正则化:模型变得系数,很多系数为0
- 降低数据维度
- 选择非0系数特征
>>> from sklearn.svm import LinearSVC
>>> from sklearn.datasets import load_iris
>>> from sklearn.feature_selection import SelectFromModel
>>> iris = load_iris()
>>> X, y = iris.data, iris.target
>>> X.shape
(150, 4)
>>> lsvc = LinearSVC(C=0.01, penalty="l1", dual=False).fit(X, y)
>>> model = SelectFromModel(lsvc, prefit=True)
>>> X_new = model.transform(X)
>>> X_new.shape
(150, 3)
嵌入式:SelectFromModel+树的选取
- 计算特征的相关性
- 消除不相关特征
>>> from sklearn.ensemble import ExtraTreesClassifier
>>> from sklearn.datasets import load_iris
>>> from sklearn.feature_selection import SelectFromModel
>>> iris = load_iris()
>>> X, y = iris.data, iris.target
>>> X.shape
(150, 4)
>>> clf = ExtraTreesClassifier()
>>> clf = clf.fit(X, y)
>>> clf.feature_importances_
array([ 0.04...,  0.05...,  0.4...,  0.4...])
>>> model = SelectFromModel(clf, prefit=True)
>>> X_new = model.transform(X)
>>> X_new.shape
(150, 2)
特征选取放在管道中
作为预处理的步骤:
clf = Pipeline([
  ('feature_selection', SelectFromModel(LinearSVC(penalty="l1"))),
  ('classification', RandomForestClassifier())
])
clf.fit(X, y)
参考
- 机器学习周志华:特征选择与稀疏学习
- sklearn 中文
- 机器学习中,有哪些特征选择的工程方法?@知乎
Read full-text »
Latest articles
Links
- ZhangLab , RISE database , THU life , THU info
- Data analysis: pandas , numpy , scipy
- ML/DL: sklearn , sklearn(中文) , pytorch
- Visualization: seaborn , matplotlib , gallery
- Github: me
