判别生成模型、朴素贝叶斯、高斯判别分析
2018-08-04
生成式模型 vs 判别式模型
对于监督学习,其最终目标都是在给定样本时,预测其最可能的类别,即优化目标总是:\(\begin{align}\arg \max_yp(y\|x)\end{align}\)。
求解上述优化目标总的可分为两类:
- 判别式模型(Discriminant Model):直接学习模型得到\(p(y\|x)\),即根据数据集学习参数模型:\(p(y\|x; \theta)\),那么在预测的时候直接根据新样本的x特征值计算y值(所属的类别的概率)。此类包含:1)线性回归模型,2)逻辑回归模型,3)决策树模型 等
-
wiki: a generative model is a model of the conditional probability of the observable X, given a target y, symbolically,{P(X|Y=y)}.
- 生成式模型(Generative Model):利用贝叶斯法则,对上述的优化目标进行转换。
- wiki: a discriminative model is a model of the conditional probability of the target Y, given an observation x, symbolically,{P(Y|X=x)}
- 贝叶斯公式: \(p(y\|x)=\frac {p(x,y)}{p(x)}=\frac {p(x\|y)p(y)}{p(x)}\)
- 代入上面的优化目标:\(\begin{align}\arg \max_yp(y\|x)&=\arg \max_y\frac {p(x\|y)p(y)}{p(x)}\\&=\arg \max_yp(x\|y)p(y)\end{align} (给定数据x时,p(x)是常量可不考虑)\)
- 此时模型的求解目标不是\(p(y\|x)\),而是\(p(x\|y)\)和\(p(y)\)
| 判别模型 | 生成模型 | |
|---|---|---|
| 关注点 | 关注各类的边界 | 关注每一类的分布,不关注决策边界的位置 |
| 优点 | 1.能得到类之间的差异信息 2.学习简单 |
1.研究类内部问题更加灵活 2.更适合增量学习 3.对数据不完整适应更好,更鲁棒 |
| 缺点 | 1.不能得到每一类的特征(可以告诉你的是1还是2,但是没有办法把整个场景描述出来) 2.变量关系不清晰、不可视 |
1.学习计算相对复杂 2.更倾向于得到false positive,尤其是对比较近的事物分类(比如牛和马) |
| 举例 | LR、SVM、KNN、traditional neural network、conditional random field | naive bayes、mixtures of mutinomial/gaussians/experts、HMMs、Sigmoidal belief networks、bayesian networks、markov random fields |
例子
目标:判别一个动物是大象(y=1)还是狗(y=0)
判别式模型:
- 【训练】考虑动物的所有特征,学习模式\(p(y\|x; \theta)\)
- 【预测】基于学习的模型,判定是大象还是狗
生成式模型:
- 【训练1】训练所有的类别为大象的数据,学习模型1:\(p(x\|y=1)和p(y=1)\)
- 【训练2】训练所有的类别为狗的数据,学习模型2:\(p(x\|y=0)和p(y=0)\)
- 【预测】用模型1和2分别预测,可能性大的即为最终的预测类别
高斯判别分析
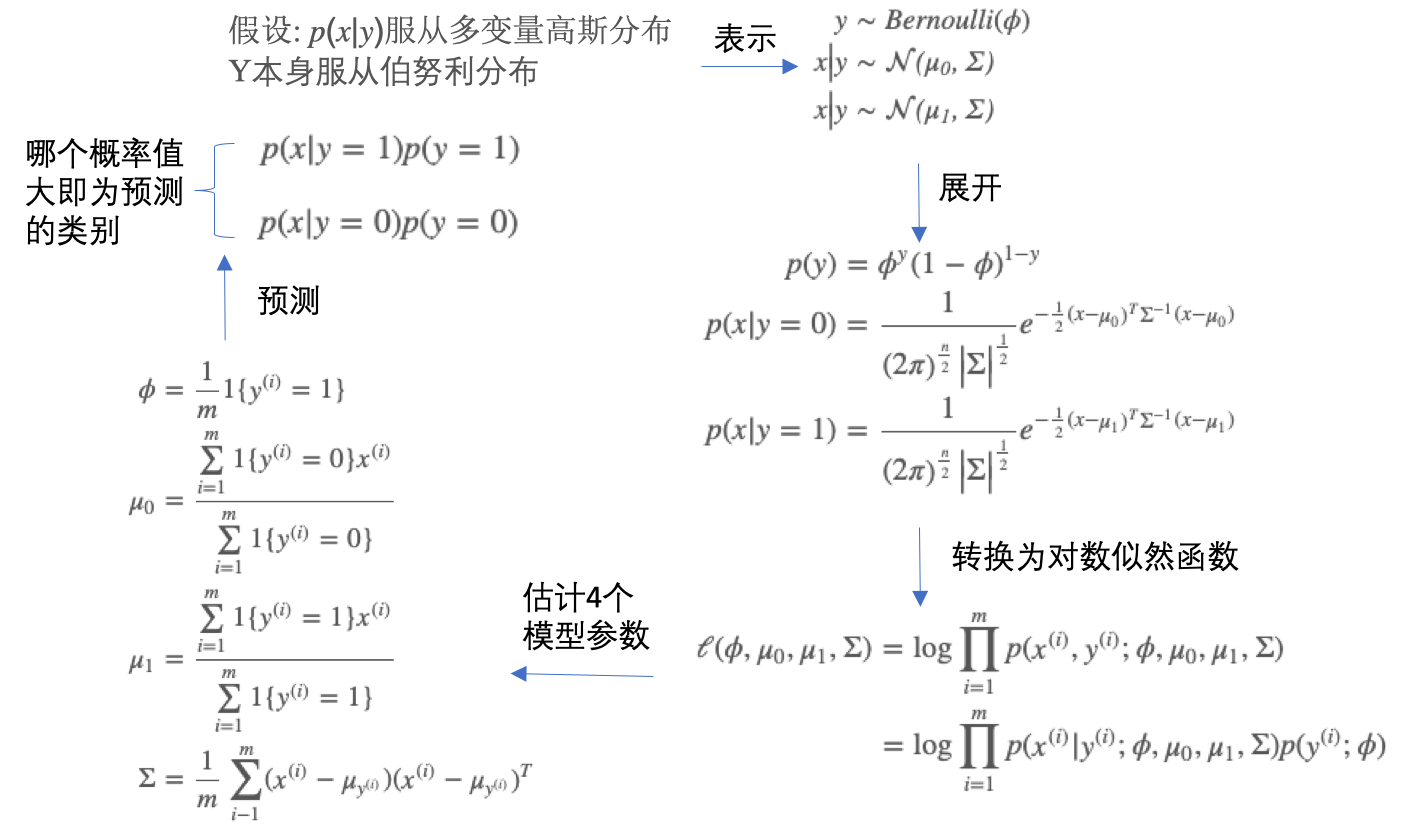
高斯判别分析(Gaussian discriminant analysismodel, GDA):
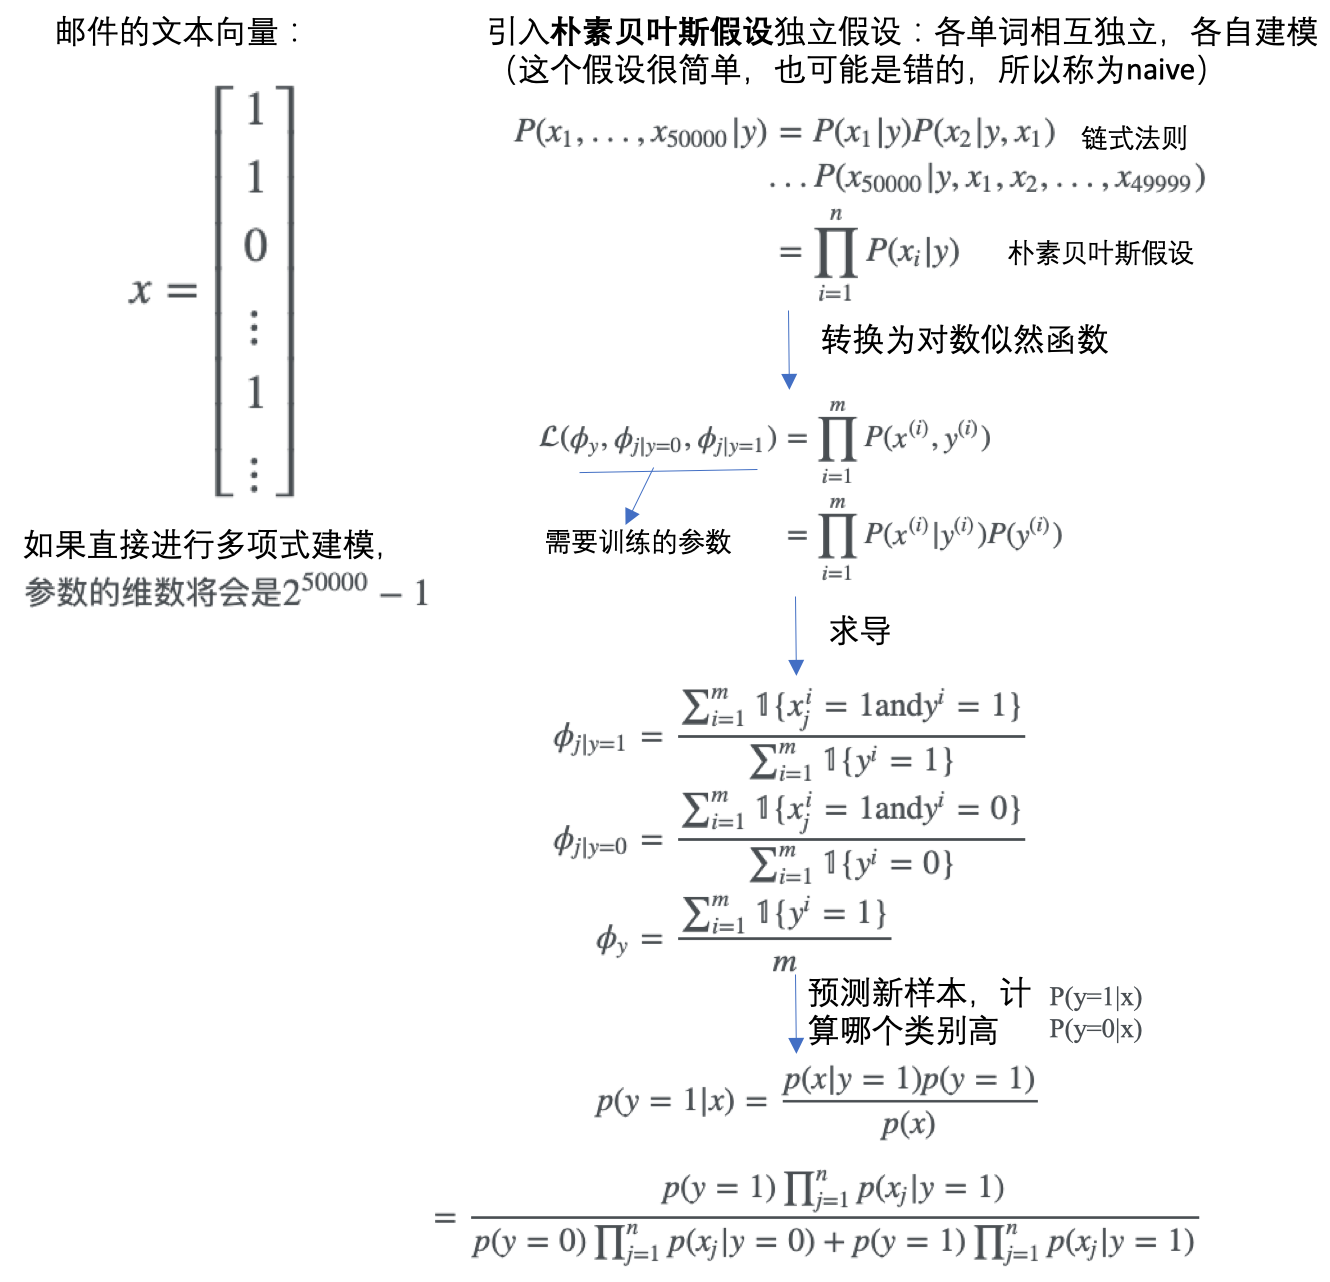
朴素贝叶斯
- 用于学习离散值随机变量
- 贝叶斯决策:选择具有最高概率的决策。对应于分类,即如果属于某一类别的概率是最大的,则分为该类别。
- 朴素:分类器过程中只做最原始、最简单的假设
- 条件概率:\({\displaystyle P(A\mid B)={\frac {P(B\mid A)P(A)}{P(B)}}}\)
- P(A|B)是已知B发生后A的条件概率,即A的后验概率。
- P(A)是A的先验概率
- P(B|A)是已知A发生后B的条件概率,即B的后验概率。
- P(B)是B的先验概率。
文本/邮件分类
对于上面的文本分类问题,涉及到具体的几个步骤:
1、数据准备:从文本构建词向量
- 通过
loadDataSet函数构建post文本内容及对应的标签(是否是侮辱性的) - 然后
createVocabList函数基于所有的文档,提取所有唯一的单词集合 setOfWords2Vec函数基于单词集合,把输入的post文本转换为一个单词向量,长度和单词集合相等,出现某单词则值为1,未出现则为0
def loadDataSet():
    postingList=[['my', 'dog', 'has', 'flea', 'problems', 'help', 'please'],
                 ['maybe', 'not', 'take', 'him', 'to', 'dog', 'park', 'stupid'],
                 ['my', 'dalmation', 'is', 'so', 'cute', 'I', 'love', 'him'],
                 ['stop', 'posting', 'stupid', 'worthless', 'garbage'],
                 ['mr', 'licks', 'ate', 'my', 'steak', 'how', 'to', 'stop', 'him'],
                 ['quit', 'buying', 'worthless', 'dog', 'food', 'stupid']]
    classVec = [0,1,0,1,0,1]    #1 is abusive, 0 not
    return postingList,classVec

def createVocabList(dataSet):
    vocabSet = set([])  #create empty set
    for document in dataSet:
        vocabSet = vocabSet | set(document) #union of the two sets
    return list(vocabSet)

def setOfWords2Vec(vocabList, inputSet):
    returnVec = [0]*len(vocabList)
    for word in inputSet:
        if word in vocabList:
            returnVec[vocabList.index(word)] = 1
        else: print "the word: %s is not in my Vocabulary!" % word
    return returnVec
2、模型训练:基于词向量计算概率
trainMatrix:词向量矩阵,每一行是一个文本,每一列表示某个单词在该文本中是否出现trainCategory:文本所属的类别
根据这个函数,就可以计算出,在每个类别中每个单词出现的概率,具体这里是两个类别:侮辱性的(标记为1的)和非侮辱性的(标记为0的)。
def trainNB0(trainMatrix,trainCategory):
    numTrainDocs = len(trainMatrix)
    numWords = len(trainMatrix[0])
    pAbusive = sum(trainCategory)/float(numTrainDocs)
    p0Num = ones(numWords); p1Num = ones(numWords)      #change to ones()
    p0Denom = 2.0; p1Denom = 2.0                        #change to 2.0
    for i in range(numTrainDocs):
        if trainCategory[i] == 1:
            p1Num += trainMatrix[i]
            p1Denom += sum(trainMatrix[i])
        else:
            p0Num += trainMatrix[i]
            p0Denom += sum(trainMatrix[i])
    p1Vect = log(p1Num/p1Denom)          #change to log()
    p0Vect = log(p0Num/p0Denom)          #change to log()
    return p0Vect,p1Vect,pAbusive
注意:
p0Num = ones(numWords); p1Num = ones(numWords)这里的初始化可以初始化为全0矩阵,但是如果某个单词没有出现,其概率为0,最后的乘积也为0,所以可以初始化为全1矩阵;p1Vect = log(p1Num/p1Denom)这里如果不取log,有可能由于太多的很小的数值相乘造成下溢出问题,所以去对数。
3、模型测试
根据训练数据,已经计算了每个类别中每个单词的出现频率。对于新的文本数据,就可以基于此来计算此文本属于每一个类别的概率,最后文本所属的类别就是概率值最大的那一类。因为这里引入了贝叶斯假设,认为不同的单词之间是相互独立的,所以可以直接计算得到概率,就是下面的vec2Classify * p1Vec和vec2Classify * p0Vec,vec2Classify就是待分类文本的词向量,p1Vec是类别1中单词的概率,两者元素相乘再加和就是文本属于类别1的概率。
def classifyNB(vec2Classify, p0Vec, p1Vec, pClass1):
    p1 = sum(vec2Classify * p1Vec) + log(pClass1)    #element-wise mult
    p0 = sum(vec2Classify * p0Vec) + log(1.0 - pClass1)
    if p1 > p0:
        return 1
    else:
        return 0

def testingNB():
    listOPosts,listClasses = loadDataSet()
    myVocabList = createVocabList(listOPosts)
    trainMat=[]
    for postinDoc in listOPosts:
        trainMat.append(setOfWords2Vec(myVocabList, postinDoc))
    p0V,p1V,pAb = trainNB0(array(trainMat),array(listClasses))
    testEntry = ['love', 'my', 'dalmation']
    thisDoc = array(setOfWords2Vec(myVocabList, testEntry))
    print testEntry,'classified as: ',classifyNB(thisDoc,p0V,p1V,pAb)
    testEntry = ['stupid', 'garbage']
    thisDoc = array(setOfWords2Vec(myVocabList, testEntry))
    print testEntry,'classified as: ',classifyNB(thisDoc,p0V,p1V,pAb)
词集模型 vs 词袋模型
- 词集模型(set-of-words model):所有单词只唯一的计数,每个单词只出现一次
- 词袋模型(bag-of-words model):每个单词可出现多次,次数越多,则在文档中出现的概率越大
# 词集模型
def setOfWords2Vec(vocabList, inputSet):
    returnVec = [0]*len(vocabList)
    for word in inputSet:
        if word in vocabList:
            returnVec[vocabList.index(word)] = 1
        else: print "the word: %s is not in my Vocabulary!" % word
    return returnVec

# 词袋模型
def bagOfWords2VecMN(vocabList, inputSet):
    returnVec = [0]*len(vocabList)
    for word in inputSet:
        if word in vocabList:
            returnVec[vocabList.index(word)] += 1
    return returnVec
sklearn版本
参考这里的文档:
# load data
from sklearn.datasets import fetch_20newsgroups
twenty_train = fetch_20newsgroups(subset='train',
    categories=categories, shuffle=True, random_state=42)

# Tokenizing text
from sklearn.feature_extraction.text import CountVectorizer
count_vect = CountVectorizer()
X_train_counts = count_vect.fit_transform(twenty_train.data)

# occurrences to frequencies
tfidf_transformer = TfidfTransformer()
X_train_tfidf = tfidf_transformer.fit_transform(X_train_counts)

# train NB model
from sklearn.naive_bayes import MultinomialNB
clf = MultinomialNB().fit(X_train_tfidf, twenty_train.target)

# test model
docs_new = ['God is love', 'OpenGL on the GPU is fast']
X_new_counts = count_vect.transform(docs_new)
X_new_tfidf = tfidf_transformer.transform(X_new_counts)

predicted = clf.predict(X_new_tfidf)

for doc, category in zip(docs_new, predicted):
    print('%r => %s' % (doc, twenty_train.target_names[category]))
联合成一个pipeline:
# training
from sklearn.pipeline import Pipeline
text_clf = Pipeline([
    ('vect', CountVectorizer()),
    ('tfidf', TfidfTransformer()),
    ('clf', MultinomialNB()),
])
text_clf.fit(twenty_train.data, twenty_train.target)

# testing
import numpy as np
twenty_test = fetch_20newsgroups(subset='test',
    categories=categories, shuffle=True, random_state=42)
docs_test = twenty_test.data
predicted = text_clf.predict(docs_test)
np.mean(predicted == twenty_test.target)
参考
Read full-text »
随机森林
2018-08-01
目录
- 目录
- bagging和决策树
- 随机森林:bagging+决策树
- 随机森林:决策树结构的多样性
- Out-Of-Bag(OOB) 估计:大约1/3的样本没有涵盖
- OOB vs validation:类似的效果验证
- 特征选择
- sklearn调用
- 参考
bagging和决策树
- bagging:通过bootstrap的方式,从原始数据集D得到新的数据集D‘,然后对每个得到的数据集,使用base算法得到相应的模型,最后通过投票形式组合成一个模型G,即最终模型。
- 决策树:通过递归,利用分支条件,将原始数据集D进行切割,成为一个个的子树结构,到终止形成一棵完整的树形结构。最终的模型G是相应的分支条件和分支树递归组成。
随机森林:bagging+决策树
-
是bagging和决策树的结合

- bagging:减少不同数据集对应模型的方差。因为是投票机制,所以有平均的功效。
- 决策树:增大不同的分支模型的方差。数据集进行切割,分支包含样本数在减少,所以不同的分支模型对不同的数据集会比较敏感,得到较大的方差。
- 结合两者:随机森林算法,将完全长成的CART决策树通过bagging的形式结合起来,得到一个庞大的决策模型。
-
random forest(RF)=bagging+fully-grown CART decision tree
- 优点:
- 效率高:不同决策树可以由不同主机并行训练生成
- 继承了CART的优点
-
将所有决策树通过bagging的形式结合起来,避免单个决策树造成过拟合
- 在随机森林中,树的个数越多,模型稳定性表现越好
- 实际应用中,尽可能选择更多的树
- 可能与random seed有关:初始化值的影响
随机森林:决策树结构的多样性
获得不同的决策树的方式:
- 【1】随机抽取数据集。通过bootstrap得到不同的数据集D’,基于D‘构建模型
- 【2】随机抽取子特征。
- 比如原来100个特征,只随机选取30个进行构建决策树
-
每一轮得到的树由不同的30个特征构成,每棵树不一样
- 类似d到d’维的特征转换,相当于从高维到低维的投影,也就是d‘维z空间是d维x空间的一个随机子空间(subspace)
- 通常d’远小于d,算法更有效率
- 此时的随机森林增加了random-subspace
- RF=bagging+random-subspace CART
- 【3】现有特征的线性组合。
- 现有特征x通过数组p的线性组合:\(\phi(x)=p_i^Tx\)
- 可能很多特征的权重为0
- 每次的分支不再是单一的子特征集合,而是子特征的线性组合
- 二维平面:不止水平和垂直线,还有各种斜线
-
选择的是一部分特征,属于低维映射
- 随机森林算法又有增强
- 从随机子空间增强到随机组合
- 类似于perceptron模型
- RF=bagging+random-combination CART
Out-Of-Bag(OOB) 估计:大约1/3的样本没有涵盖
- bagging:通过bootstrap抽取样本集D‘,但是有的样本是没有涵盖进去的
- out-of-bag (OOB) example:对每轮的抽取训练,没有被涵盖的样本
- 某个样本是某次抽取OOB的概率:\((1-\frac{1}{N})^N = \frac{1}{(\frac{N}{N-1})^N} = \frac{1}{(1+\frac{1}{N-1})^N} = \frac{1}{e}\),其中e是自然对数,N是原本数据集数量
- 所以,在每个子模型g中,OOB数目大约是\(\frac{1}{e} \times N\),即大约有1/3的样本此次没有被抽中
OOB vs validation:类似的效果验证
上面的bagging涉及到的bootstrap随机抽取数据集训练不同的模型的过程,是不是和交叉验证比较像,下表是两者选取数据集合训练的比较:
有几点值得注意:
- 验证表格中:蓝色是训练数据,红色是验证数据,两者没有交集
- OOB表格中:蓝色是训练数据,红色是OOB样本(约占1/3, \(\frac{1}{e}\))
-
OOB类似于验证数据集(都是未参与训练的),那么是否能用OOB验证构建的模型g的好坏呢?可以!
- 通常不验证单个g的好坏,只有组合的模型G表现足够好即可
- 问题转换:OOB验证g的好坏 =》OOB验证组合模型G的好坏
- 方法:
- 对每个OOB,看其属于哪些(有的样本可能是多个D’的OOB,因为每一轮都有约1/3的样本是OOB)模型g的OOB样本
- 计算这个OOB在这些g上的表现,求平均。
-
例子:\((x_N,y_N)\)是\(g_2,g_3,g_T\)的OOB,那么\((x_N,y_N)\)在\(G_N^-(N)\)上的表现是:\(G_N^-(N)=average(g_2,g_3,g_T)\)
-
这个做法类似于留一法验证,每次只对一个样本验证其在所属的所有的OOB的g模型上的表现(不是单个模型)
- 计算所有的OOB的表现:
- 平均表现:\(E_{oob}(G)=\frac{1}{N}\sum_{n=1}^Nerr(y_n,G_N^-(x_n))\),这就是G的好坏的估计,称为bagging或者随机森林的self-validation。
- self-validation相比validation优点:不需要重复训练。在validation中,选择了使得validation效果最好的数据集之后,还需要对所有的样本集进行训练,以得到最终模型。随机森林中得到最小的\(E_{oob}\)后,即完成了整个模型的建立。
特征选择
含义
特征选择:从d维特征到d‘特征的subset-transform,最终是由d’维特征进行模型训练。比如原来特征有10000个,选取300个,需要舍弃部分特征:
- 【1】冗余特征。重复出现,但是表达相似含义的,比如年龄和生日
- 【2】不相关特征。
优缺点
- 优点:
- 提高效率,特征越少,模型越简单。
- 正则化,防止特征过多出现过拟合。
- 去除无关特征,保留相关性大的特征,解释性强。
- 缺点:
- 特征筛选计算量大。
- 不同的特征组合,也容易发生过拟合。
- 容易选到无关特征,解释性差。
特征筛选:基于权重计算
筛选:计算每个特征的重要性(权重),再根据重要性的排序进行选择。
- 线性模型。容易计算,线性模型的加权系数就是每个特征的权重,所以加权系数的绝对值大小代表了特征的重要性。
- 非线性模型。难以计算,比如随机森林就是非线性模型,所以会有其他的方式进行特征选择。
随机森林的特征选择和效果评估
- 核心:random test
- 原理:对于某个特征,如果用一个随机值替代后表现比之前更差,则该特征很重要,权重应该大。(随机替代表现 =》重要性)
- 随机值选取:
- 【1】使用均匀或者高斯分布随机抽取值
-
【2】通过permutation方式,将原来的N个样本的第i个特征打乱(重新洗牌)
- 方法【2】更科学,保证了特征分布是近似的
- 【2】称为permutation test(随机排序测试):在计算第i个特征的重要性的时候,将N个样本的第i个特征重新洗牌,然后比较\(D\)和\(D^{(p)}\)表现的差异性。如果差异很大,则表明第i个特征是重要的。
- 如何衡量表现?(因为是要看\(D\)和\(D^{(p)}\)表现的差异)
- 之前介绍了\(E_{oob}(G)\)可以衡量,但是对于重新洗牌的数据\(D^{(p)}\),要重新训练,且每个特征都要训练,在比较与原来的\(D\)的效果,繁琐复杂。
- RF作者提出:把permutation的操作从原来的training上移到了OOB validation上去 \(E_{oob}(G^{(p)}) -> E_{oob}^{(p)}(G)\)
- 具体:训练时使用D,在OOB验证时,将所有的OOB样本的第i个特征重新洗牌,验证G的表现。
sklearn调用
>>> from sklearn.ensemble import RandomForestClassifier
>>> from sklearn.datasets import make_classification

# 构建数据集
>>> X, y = make_classification(n_samples=1000, n_features=4,
...                            n_informative=2, n_redundant=0,
...                            random_state=0, shuffle=False)

# 构建分类器
>>> clf = RandomForestClassifier(n_estimators=100, max_depth=2,
...                              random_state=0)

# 模型训练
>>> clf.fit(X, y)
RandomForestClassifier(bootstrap=True, class_weight=None, criterion='gini',
            max_depth=2, max_features='auto', max_leaf_nodes=None,
            min_impurity_decrease=0.0, min_impurity_split=None,
            min_samples_leaf=1, min_samples_split=2,
            min_weight_fraction_leaf=0.0, n_estimators=100, n_jobs=None,
            oob_score=False, random_state=0, verbose=0, warm_start=False)

# 获得每个特征的重要性分数
>>> print(clf.feature_importances_)
[0.14205973 0.76664038 0.0282433  0.06305659]

# 预测新数据
>>> print(clf.predict([[0, 0, 0, 0]]))
[1]
参考
Read full-text »
决策树算法
2018-07-28
目录
概述
决策树算法:由一个决策图和可能的结果(包括资源成本和风险)组成, 用来创建到达目标的规划。
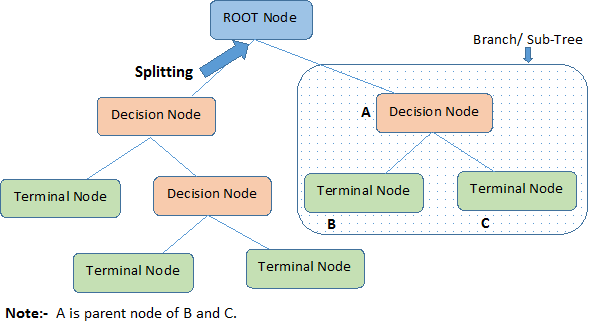
决策树流程图
建树步骤
决策树的构建通常包含3个步骤:
- 【1 特征选择】:选择什么特征进行分支,不同的算法采用不同的度量策略,比如ID3是基于信息增益最大的特征,C4.5则采用信息增益比,CART使用GINI系数
- 【2 生成决策树】:从从上至下递归的分支生成子节点
- 【3 剪枝】:决策树容易过拟合,所以需要缩小数的规模
建树的具体过程:
- 将所有的特征看成一个一个的节点(每次都是选取一个特征进行判断从而分支);
- 遍历每个特征,进行分割计算,计算每个特征划分前后的信息增值(比如熵值之差)。选取最好的特征(增益最大的、熵值最小的)进行分割,从而将数据划分为不同的子节点;
-
对子节点分别递归执行上一步,直到每个最终的子节点都足够’纯’或者都属于同一类别为止。
- 递归结束条件:1)遍历完所有的属性,2)每个分支下的所有实例归属同一类。

如何选取划分特征?
ID3
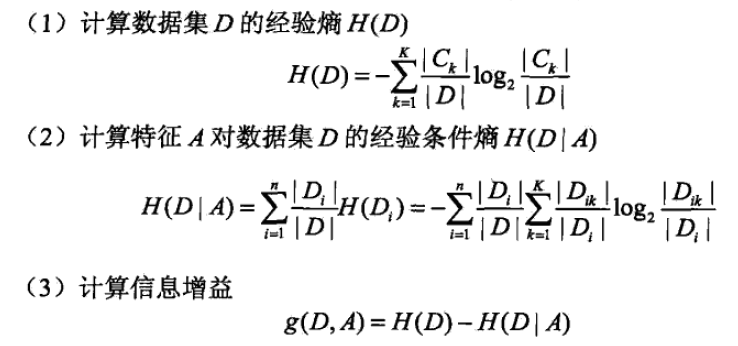
信息增益(Information Gain):划分数据集之前之后信息发生的变化,比如可以看熵值的变化,在每一个状态时具有一个熵值。
信息和熵值(Entropy)(参见下图的上半部分):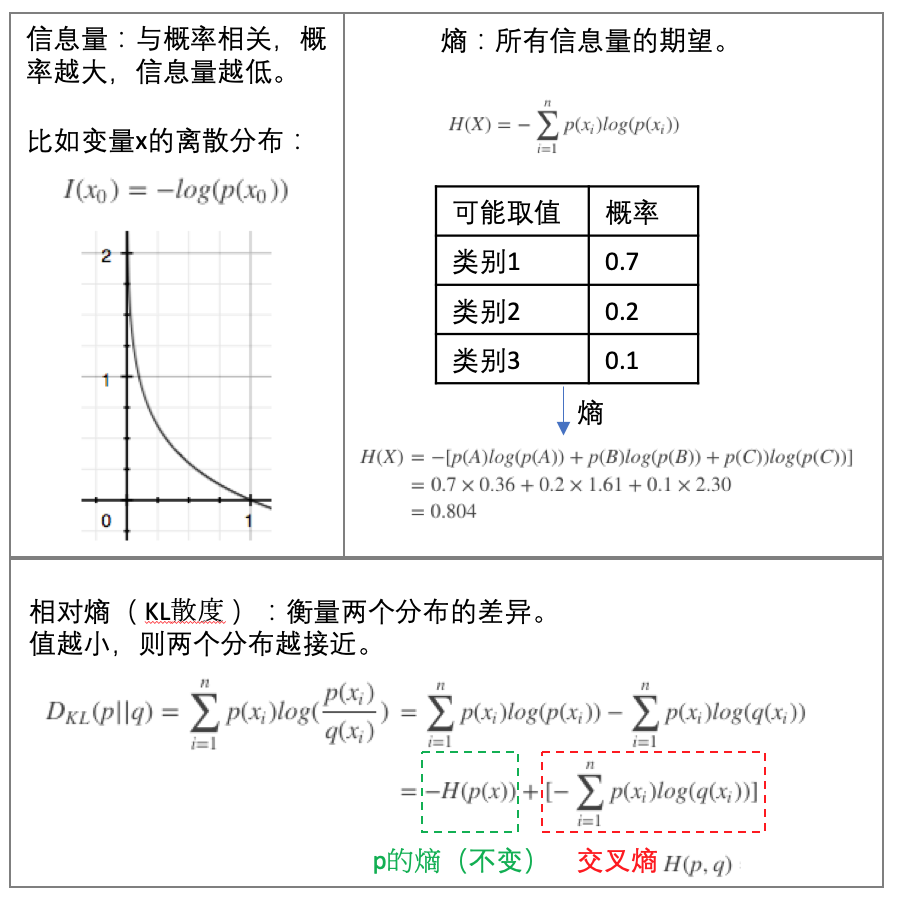
下面是一个例子,比较不同的特征进行数据分隔时的信息增益大小: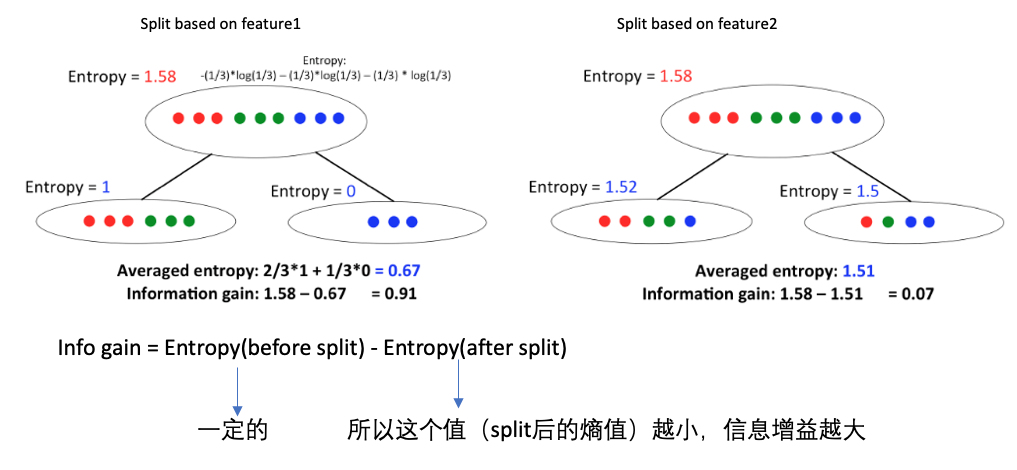
C4.5
ID3使用信息增益最大的特征作为分隔特征,这个对于特征是有偏向性的,具有多个值的特征其信息增益也容易大从而被选做分隔特征。为了消除这个,在C4.5中引入了信息增益比:
CART
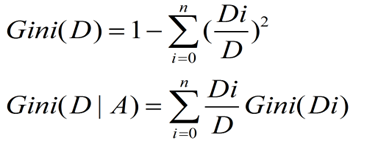
ID3和C4.5构建的树规模较大,为了提高建树的效率,CART方法被开发出来,其使用的是GINI系数来知道特征的选择:
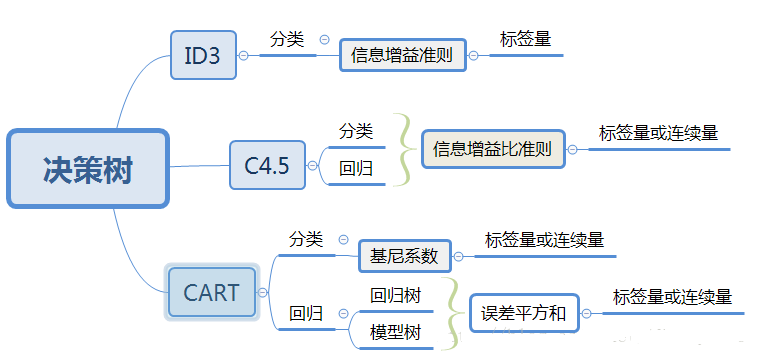
三种算法的比较:
损失函数
在经典的ID3中,每次选取的分隔特征都是信息增益最大的,这个可以保证最后的分类效果达到最好,其损失函数值也是最小的。具体的,其损失函数很像最大似然估计函数:
实现
Python源码版本
计算给定数据集的香秾熵值:1)统计数据集label的count数,2)转换为概率,3)概率乘以对数概率并加和:
def calcShannonEnt(dataSet):
    numEntries = len(dataSet)
    labelCounts = {}
    for featVec in dataSet: #the the number of unique elements and their occurance
        currentLabel = featVec[-1]
        if currentLabel not in labelCounts.keys(): labelCounts[currentLabel] = 0
        labelCounts[currentLabel] += 1
    shannonEnt = 0.0
    for key in labelCounts:
        prob = float(labelCounts[key])/numEntries
        shannonEnt -= prob * log(prob,2) #log base 2
    return shannonEnt
划分数据集:对于给定的数据集,循环其每一个特征,计算特征对应的香农熵,选取其中熵值最小(信息增益最大)的特征作为划分的特征:
def chooseBestFeatureToSplit(dataSet):
    numFeatures = len(dataSet[0]) - 1      #the last column is used for the labels
    baseEntropy = calcShannonEnt(dataSet)
    bestInfoGain = 0.0; bestFeature = -1
    for i in range(numFeatures):        #iterate over all the features
        featList = [example[i] for example in dataSet]#create a list of all the examples of this feature
        uniqueVals = set(featList)       #get a set of unique values
        newEntropy = 0.0
        for value in uniqueVals:
            subDataSet = splitDataSet(dataSet, i, value)
            prob = len(subDataSet)/float(len(dataSet))
            newEntropy += prob * calcShannonEnt(subDataSet)
        infoGain = baseEntropy - newEntropy     #calculate the info gain; ie reduction in entropy
        if (infoGain > bestInfoGain):       #compare this to the best gain so far
            bestInfoGain = infoGain         #if better than current best, set to best
            bestFeature = i
    return bestFeature                      #returns an integer
sklearn版本
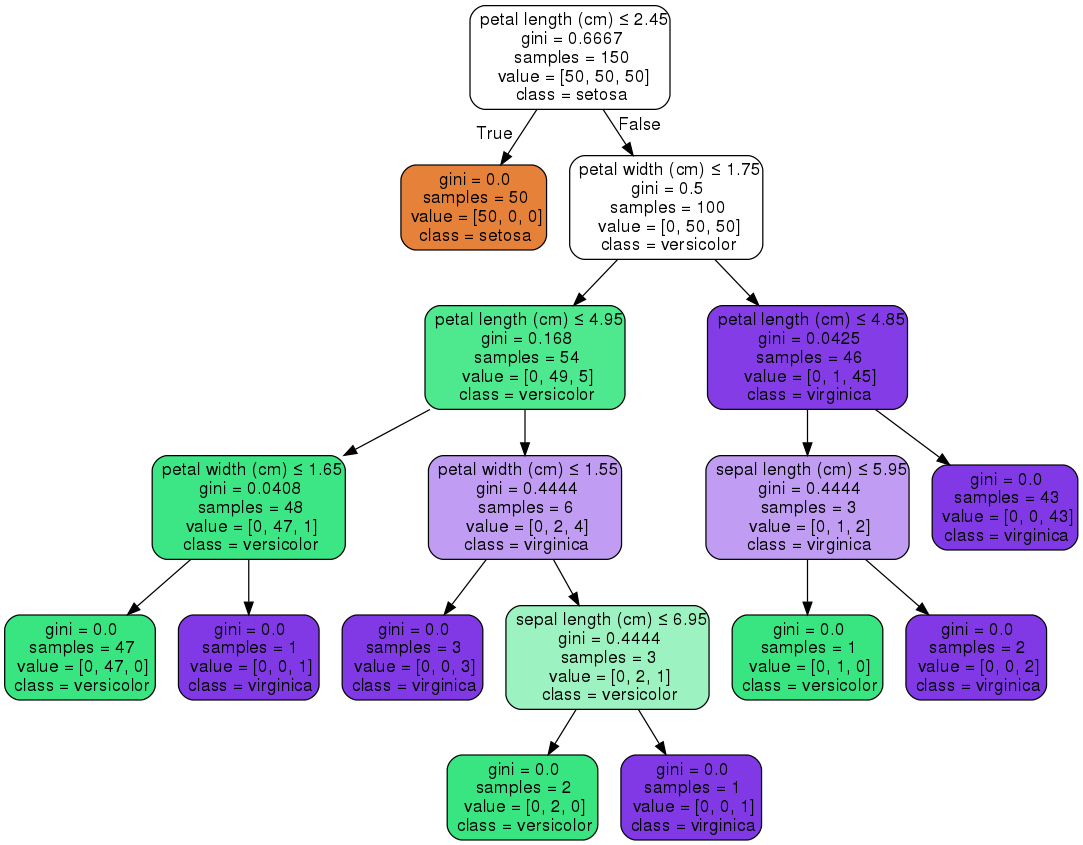
对于iris数据集应用决策树,过程中会搜索选取不同的特征及其阈值,以作为分隔的特征(节点):
from sklearn.datasets import load_iris
from sklearn import tree

# Load in our dataset
iris_data = load_iris()

# Initialize our decision tree object
classification_tree = tree.DecisionTreeClassifier()

# Train our decision tree (tree induction + pruning)
classification_tree = classification_tree.fit(iris_data.data, iris_data.target)

import graphviz
dot_data = tree.export_graphviz(classification_tree, out_file=None,
                     feature_names=iris.feature_names,
                     class_names=iris.target_names,
                     filled=True, rounded=True,
                     special_characters=True)
graph = graphviz.Source(dot_data)
graph.render("iris")
参考
- 机器学习实战第3章
- Lecture 15: Tree-based Algorithms
- A Guide to Decision Trees for Machine Learning and Data Science
- 三种决策树算法(ID3, CART, C4.5)及Python实现
- 决策树模型 ID3/C4.5/CART算法比较
Read full-text »
Think Stats: distribution calculation
2018-07-28
分布的运算:
- 偏度(skewness)是度量分布函数不对称程度的统计量。负的偏度表示分布向左偏(skews left),此时分布函数的左边会比右边延伸得更长;正的偏度表示分布函数向右偏。
- 判断偏度另一方法:比较均值和中位数的大小。
- 乌比冈湖效应(Lake Wobegon effect):虚幻的优越性( illusory superiority),是指人们通常会觉得自己各方面的能力都比社会上的平均水平高的一种心理倾向。
- 基尼系数(Gini coefficient)是一个衡量收入不平衡程度的指标。
- 随机变量(random variable):代表产生随机数的过程。
- 累计分布函数:CDFX(x)=P(X≤x),随机变量X小于等于x的概率。
- 概率密度函数(probability density function,PDF):累积分布函数的导数。表示的不是概率,而是概率密度。因为其求导的来源是累计分布,表示某个数值点上概率的密度大小,而不是直接的概率值的大小。衡量:
x轴上每个单位的概率。通过数值积分,可计算变量X在某个区间的概率。 - 卷积:PDFZ=PDFY∗PDFX,两个随机变量的和的分布就等于两个概率密度的
卷积。卷积不是直接概率密度的相乘,是去所有值的积分。 - 正太分布的性质:对线性变换和卷积运算是封闭的(closed)。线性:\(\begin{align} X ~ (\mu, \sigma), X1 = aX + b => X1 ~ (a\mu+b, a^2\sigma) \end{align}\)。
- 中心极限定理(Central Limit Theorem):如果将大量服从某种分布的值加起来,所得到的和会收敛到正态分布。条件:1)用于求和的数据必须满足独立性;2)数据必须服从同一个分布;3)这些数据分布的均值和方差必须是有限的;4)收敛的速度取决于原来分布的偏度:指数分布很快收敛,对数正太分布,收敛速度慢。
- 分布函数之间的关系:
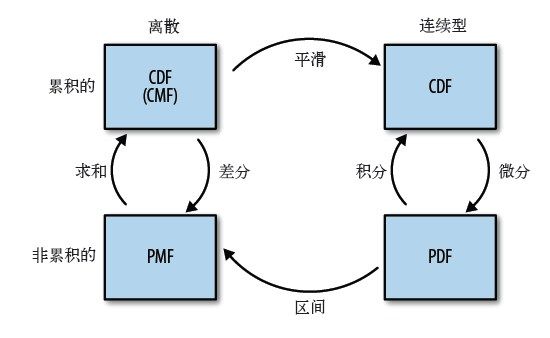
术语:
- 中心极限定理(Central Limit Theorem)** 早期的统计学家弗朗西斯·高尔顿爵士认为中心极限定理是“The supreme law of Unreason”。
- 卷积(convolution) 一种运算,用于计算两个随机变量的和的分布。
- 虚幻的优越性(illusory superiority) 心理学概念,是指人们普遍存在的将自己高估的一种心理。
- 概率密度函数(probability density function) 连续型累积分布函数的导数。
- 随机变量(random variable) 一个能代表一种随机过程的客体。
- 随机数(random variate) 随机变量的实现。
- 鲁棒性(robust) 如果一个统计量不容易受到异常值的影响,我们说它是鲁棒的。
- 偏度(skewness) 分布函数的一种特征,它度量的是分布函数的不对称程度。
Read full-text »
EM算法
2018-07-25
目录
最大似然
最大似然的想法经常被用到
具体到这个例子中,有如下过程:
- 假设\(\theta\)为黑球的占比,所以\(\theta_甲=0.01\),\(\theta_乙=0.99\)
- 只取一次,只有1个样本,随机独立,所以每个样本服从\(p=\theta\)的伯努利分布
- 计算似然值(在不同\(\theta\)取值下,出现某个数据集的可能性):
- 甲箱:\(ln P_X(x_1,...,x_n;\theta_甲)=\sum_{i=1}^nln(x_i;\theta_甲)=ln(0.01)\)
- 乙箱:\(ln P_X(x_1,...,x_n;\theta_甲)=\sum_{i=1}^nln(x_i;\theta_甲)=ln(0.99)\)
- 所以最可能的是乙箱
调查学校男女生身高
- 抽样男生100,女生100,量取身高,左手边是男生,右手边是女生(注意:男女生分开)
- 假设男生女生身高服从高斯分布,但是分布的均值和方差未知
-
需要估计模型参数:即均值和方差
- 从分布是\(p(x\|θ)\)的总体样本中抽取到这100个样本的概率,也就是样本集X中各个样本的联合概率: \(L(\theta)=L(x_1,...,x_n;\Theta)=\prod p(x_i;\theta), \theta\subset\Theta\)
- 只有\(\theta\)是未知的,所以是\(\theta\)的函数
- 要使得\(L(\theta)\)取到最大值,值需要对\(\theta\)求导,求得导数=0时的\(\theta\)值即可。
- 函数:反应了在不同的参数\(\theta\)取值下,取的当前这个样本集的可能性,因此称为参数\(\theta\)相对于样本集\(X\)的似然函数。
最大似然的思想
- 内容:已知某个随机样本满足某种概率分布,但是其中具体的参数不清楚,参数估计就是通过若干次试验,观察其结果,利用结果推出参数的大概值。
- 思想:已知某个参数能使这个样本出现的概率最大,我们当然不会再去选择其他小概率的样本,所以干脆就把这个参数作为估计的真实值。
求最大似然函数估计值的一般步骤
- (1)写出似然函数;
- (2)对似然函数取对数,并整理;
- (3)求导数,令导数为0,得到似然方程;
- (4)解似然方程,得到的参数即为所求;
为什么需要EM算法?
- 最大似然估计的拓展
- 模型的数据不完备:比如某些属性值是缺失的
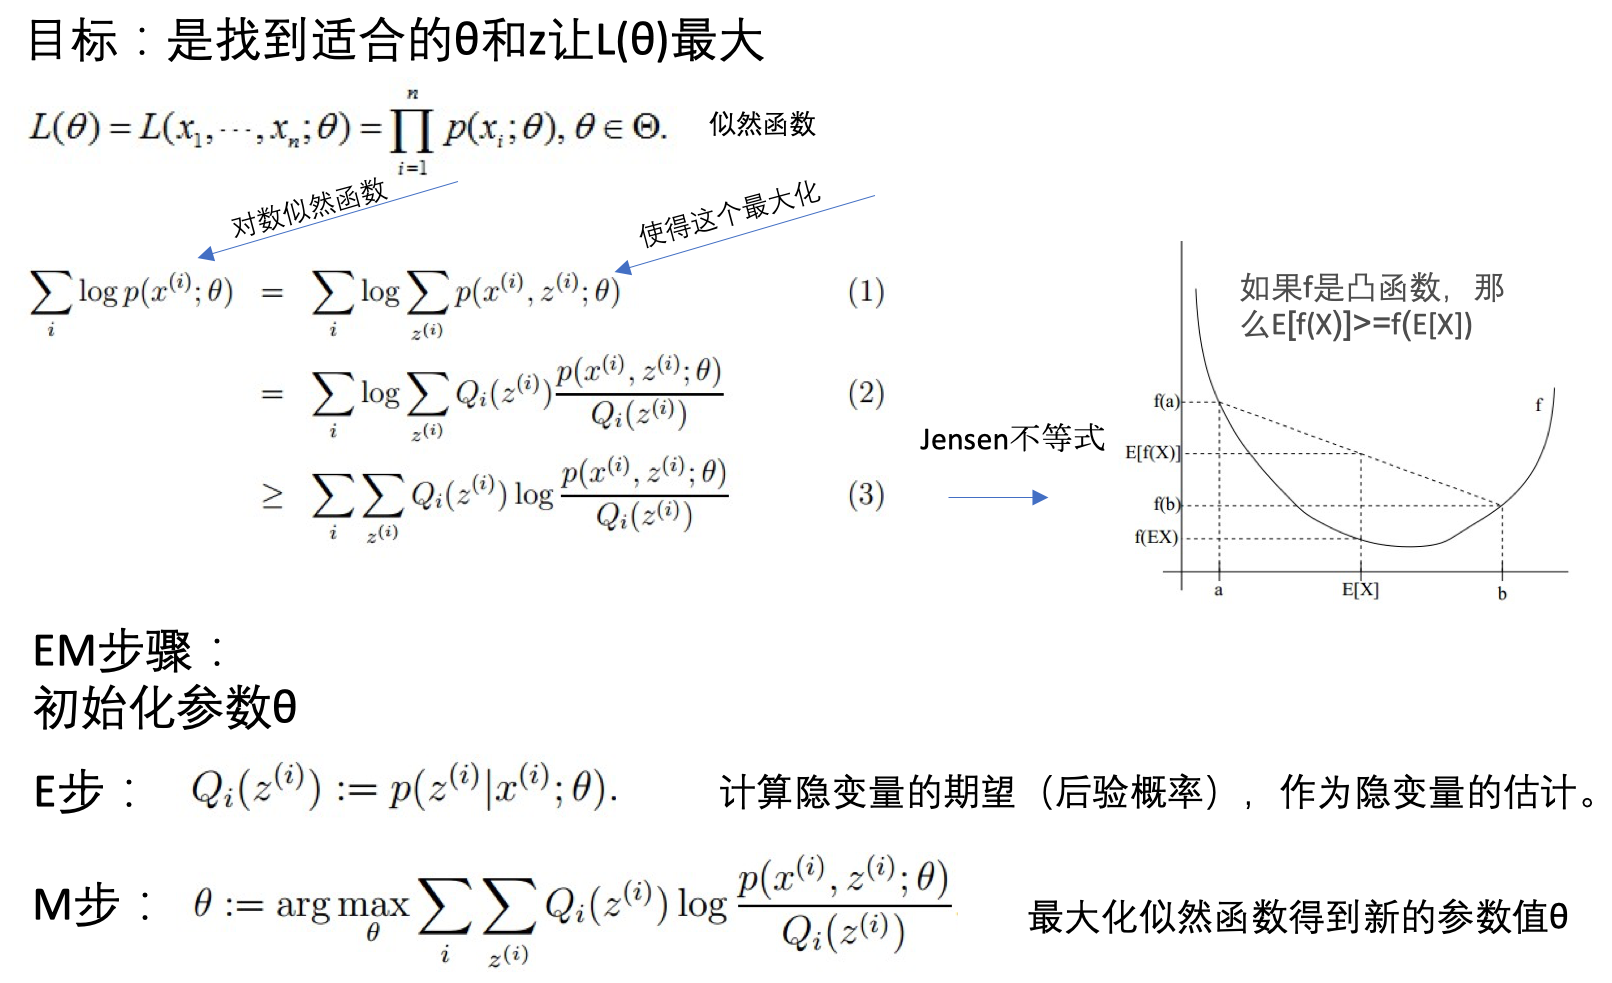
EM算法原理:期望最大化算法(Expectation-Maximization)
原理
- 若参数\(\Theta\)已知,则可根据训练数据集推断出最优隐变量\(Z\)的值(E步);反之,若最优隐变量\(Z\)的值已知,可方便的对参数\(\Theta\)做极大似然估计(M步)。
对模型参数\(\Theta\)做极大似然估计:
- 隐变量(latent variable):未观测的变量\(Z\)
- 已观测变量集:\(X\)
- 模型参数:\(\Theta\)
- 最大化对数似然:\(LL(\Theta\|X,Z)=lnP(X,Z\|\Theta)\)
- 问题:\(Z\)是隐变量,无法直接进行求解
先计算隐变量的期望,再估计模型参数:
- 解决:通过对\(Z\)计算期望,来最大化已观测数据的对数边际似然(marginal likelihood)
- 对数边际似然:\(LL(\Theta\|X)=lnP(X\|\Theta)=ln\sum_{Z}P(X,Z\|\Theta)\)
EM步骤两步
- 基于\(\Theta^t\)推断隐变量\(Z\)的期望,记为\(Z^t\)
- 基于已观测变量\(X\)和\(Z^t\)对参数\(\Theta\)做极大似然估计,记为\(\Theta^(t+1)\)
- 交替直到收敛
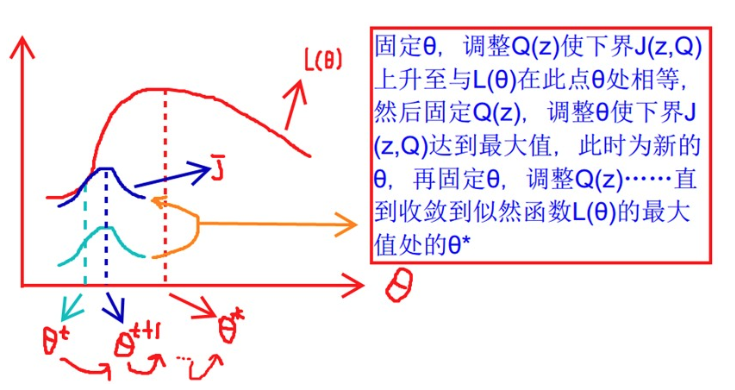
EM图解
- 固定\(\theta\),调整\(Q(z)\)使得下界\(J(z,Q)\)上升至于\(L(\theta)\)在此点\(\theta\)相等
- 然后固定\(Q(z)\),调整\(\theta\)使得下界\(J(z,Q)\)达到最大值(\(\theta^t\)到\(\theta^(t+1)\))
- 再固定\(\theta\),调整\(Q(z)\)。。。
- 直到收敛到似然函数\(L(\theta)\)的最大值处\(\theta^*\)
EM算法特点
- 估计隐变量参数
- 是迭代算法
EM算法例子
调查学校男女生身高:引入隐变量
- 抽样男生100,女生100,量取身高,但是男女生是在一起的。
- 假设男生女生身高分别服从高斯分布,但是对应分布的均值和方差未知
- 问题:随便指定一个身高,不知道是来自男生还是女生?
- 描述:抽取得到的每个样本都不知道是从哪个分布抽取的
- 所以这里既有有了隐变量:抽取得到的每个样本都不知道是从哪个分布抽取的
- 需要估计模型参数:即各自的均值和方差
抛硬币的例子
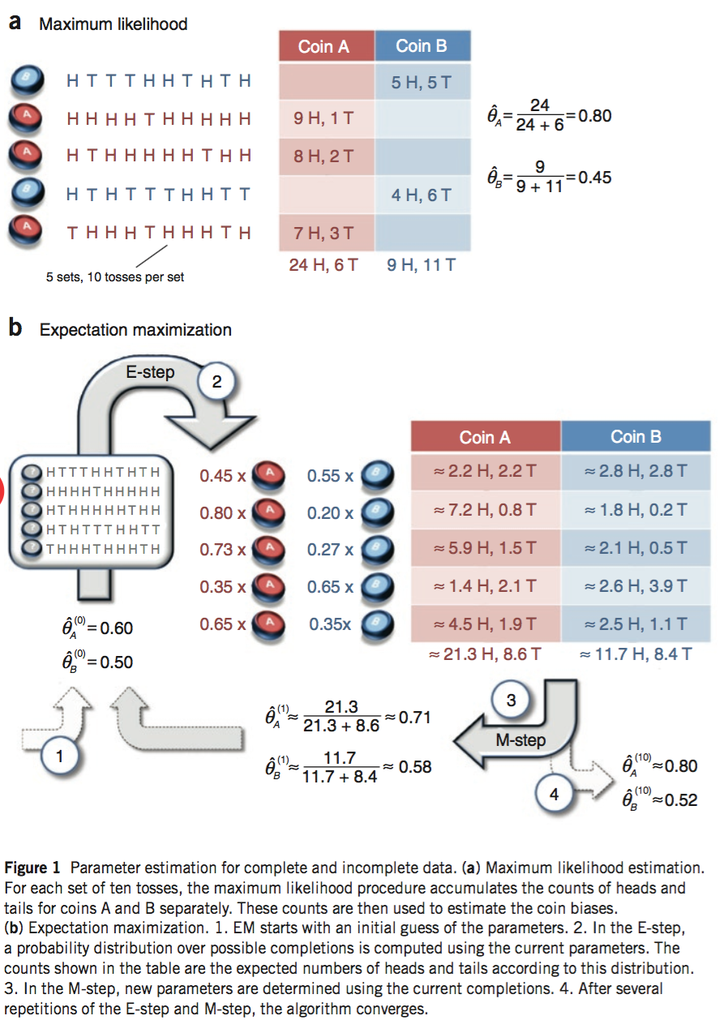
现在有两个硬币A和B,要估计的参数是它们各自翻正面(head)的概率。观察的过程是先随机选A或者B,然后扔10次。以上步骤重复5次。
- 如果知道每次选的是A还是B,那可以直接估计(见下图a)。
- 如果不知道选的是A还是B(隐变量),只观测到5次循环共50次投币的结果,这时就没法直接估计A和B的正面概率。EM算法此时可起作用(见下图b)。
抛两枚硬币模型的python实现
具体参考这里:
对于第一次的抛,测试输出是否和论文一致:
# 硬币投掷结果观测序列
observations = np.array([[1, 0, 0, 0, 1, 1, 0, 1, 0, 1],
                         [1, 1, 1, 1, 0, 1, 1, 1, 1, 1],
                         [1, 0, 1, 1, 1, 1, 1, 0, 1, 1],
                         [1, 0, 1, 0, 0, 0, 1, 1, 0, 0],
                         [0, 1, 1, 1, 0, 1, 1, 1, 0, 1]])

coin_A_pmf_observation_1 = stats.binom.pmf(5,10,0.6)
coin_B_pmf_observation_1 = stats.binom.pmf(5,10,0.5)

normalized_coin_A_pmf_observation_1 = coin_A_pmf_observation_1/(coin_A_pmf_observation_1+coin_B_pmf_observation_1)

# 更新在当前参数下A、B硬币产生的正反面次数
counts['A']['H'] += weight_A * num_heads
counts['A']['T'] += weight_A * num_tails
counts['B']['H'] += weight_B * num_heads
counts['B']['T'] += weight_B * num_tails

# 在初始化的theta下,AB分别产生正反面的次数被估计出来了
# 可以基于结果更新theta了
new_theta_A = counts['A']['H'] / (counts['A']['H'] + counts['A']['T'])
new_theta_B = counts['B']['H'] / (counts['B']['H'] + counts['B']['T'])
# new_theta_A=0.713
# new_theta_B=0.581
# 是和论文一致的
完整的模型:
def em_single(priors, observations):
    """
    EM算法单次迭代
    Arguments
    ---------
    priors : [theta_A, theta_B]
    observations : [m X n matrix]

    Returns
    --------
    new_priors: [new_theta_A, new_theta_B]
    :param priors:
    :param observations:
    :return:
    """
    counts = {'A': {'H': 0, 'T': 0}, 'B': {'H': 0, 'T': 0}}
    theta_A = priors[0]
    theta_B = priors[1]
    # E step
    for observation in observations:
        len_observation = len(observation)
        num_heads = observation.sum()
        num_tails = len_observation - num_heads
        contribution_A = stats.binom.pmf(num_heads, len_observation, theta_A)
        contribution_B = stats.binom.pmf(num_heads, len_observation, theta_B)   # 两个二项分布
        weight_A = contribution_A / (contribution_A + contribution_B)
        weight_B = contribution_B / (contribution_A + contribution_B)
        # 更新在当前参数下A、B硬币产生的正反面次数
        counts['A']['H'] += weight_A * num_heads
        counts['A']['T'] += weight_A * num_tails
        counts['B']['H'] += weight_B * num_heads
        counts['B']['T'] += weight_B * num_tails
    # M step
    new_theta_A = counts['A']['H'] / (counts['A']['H'] + counts['A']['T'])
    new_theta_B = counts['B']['H'] / (counts['B']['H'] + counts['B']['T'])
    return [new_theta_A, new_theta_B]

def em(observations, prior, tol=1e-6, iterations=10000):
    """
    EM算法
    :param observations: 观测数据
    :param prior: 模型初值
    :param tol: 迭代结束阈值
    :param iterations: 最大迭代次数
    :return: 局部最优的模型参数
    """
    import math
    iteration = 0
    while iteration < iterations:
        new_prior = em_single(prior, observations)
        delta_change = np.abs(prior[0] - new_prior[0])
        if delta_change < tol:
            break
        else:
            prior = new_prior
            iteration += 1
    return [new_prior, iteration]

# 调用EM算法
print em(observations, [0.6, 0.5])
# [[0.79678875938310978, 0.51958393567528027], 14] # 这个结果与论文一致
参考
- EM算法 @ 机器学习周志华第七章
- 从最大似然到EM算法浅解
- 怎么通俗易懂地解释EM算法并且举个例子?@知乎
- EM算法Python实战
Read full-text »
K-近邻算法
2018-07-21
概述
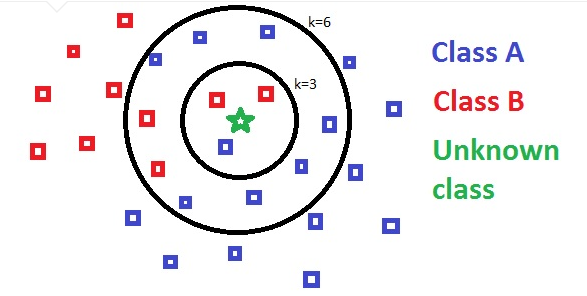
K-近邻算法(k-nearest neighbors, KNN):对于要进行分类的数据,与已知的数据进行比较,计算相似性,找出最相似的K个,然后看这个K个的所属类别,最高概率的类别即为目标变量的分类。
可视化图解 (KDnuggets):

- 原理:采用不同特征值之间的距离进行分类。
- 优点:精度高,对异常值不敏感,无数据输入假定
- 缺点:计算复杂性高,空间复杂度高
- 适用:数值型,标称型
当选定不同的K值大小时,预测对应的分类可能不同,所以需要尝试不同的K值。下图中,当k=3时,会预测为B类型,当k=6时,会预测为A类型。
实现
任务:改善约会网站的配对效果
数据集:(4列)
- 每年飞行里程数
- 玩游戏所占时间比例
- 每周消费的冰激凌公升数
- 约会好感度(标签列,largeDoses:魅力很大,smallDoses:魅力一般,didntLike:不喜欢)
gongjing@MBP ..eafileSyn/github/MLiA/source_code/Ch02 % head datingTestSet.txt
40920	8.326976	0.953952	largeDoses
14488	7.153469	1.673904	smallDoses
26052	1.441871	0.805124	didntLike
75136	13.147394	0.428964	didntLike
读取数据集的函数:
def file2matrix(filename):
    fr = open(filename)
    numberOfLines = len(fr.readlines())         #get the number of lines in the file
    returnMat = zeros((numberOfLines,3))        #prepare matrix to return
    classLabelVector = []                       #prepare labels return
    fr = open(filename)
    index = 0
    for line in fr.readlines():
        line = line.strip()
        listFromLine = line.split('\t')
        returnMat[index,:] = listFromLine[0:3]
        # label是最后一列,但是是str类型,不能用int转换
        # classLabelVector.append(int(listFromLine[-1]))
        classLabelVector.append(listFromLine[-1])
        index += 1
    return returnMat,classLabelVector
Python源码版本
归一化函数:在这个数据集中,不同的特征单位不同,数值差异很大,因而在计算不同样本的相似性时,数值大的特征会很大程度上决定了相似性的数值,所以需要把不同的特征都归一化到一致的范围。通常转换为[0,1]或者[-1,1],这里是通过转换将值归一化到0-1之间:newValue = (oldValue - min) / (max - min)
def autoNorm(dataSet):
    minVals = dataSet.min(0)
    maxVals = dataSet.max(0)
    ranges = maxVals - minVals
    normDataSet = zeros(shape(dataSet))
    m = dataSet.shape[0]
    normDataSet = dataSet - tile(minVals, (m,1))
    normDataSet = normDataSet/tile(ranges, (m,1))   #element wise divide
    return normDataSet, ranges, minVals
KNN分类函数(python是实现):
def classify0(inX, dataSet, labels, k):
    dataSetSize = dataSet.shape[0]
    diffMat = tile(inX, (dataSetSize,1)) - dataSet
    sqDiffMat = diffMat**2
    sqDistances = sqDiffMat.sum(axis=1)
    distances = sqDistances**0.5
    sortedDistIndicies = distances.argsort()
    classCount={}
    for i in range(k):
        voteIlabel = labels[sortedDistIndicies[i]]
        classCount[voteIlabel] = classCount.get(voteIlabel,0) + 1
    sortedClassCount = sorted(classCount.iteritems(), key=operator.itemgetter(1), reverse=True)
    return sortedClassCount[0][0]
对约会数据进行读取分类:
def datingClassTest():
    hoRatio = 0.50      #hold out 10%
    datingDataMat,datingLabels = file2matrix('datingTestSet.txt')       #load data setfrom file
    normMat, ranges, minVals = autoNorm(datingDataMat)
    m = normMat.shape[0]
    numTestVecs = int(m*hoRatio)
    errorCount = 0.0
    for i in range(numTestVecs):
        classifierResult = classify0(normMat[i,:],normMat[numTestVecs:m,:],datingLabels[numTestVecs:m],3)
        print "the classifier came back with: %s, the real answer is: %s" % (classifierResult, datingLabels[i])
        if (classifierResult != datingLabels[i]): errorCount += 1.0
    print "the total error rate is: %f" % (errorCount/float(numTestVecs))
    print errorCount
the classifier came back with: largeDoses, the real answer is: largeDoses
the classifier came back with: smallDoses, the real answer is: smallDoses
......

the total error rate is: 0.064000
32.0 # 当hold out数据比例为10%时,有5个预测错误了。
sklearn版本
df = pd.read_csv('./datingTestSet.txt', header=None, sep='\t')
df.head()

# 构建测试集和训练集
# 前面10%的数据作为测试集,后面90%的数据作为训练集
hoRatio = 0.1
X_test = df.ix[0:hoRatio*df.shape[0]-1, 0:2]
print X_test.shape
y_test = df.ix[0:hoRatio*df.shape[0]-1, 3]
print y_test.shape
X_train = df.ix[hoRatio*df.shape[0]:, 0:2]
print X_train.shape
y_train = df.ix[hoRatio*df.shape[0]:, 3]
print y_train.shape

from sklearn.neighbors import KNeighborsClassifier
from sklearn import metrics

knn = KNeighborsClassifier(n_neighbors=3)
knn.fit(X_train, y_train)
y_pred = knn.predict(X_test)
metrics.accuracy_score(y_test, y_pred)

# accuracy: 0.76, 有24个预测错误了
参考
- 机器学习实战第2章
- ApacheCN:第2章 k-近邻算法
Read full-text »
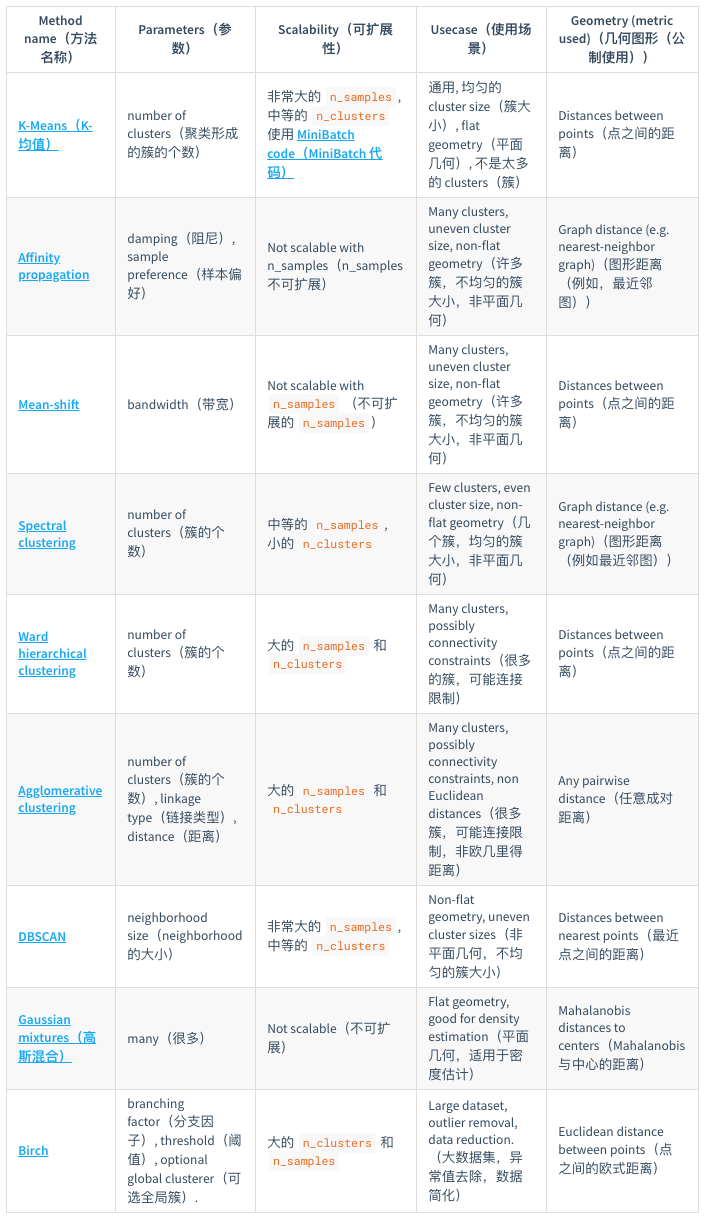
聚类算法
2018-07-18
目录
聚类任务
- 无监督学习任务
- 聚类(clustering)
- 密度估计(density estimation)
- 异常检测(anomaly detection)
- 聚类
聚类结果的性能度量
- 性能度量:有效性指标(validity index),类似于监督学习中的性能度量
- 什么样的类好?
- 直观:物以类聚
- 归纳:簇内(intra-cluster)相似度高而簇间(inter-cluster)相似度低
- 度量分类:
- 外部指标:external index,将聚类结果与某个参考模型进行比较
- 内部指标:internal index,直接考察聚类结果而不利用任何参考模型
- F值
- 互信息:mutual information
- 平均廓宽:average silhouette width
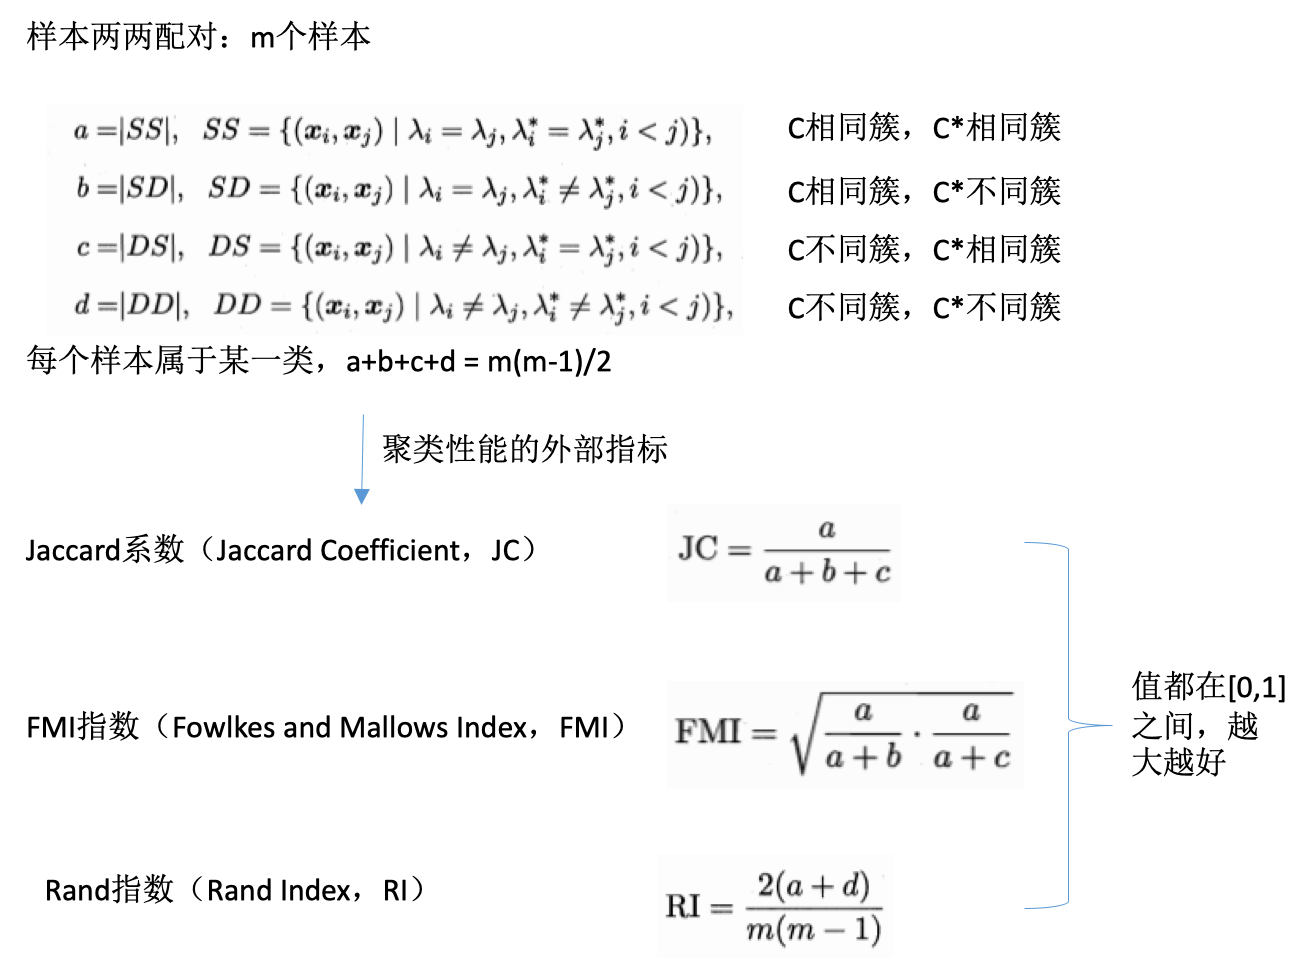
度量:外部指标
定义:
- 数据集:\(D={x_1,x_2,...,x_n}\)
- 聚类结果的簇划分:\(C={C_1,C_2,...,C_n}\)
- 参考模型的簇划分:\(C^*={C^*_1,C^*_2,...,C^*_n}\)
- \(C\)的簇标记向量
- \(C^*\)的簇标记向量
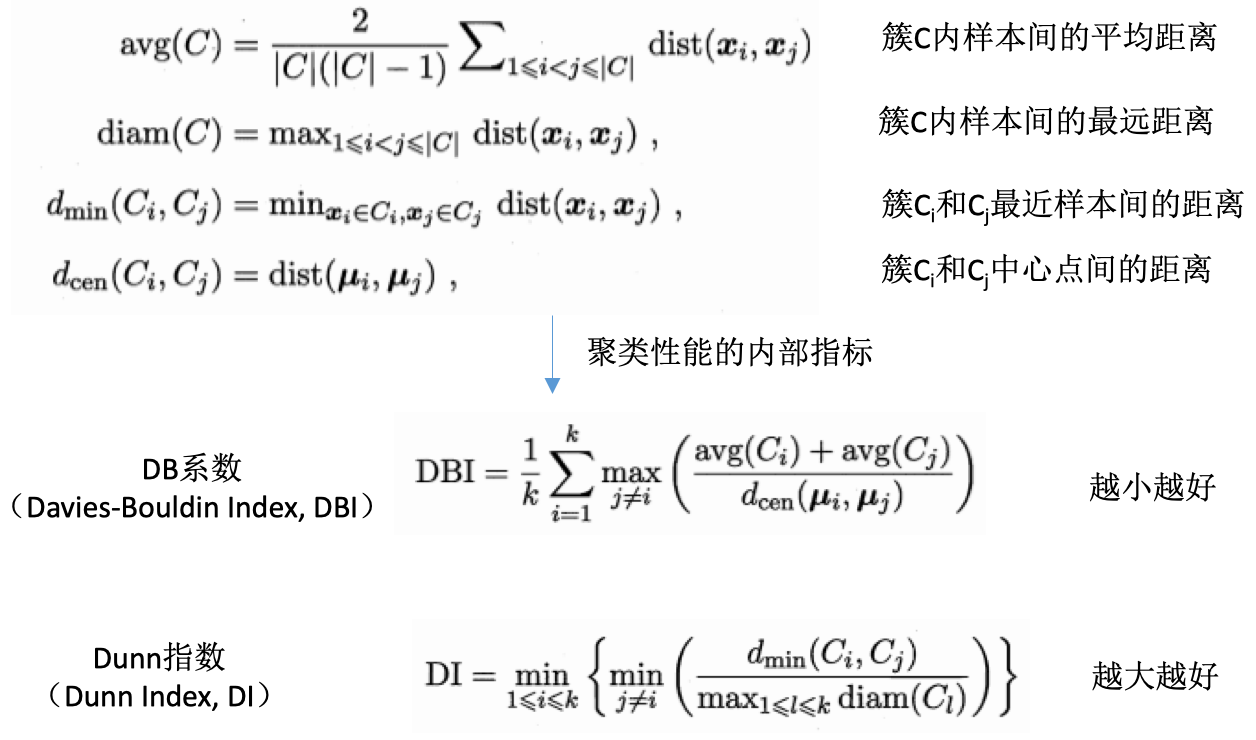
度量:内部指标
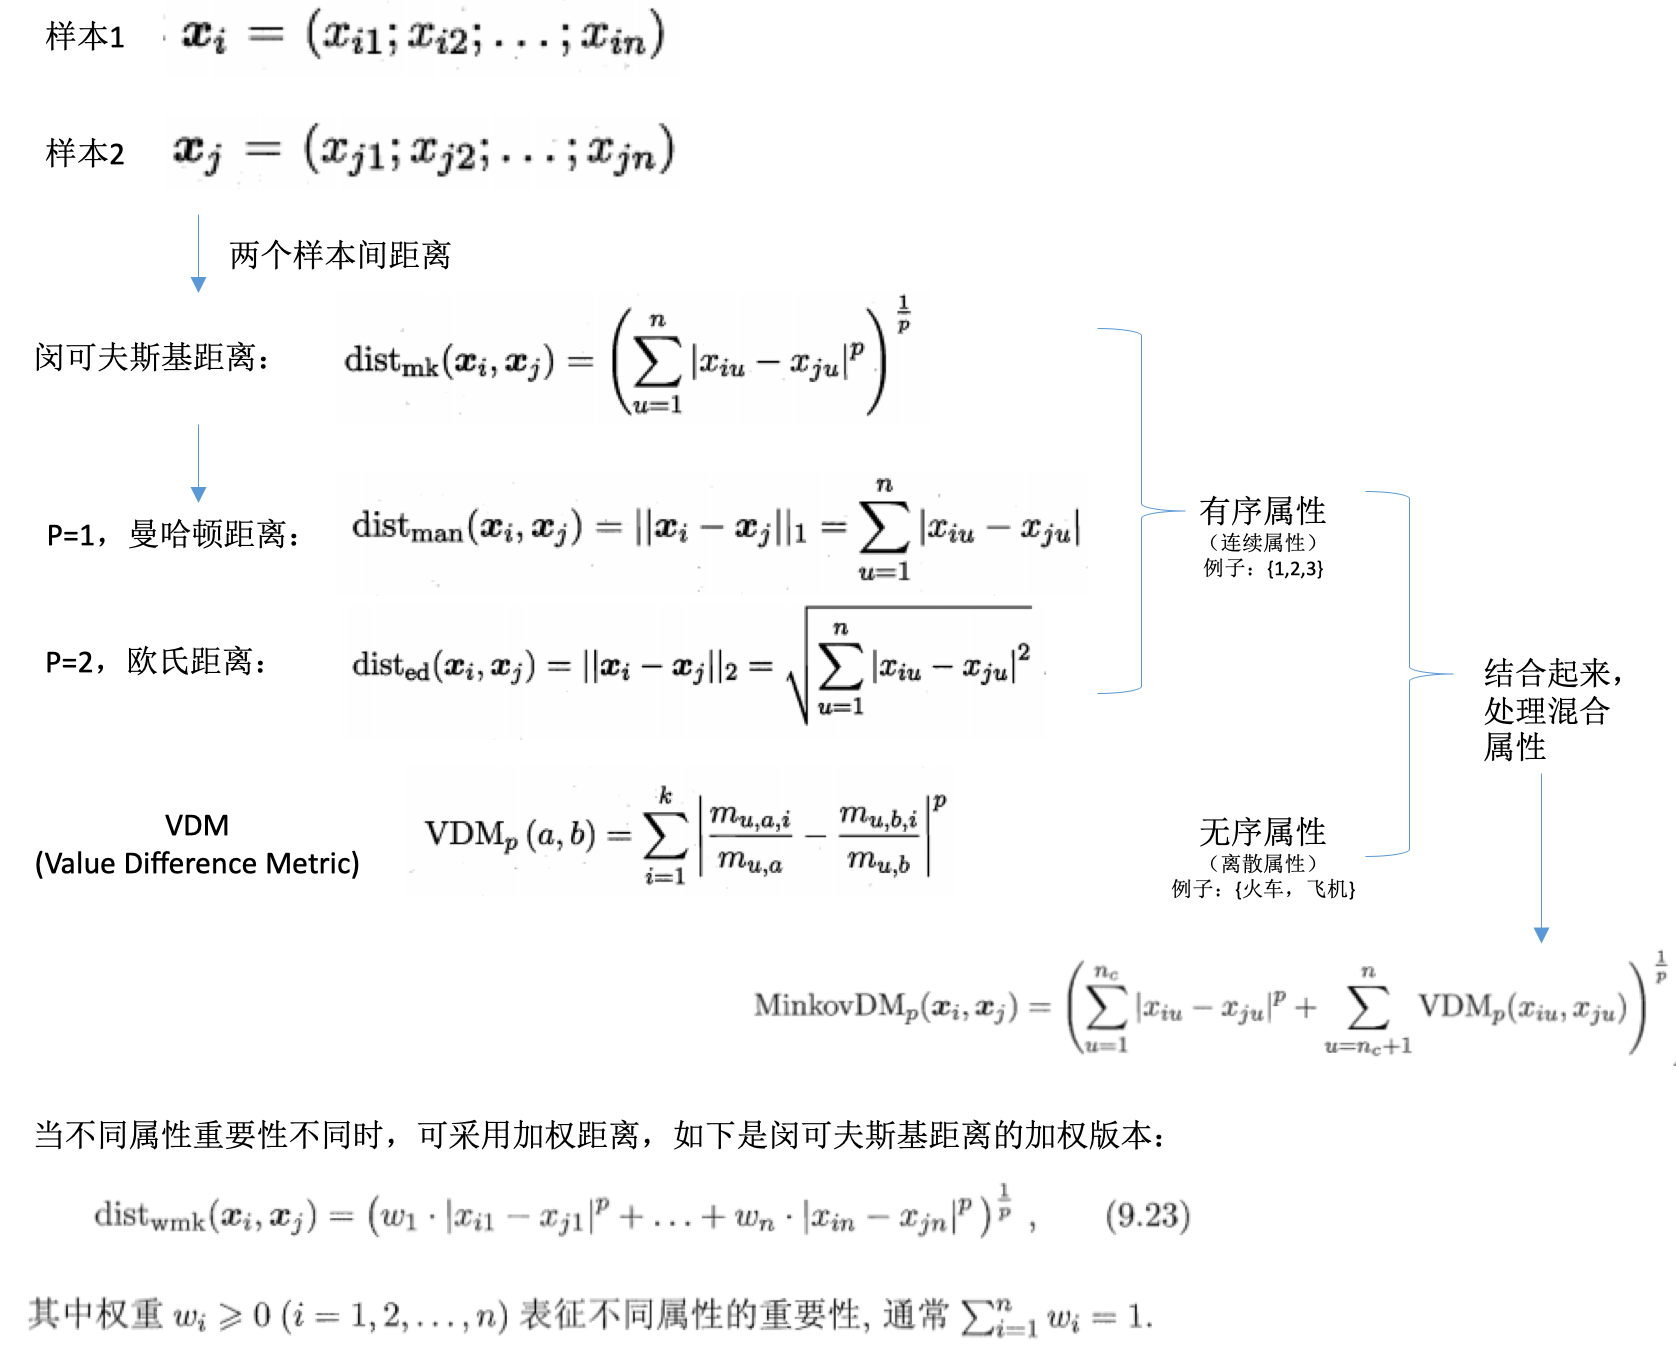
距离计算
- 距离度量:样本之间的距离
- 基本性质:
- 非负性:\(dist(x_i,x_j) \geq 0\)
- 同一性:\(dist(x_i,x_j)=0,当且仅当x_i=x_j\)
- 对称性:\(dist(x_i,x_j)=dist(x_j,x_i)\)
- 直递性:\(dist(x_i,x_j) \leq dist(x_i,x_k)dist(x_k,x_j)\)
- 不同的度量:
- 还有其他的距离计算方式,比如:
- 內积距离
- 余弦距离
原型聚类
- 原型聚类:基于原型的聚类(prototype-based clustering)
- 原型:样本空间中具有代表性的点
- 基础:假设聚类结构能通过一组原型刻画
k-均值聚类
详细请参见另一篇博文K均值聚类算法,其算法流程如下: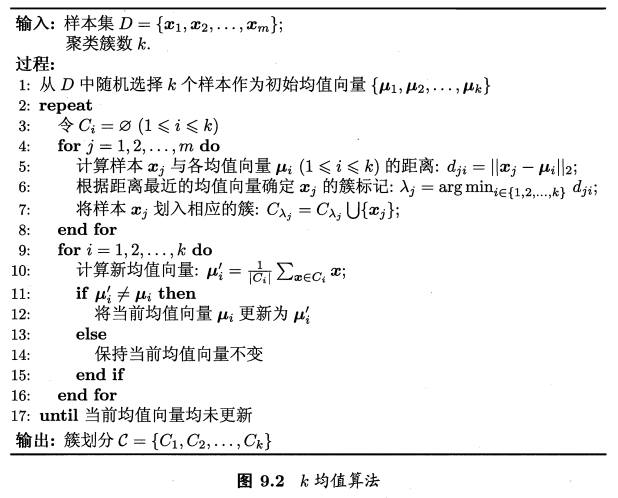
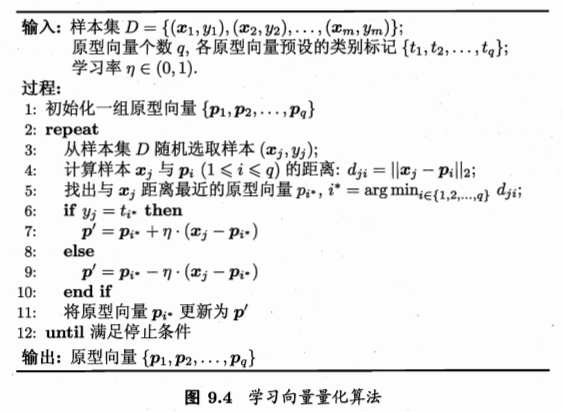
学习向量量化聚类
- 学习向量量化:Learning Vector Quantization, LVQ
- 类似于k均值,寻找一组原型向量
- 但是是假设数据样本带有类别标记,学习的过程中会使用这些标记以辅助聚类
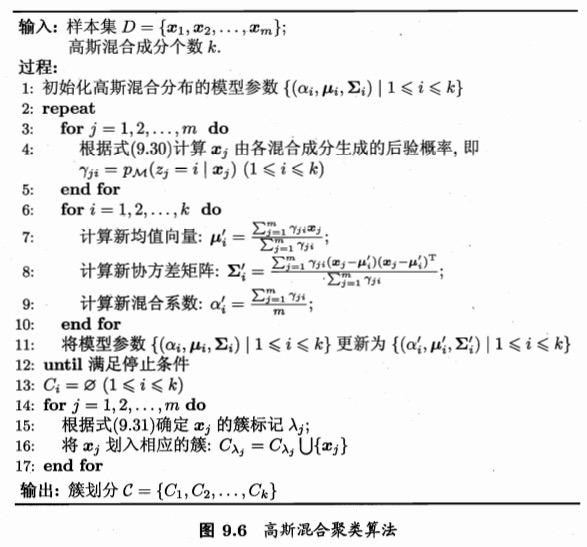
高斯混合聚类
- k均值、LVQ:使用原型向量
- 高斯混合:mixture of gaussian,采用概率模型来表达聚类原型,而非向量
密度聚类
- 密度聚类:density-based clustering
- 基础:假设聚类结构能通过样本分布的紧密程度确定
- 样本密度 -》样本的可连接性,基于可连接样本扩展聚类簇,得到最终聚类结果
- 聚类方法:
- DBSCAN
- OPTICS
- DIANA:自顶向下
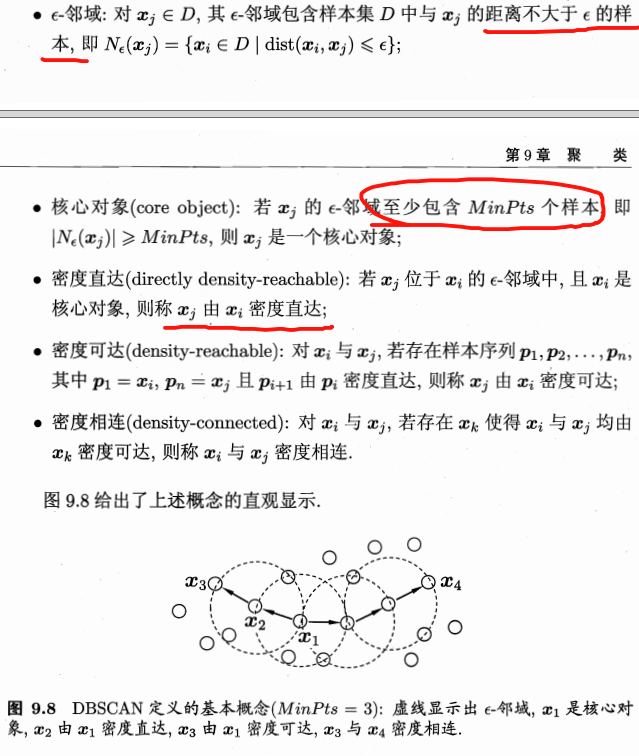
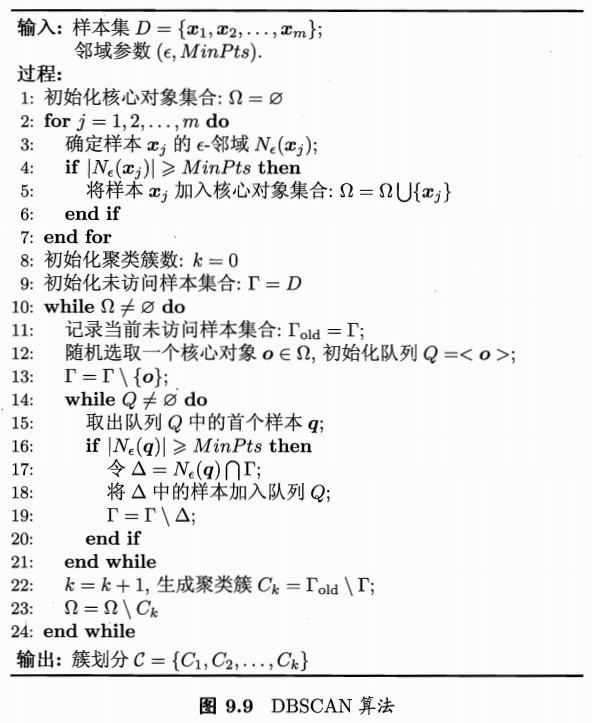
DBSCAN
- density-based spatial clustering of applications with noise
- 基于邻域参数刻画样本分布的紧密程度
- 概念:
- 算法流程如下:
层次聚类
- 层次聚类:hierarchical clustering
- 在不同层次对数据集进行划分,从而形成树形的聚类结构
- 聚合策略:自低向上
- 分拆策略:自顶向下
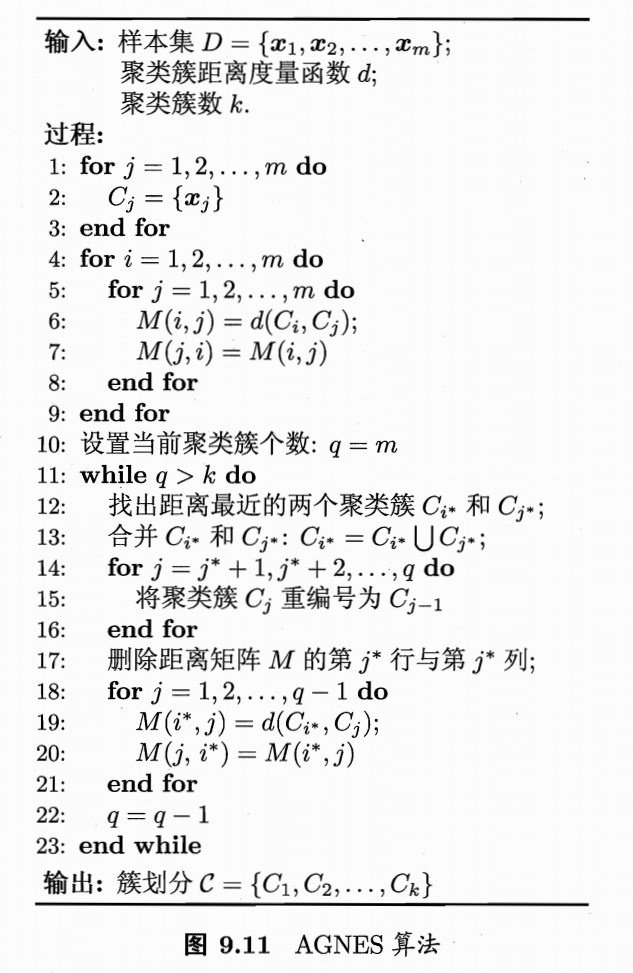
AGNES
- AGNES:AGglomerative NESting
-
自底向上的聚合策略
- 每个样本看成一个簇
- 找出距离最近的两个簇进行合并
-
不断重复,直到达到预设的聚类簇的个数
- 关键:如何计算簇之间的距离。上面介绍的是计算样本之间的距离。
- 簇间距离计算:

- 可选择不同的距离计算方式
- 最小距离:两个簇的最近样本决定,单链接(single-linkage)
- 最大距离:两个簇的最远样本决定,全链接(complete-linkage)。所以我们通常使用的是全链接,是最大的距离?
- 平均距离:两个簇的所有样本决定,均链接(average-linkage)
- 算法流程:
参考
- 机器学习周志华第9章
Read full-text »
Think Stats: probability
2018-07-15
概率:
- 被赋予概率的“事情”称为事件(event)。如果E表示一个事件,那么P(E)就表示该事件发生的概率。检测E发生情况的过程就叫做试验(trial)。
- 频率论(frequentism):用频率来定义概率。如果没有一系列相同的试验,那就不存在概率。
- 贝叶斯认识论(bayesianism):将概率定义为事件发生的可信度,适用范围更广,但是更主观。
- 概率法则:1)P(AB)=P(A)P(B),A/B需要相互独立;2)条件概率P(A\∣B)=P(A|B)P(A∣B),A/B不相互独立时;3)由前面归纳一个公式:P(AB)=P(A)P(B∣A),不论A/B独立与否都适用。
- 蒙提霍尔问题:假设你正在参加一个游戏节目,你被要求在三扇门中选择一扇:其中一扇后面有一辆车;其余两扇后面则是山羊。你选择了一道门,假设是一号门,然后知道门后面有什么的主持人,开启了另一扇后面有山羊的门,假设是三号门。他然后问你:“你想选择二号门吗?”转换你的选择对你来说是一种优势吗? 答案是:转换选择能够提升获胜概率。
- 二项分布:n是试验总次数,p是成功的概率,k是成功的次数。

- 连胜:不存在连胜或者连败。
- 聚类错觉(clustering illusion):指看上去好像有某种特点的聚类实际上是随机的。可通过蒙特卡洛模拟,看随机情况产生类似聚类的概率。
- 贝叶斯定理(Bayes’s theorem)描述的是两个事件的条件概率之间的关系。条件概率通常写成P(A|B),表示的是在事件B已发生的情况下事件A发生的概率。P(H\∣E)=P(H)P(E\∣H)/P(E):在看到E之后H的概率P(H|E),等于看到该证据前H的概率P(H),乘以假设H为真的情况下看到该证据的概率P(E|H)与在任何情况下看到该证据的概率P(E)的比值P(E|H)/P(E)。
术语:
- 贝叶斯认识论(Bayesianism) 一种对概率更泛化的解释,用概率表示可信的程度。
- 变异系数(coefficient of variation) 度量数据分散程度的统计量,按集中趋势归一化,用于比较不同均值的分布。
- 事件(event) 按一定概率发生的事情。
- 失败(failure) 事件没有发生的试验。
- 频率论(frequentism) 对概率的一种严格解读,认为概率只能用于一系列完全相同的试验。
- 独立(independent) 若两个事件之间相互没有影响,就称这两个事件是独立的。
- 证据的似然值(likelihood of the evidence) 贝叶斯定理中的一个概念,表示假设成立的情况下看到该证据的概率。
- 蒙特卡罗模拟(Monte Carlo simulation) 通过模拟随机过程计算概率的方法(详见http://wikipedia.org/wiki/Monte_Carlo_method)。
- 归一化常量(normalizing constant) 贝叶斯定理中的分母,用于将计算结果归一化为概率。
- 后验(posterior) 贝叶斯更新后计算出的概率。
- 先验(prior) 贝叶斯更新前计算出的概率。
- 成功(success) 事件发生了的试验。
- 试验(trial) 对一系列事件是否可能发生的尝试。
- 更新(update)** 用数据修改概率的过程。
Read full-text »
Latest articles
Links
- ZhangLab , RISE database , THU life , THU info
- Data analysis: pandas , numpy , scipy
- ML/DL: sklearn , sklearn(中文) , pytorch
- Visualization: seaborn , matplotlib , gallery
- Github: me
