【1-3】浅层神经网络
2019-01-20
目录
概述
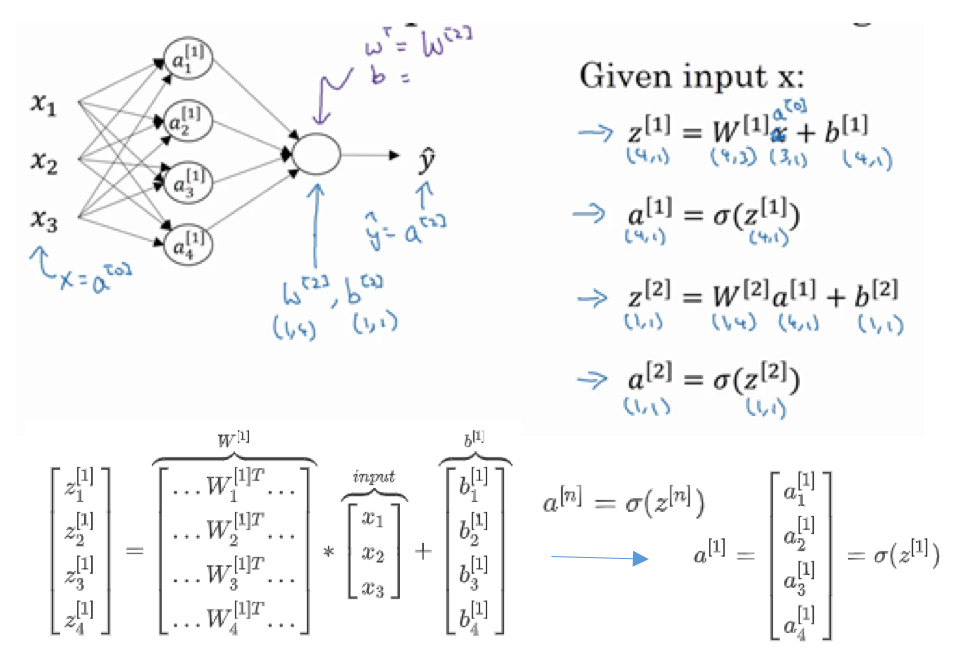
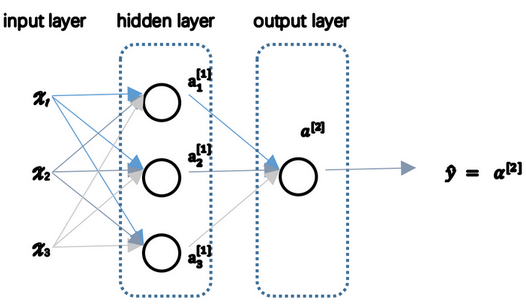
神经网络表示
- 输入层:神经网络的输入
- 隐藏层:在训练中,中间结点的准确值是不知道的,看不见它们在训练中具有的值,所以称为隐藏。
- 输出层:产生预测值
- 惯例:
- 网络层数:输入层不算在内
- 输入层:第零层
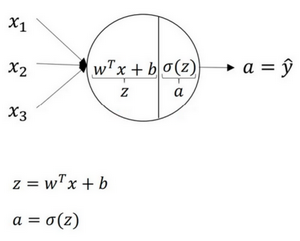
计算网络输出
向量化计算
激活函数
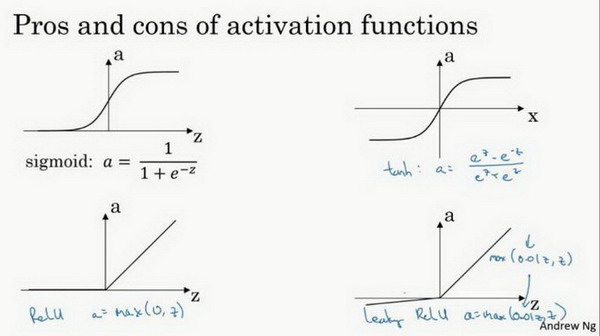
- 通常情况:tanh函数或者双正切函数总体上都优于sigmoid函数
- tanh函数:是sigmoid函数向下平移和伸缩后的结果
- 优化算法说明:基本不用sigmoid函数,tanh函数在所有场合都优于sigmoid函数
- 例外:二分类问题,输出层是0或者1,需要使用sigmoid函数
- 经验法则:
- 如果输出是0、1值(二分类问题),则输出层选择sigmoid函数,然后其他的所有单元选择ReLU函数
- ReLU & leaky ReLU:
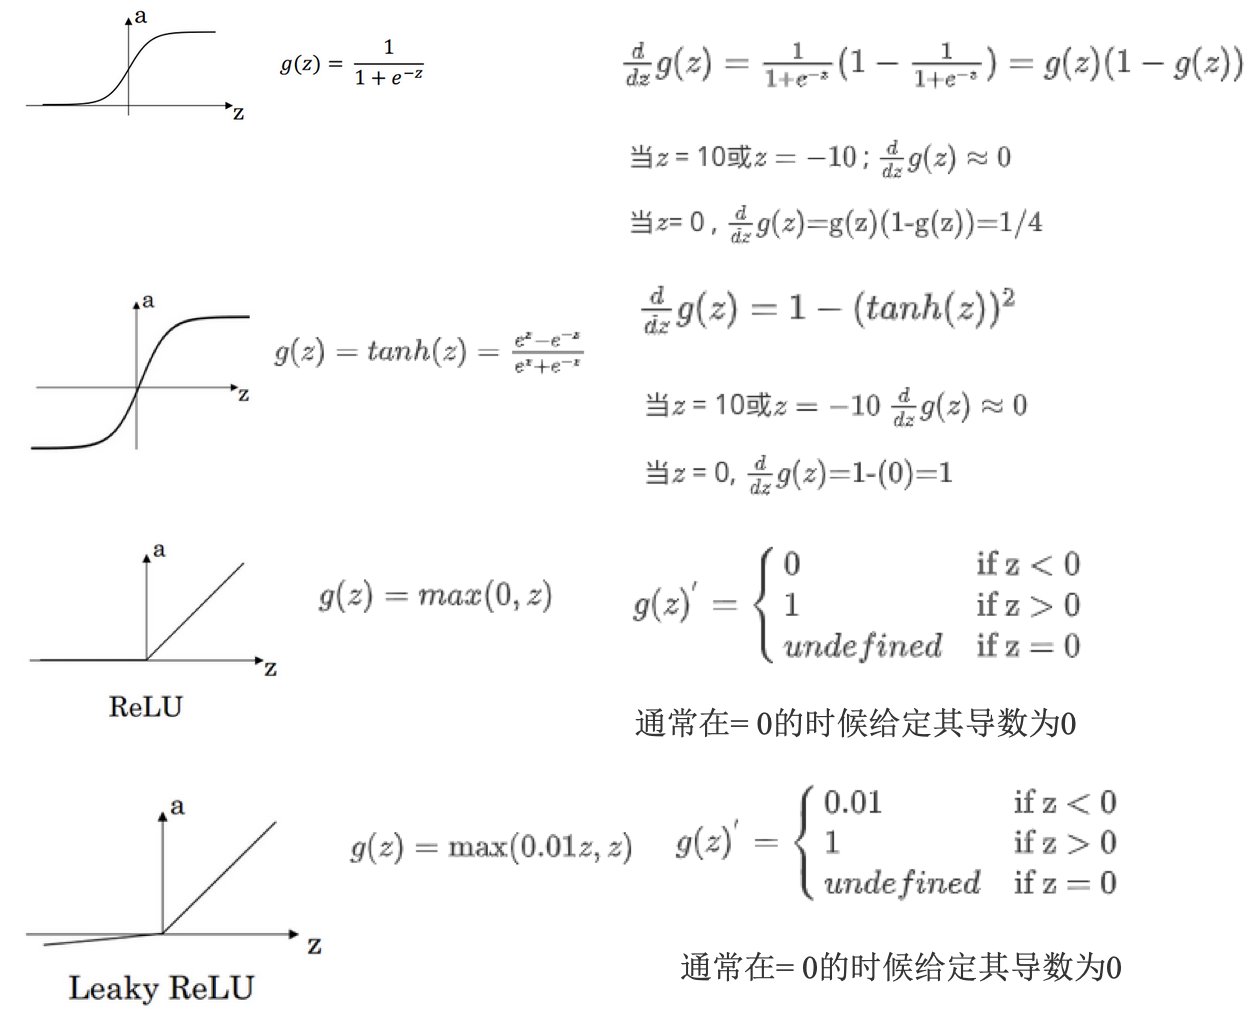
- 更快。在z的区间变动很大时,激活函数斜率都大于0,而sigmoid函数需要进行size运算,所以前者效率更高。
- 不会产生梯度弥散现象。sigmoid和tanh,在正负饱和区时梯度接近于0。
- 为什么要非线性激活函数:
- 如果使用线性激活函数,神经网络只是对输入进行线性组合,不能构建复杂的模拟情况
- 不能在隐藏层使用线性激活函数:用ReLU或者tanh等非线性激活函数
- 唯一可用线性激活函数的:输出层
- 各激活函数的导数:
反向传播
- 逻辑回归的:

- 具体可参见另外一个例子:09: Neural Networks - Learning,这里有个例子说明了反向传播的计算的全过程。
随机初始化
- 逻辑回归:初始化权重可以为0
- 神经网络:初始化权重不能为0.
- 如果设置为0,那么梯度下降将不起作用。
- 所有隐含单元是对称的,无论运行梯度下降多久,都是计算同样的函数
- 一般基于高斯分布随机生成一些数,再乘以一个很小的系数(比如0.01),作为初始值。
参考
Read full-text »
【1-2】神经网络的编程基础
2019-01-17
目录
二分类
- 神经网络:对于m个样本,通常不用for循环去遍历整个训练集
- 神经网络的训练过程:
- 前向传播:forward propagation
- 反向传播:backward propagation
-
例子:逻辑回归
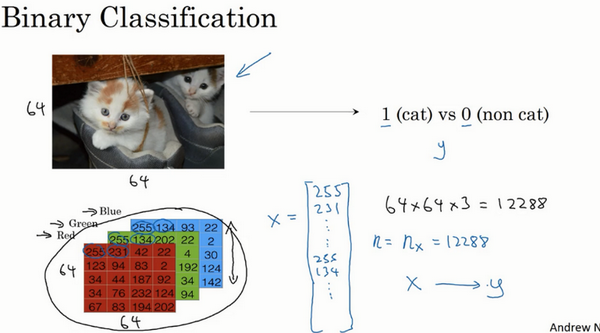
- 二分类:
- 目标:识别图片是猫或者不是
- 提取特征向量:3通道的特征向量,每一个是64x64的,最后是64x64x3
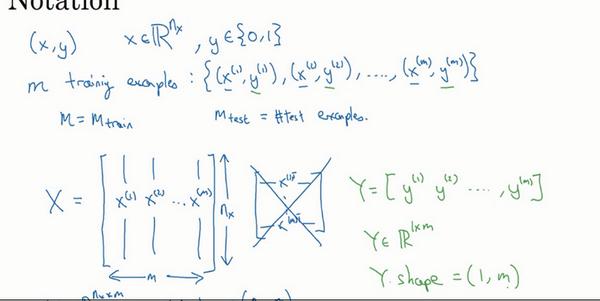
- 符号表示:
- 训练样本的矩阵表示X:每一个样本是一列,矩阵维度:特征数x样本数
- 输出标签y:矩阵维度:1x样本数
逻辑回归
- 二分类:
- 输入特征向量,判断是不是猫
- 算法:输出预测值\(\hat y\)对实际值\(y\)的估计
- 正式的定义:让预测值\(\hat y\)表示实际值\(y\)等于1的可能性
- 例子:
- 图片识别是否是猫
- 尝试:\(\hat y=w^Tx+b\),线性函数,对二分类不是好的算法,因为是想“让预测值\(\hat y\)表示实际值\(y\)等于1的可能性”,所以\(\hat y\)应该在【0,1】之间。
- sigmoid函数:
- 当z很大时,整体值接近于1(1/(1+0))
- 当z很小时,整体值接近于0(1/(1+很大的数))

- 让机器学习参数\(w\)及\(b\),使得\(\hat y\)称为对\(y=1\)这一情况的概率的一个很好的估计。
逻辑回归的代价函数
- 损失函数L:
- 衡量预测输出值与实际值有多接近
- 一般使用平方差或者平方差的一半
- 逻辑回归损失函数loss function:
- 逻辑回归如果也使用平方差:
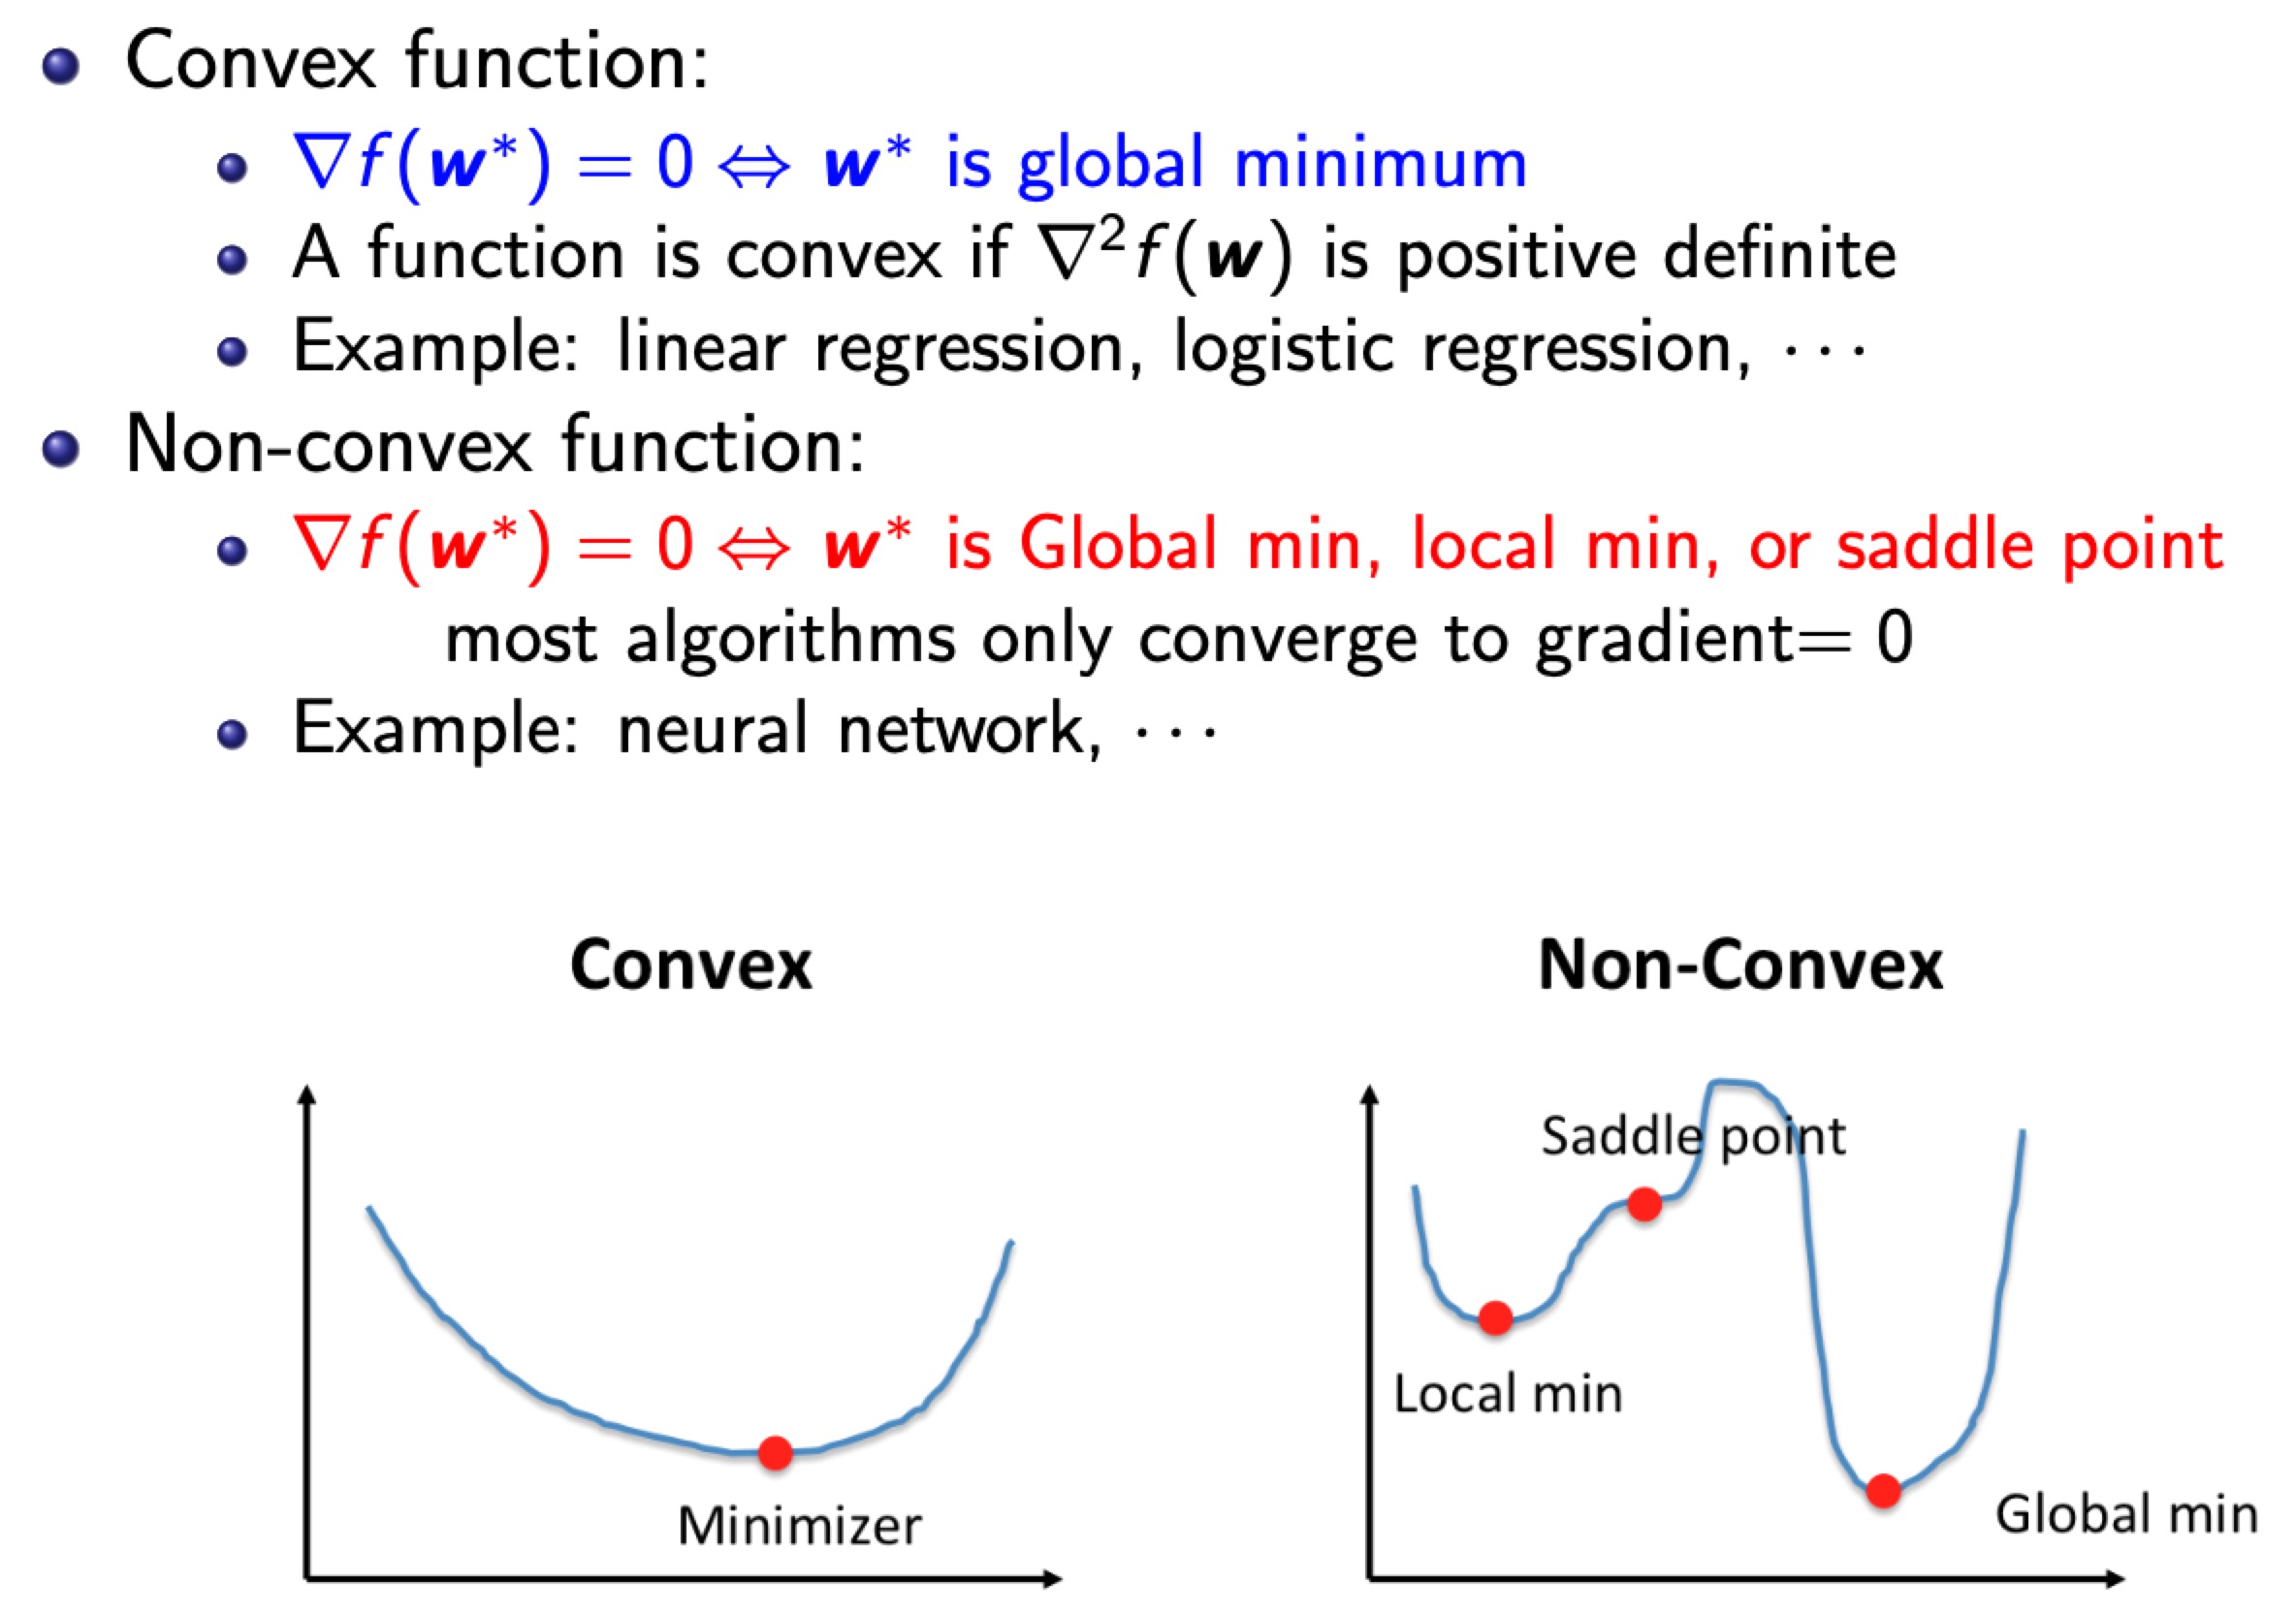
- 优化目标不是凸优化的
- 只能找到多个局部最优解
- 梯度下降法很可能找不到全局最优
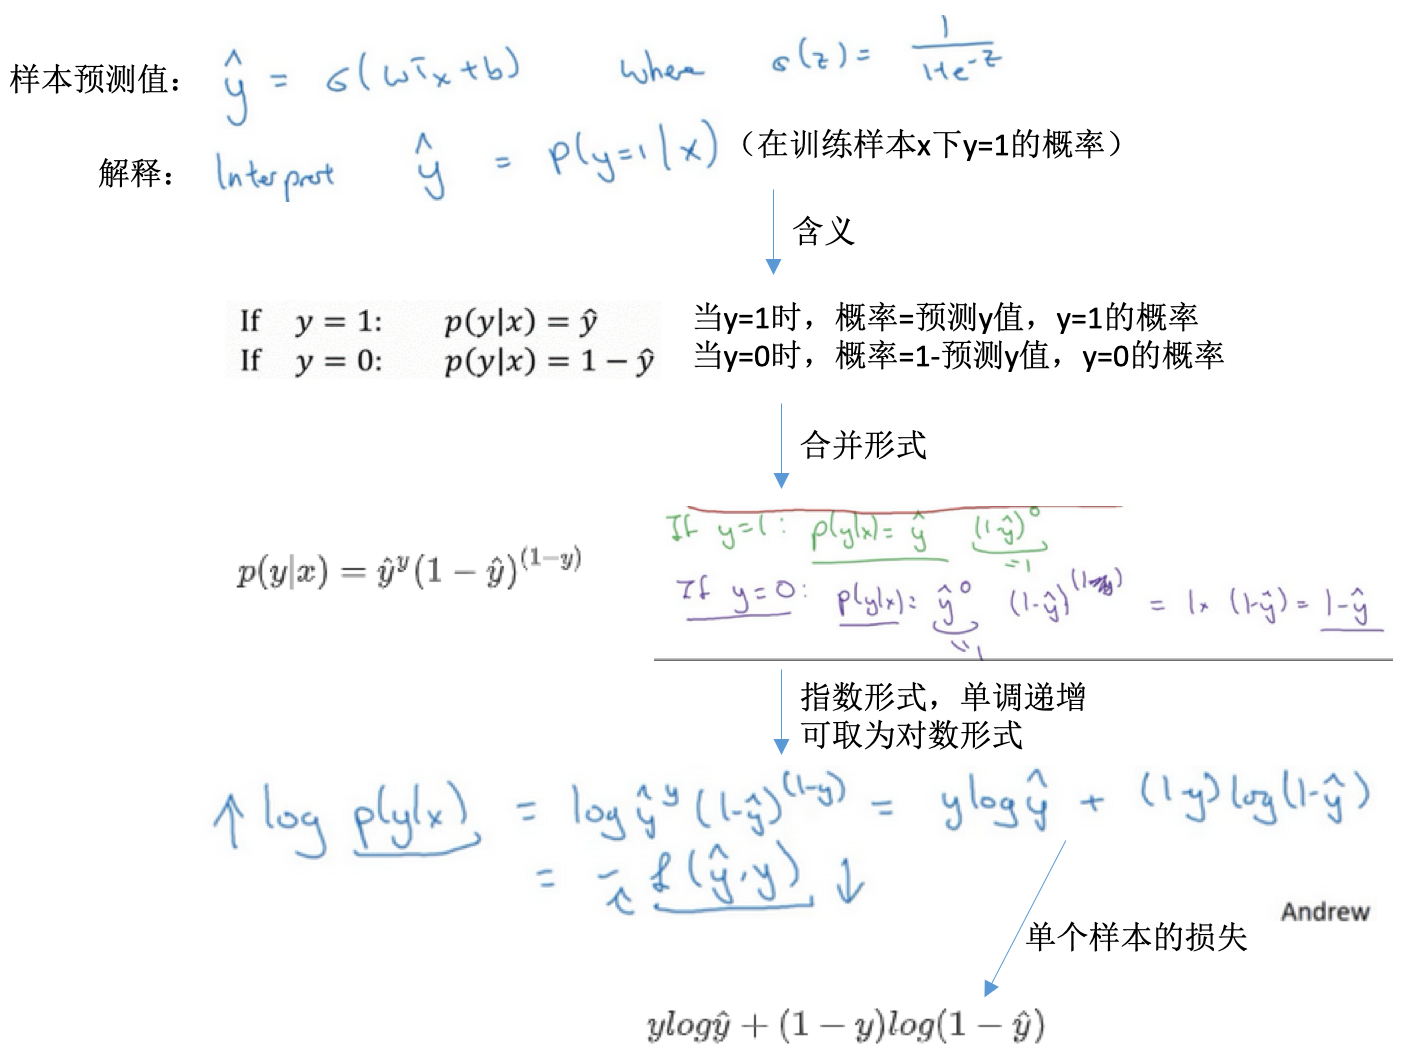
- 逻辑回归使用对数损失:\(L(\hat y, y)=-ylog(\hat y)-(1-y)log(1-\hat y)\)
- 单个样本的损失
- 为啥是这个损失函数?【直观理解】
- 当y=1时,损失函数\(L=-log(\hat y)\),L小,则\(\hat y\)尽可能大,其取值本身在[0,1]之间,所以会接近于1(也接近于此时的y)
- 当y=0时,损失函数\(L=-log(1-\hat y)\),L小,则\(1-\hat y\)尽可能大,\(\hat y\)尽可能小,其取值本身在[0,1]之间,所以会接近于0(也接近于此时的y)
- 逻辑回归如果也使用平方差:
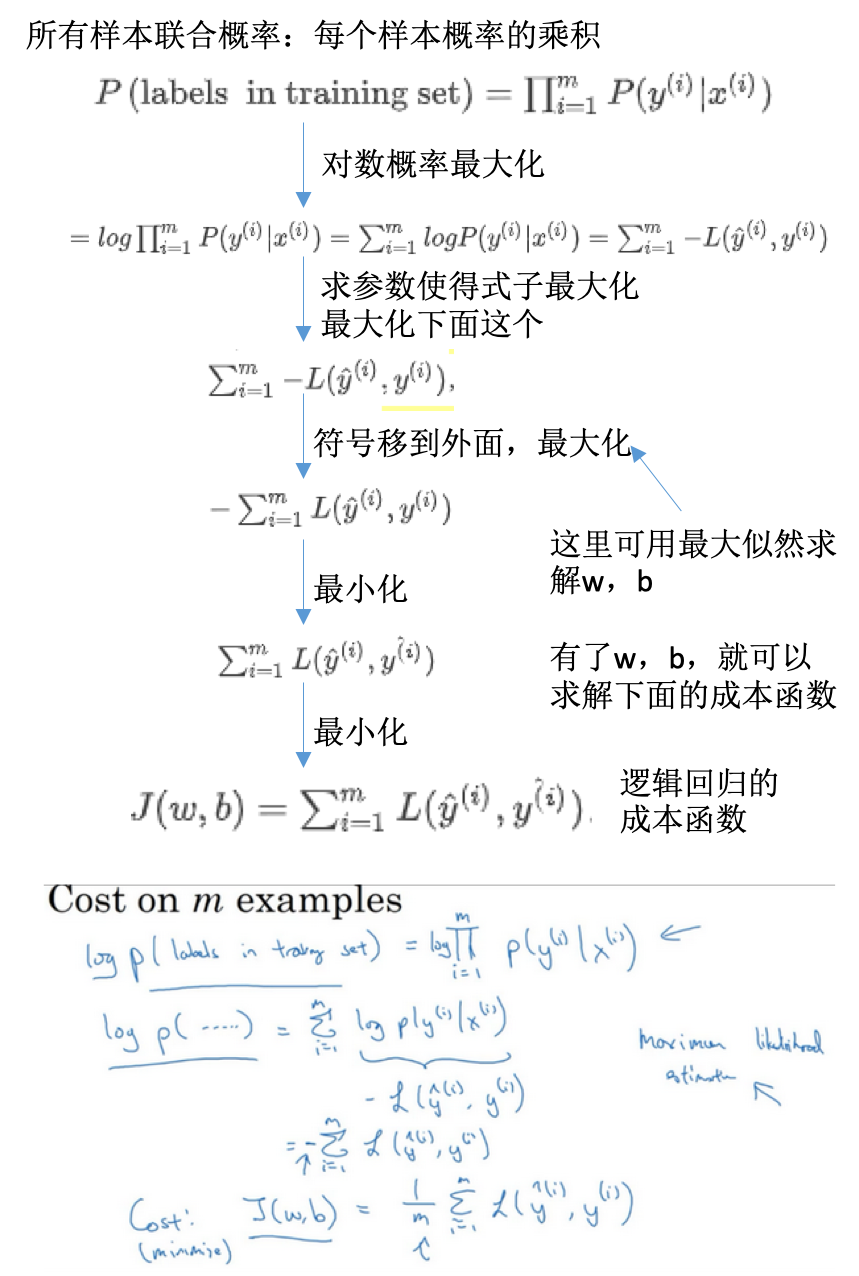
- 代价函数cost function
- 参数的总代价
- 对m个样本的损失函数求和然后除以m
- 为什么是这个损失函数?
- 多样本的代价函数
梯度下降法
- 逻辑回归的代价函数是凸函数(convex function),像一个大碗一样,具有一个全局最优。如果是非凸的,则存在多个局部最小值。
- 梯度下降:
- 初始化w和b参数。逻辑回归,无论在哪里初始化,应该达到统一点或大致相同的点。
- 朝最陡的下坡方向走一步,不断迭代
- 直到走到全局最优解或者接近全局最优解的地方
- 迭代:
- 公式:\(w := w - \alpha \frac{dJ(w)}{dw} 或者 w := w - \alpha \frac{\partial J(w,b)}{\partial w}\)
- 学习速率:\(\alpha\),learning rate,控制步长,向下走一步的长度
- 函数J(w)对w求导:\(\frac{dJ(w)}{dw}\),就是斜率(slope)
- 偏导:\(\partial\)表示,读作round,\(\frac{\partial J(w,b)}{\partial w}\)就是J(w,b)对w求偏导
-
在逻辑回归还有参数b,同样的进行迭代更新
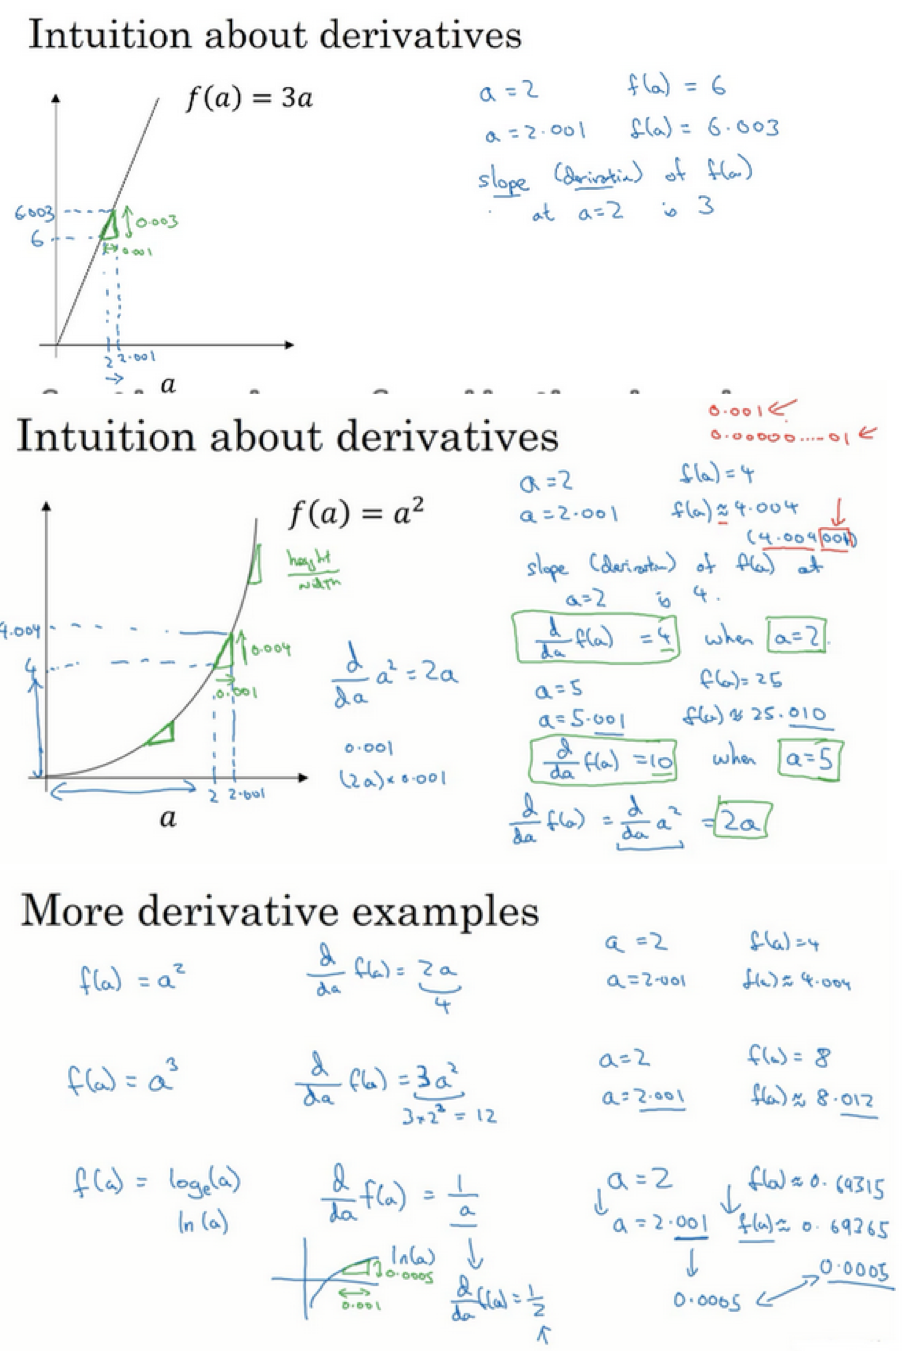
- 一个参数:求导数(derivative),用小写字母d表示
- 两个参数:求偏导数(partial derivative),用\(\partial\)表示
导数及例子
计算图
- 神经网络:按照前向或反向传播过程组织的
- 例子:计算函数J的值
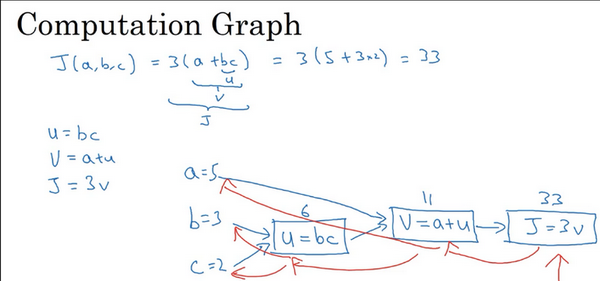
- 计算J的值:从左向右的过程,蓝色箭头
- 计算导数:从右向左的过程,红色箭头
使用计算图求导数
- 在一个计算图中,计算导数
- 导数:最后输出的变量,对于某个你关心的变量的导数
- 直观做法:某个变量改变(增加)一点点(这里都是0.001),那么最后输出的变量改变(增加)了多少倍?这个倍数就是导数
- 需要使用到链式法则,改变一个变量,最先受到影响的是其最相近的变量,然后向后传播,直到影响最终的输出变量。
- 所以在计算导数的时候,是反向的,看离输出变量最近的变量的导数,再一次往回推。
- 这里是举得例子,核心:【1】小增量,【2】反向一次计算
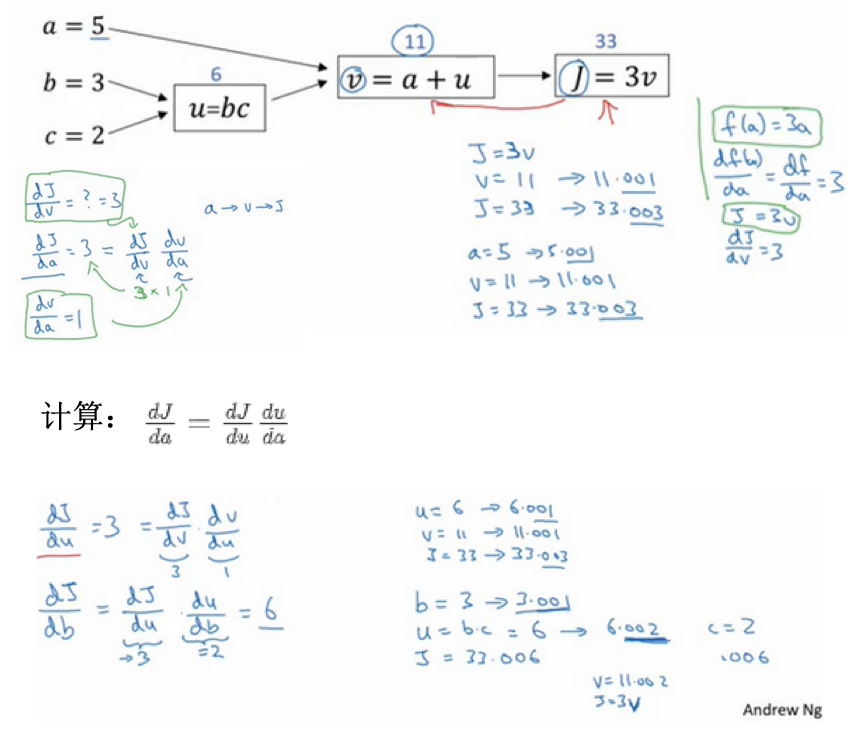
- 表示:\(dv,da,db\)等形式,分别表示最后的输出对于某个变量的导数,在编程时注意命名
逻辑回归中的梯度计算
- 单个样本
- 数据特征值:x1,x2
- 参数变量:w1,w2,b
- 构建计算图:特征值+参数变量值 =》计算Z值 =》计算预测值(逻辑回归变换)=》计算损失函数
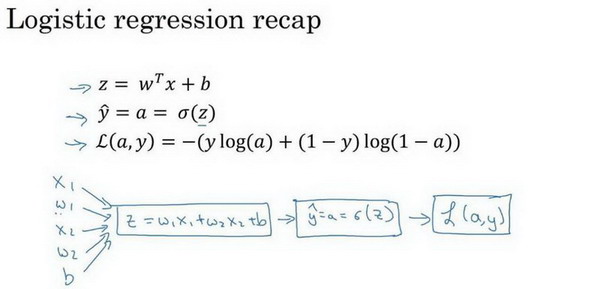
- 单个样本各参数的导数
- 损失函数值对于每个参数的导数:单个样本就是计算单个样本的损失函数
- 链式法则,反向计算
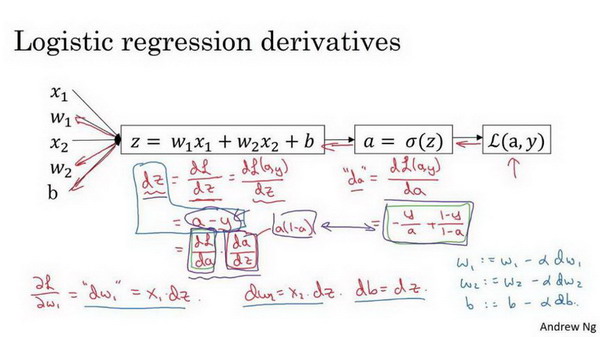
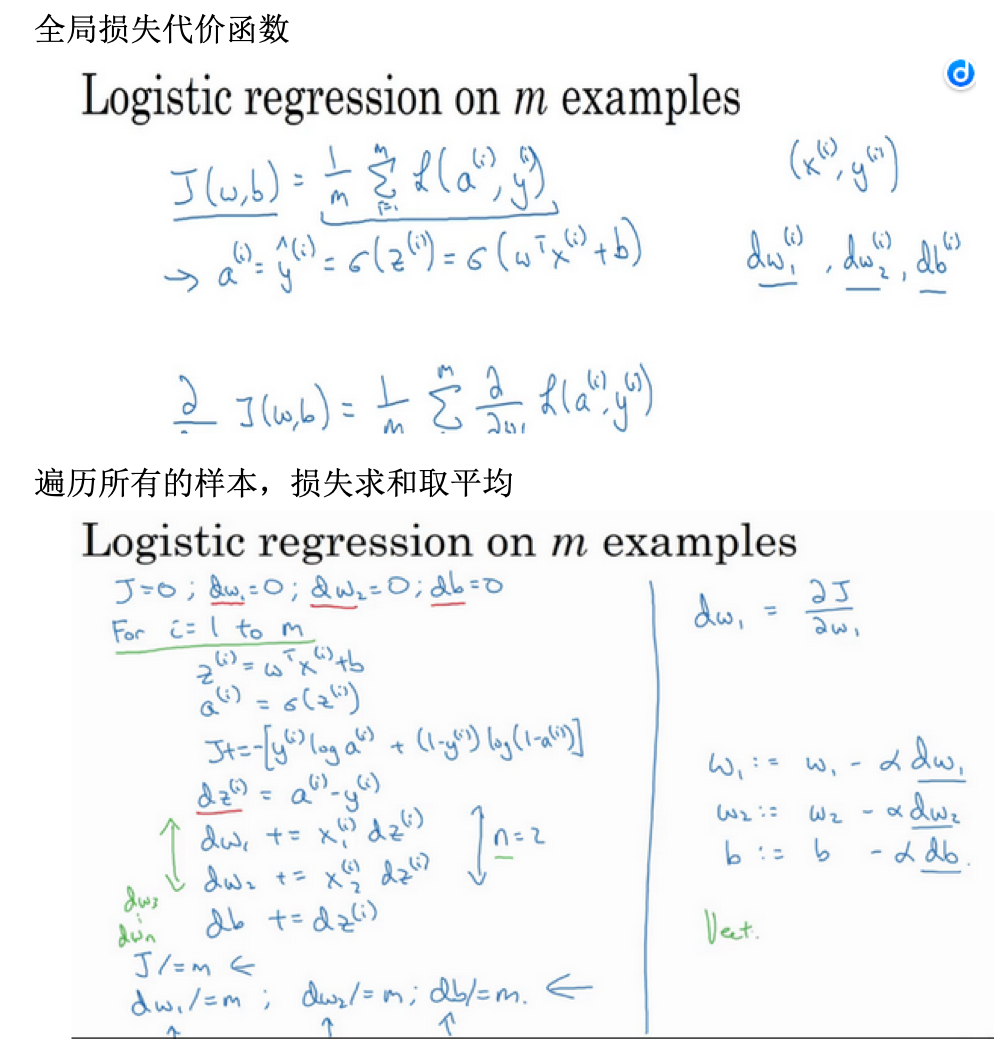
- 多样本(m)的梯度下降
计算代码实现:
J=0;dw1=0;dw2=0;db=0;
for i = 1 to m
    z(i) = wx(i)+b;
    a(i) = sigmoid(z(i));
    J += -[y(i)log(a(i))+(1-y(i))log(1-a(i));
    dz(i) = a(i)-y(i);
    dw1 += x1(i)dz(i);
    dw2 += x2(i)dz(i);
    db += dz(i);
J/= m;
dw1/= m;
dw2/= m;
db/= m;
w=w-alpha*dw
b=b-alpha*db
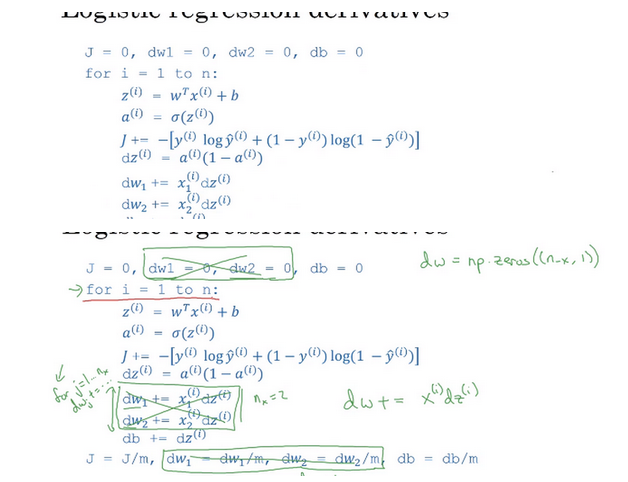
缺点:
- for循环
- 循环1:所有样本
- 循环2:所有特征,这里只假设有2个特征,所以只有w1和w2
- 需要向量化计算
向量化
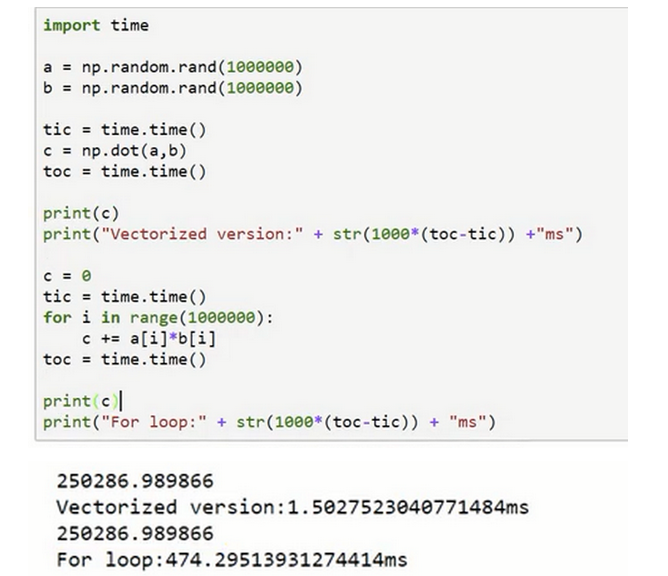
- 取代代码中的for循环,比如计算两个数组的对应元素乘积的和(W*X),可以使用for循环,但是向量化更简单(每个数组可看成一个向量)
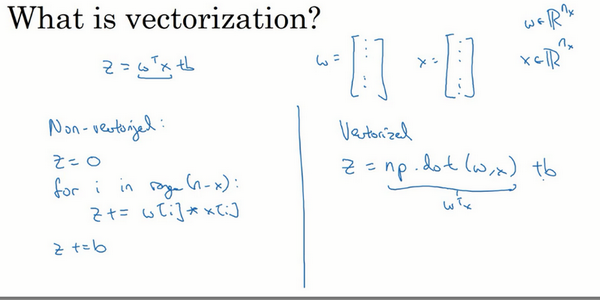
-
尽量使用numpy内置的向量操作 * 比如向量乘积(dot) * 还有很多其他的:求指数,绝对值,倒数等
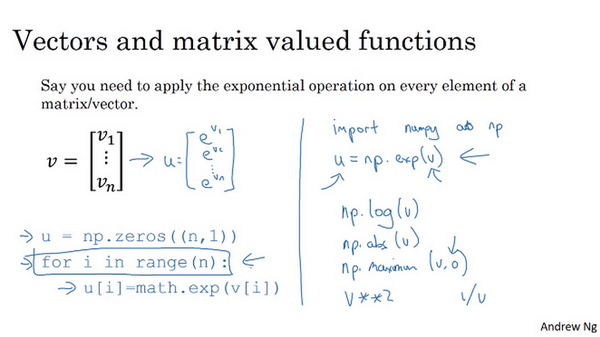
- 逻辑回归导数求解引入向量化
逻辑回归向量化
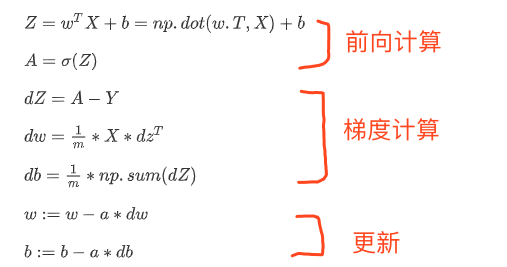
- 向量化前向传播:
- 传统:遍历每个样本,分别根据公式\(z^(i)=wTx^(i)+b\)计算z,再计算激活函数值a
- 向量化:
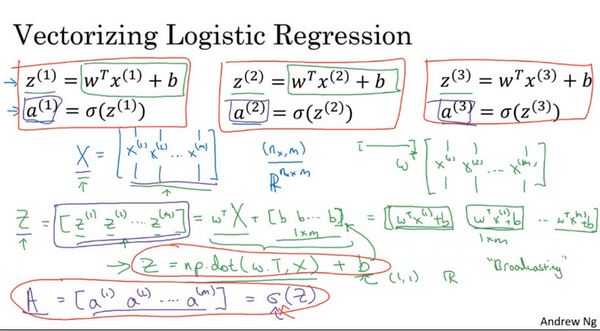
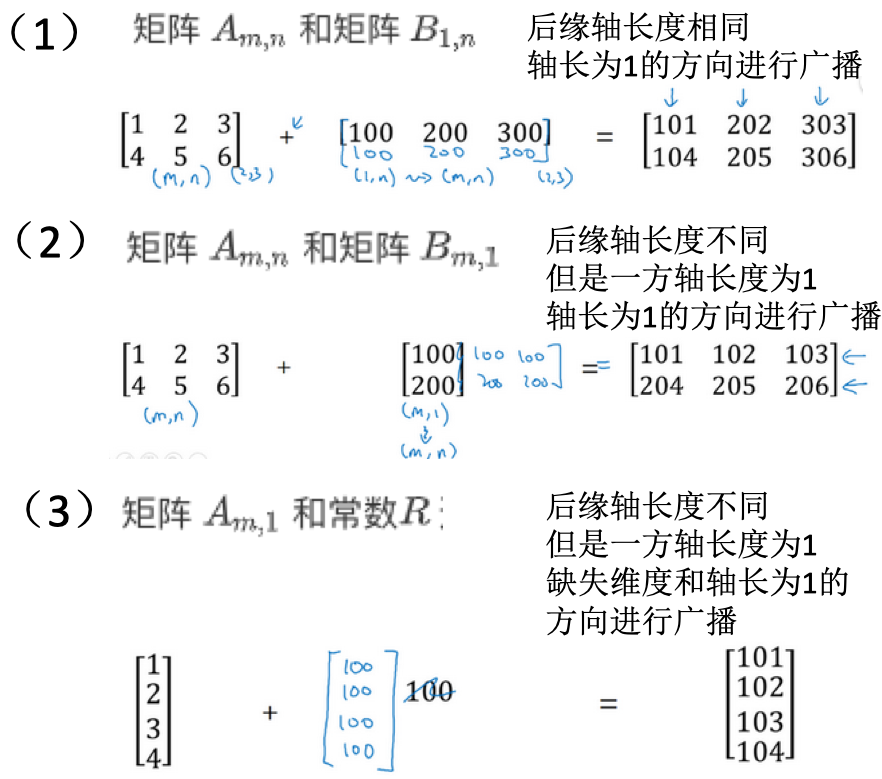
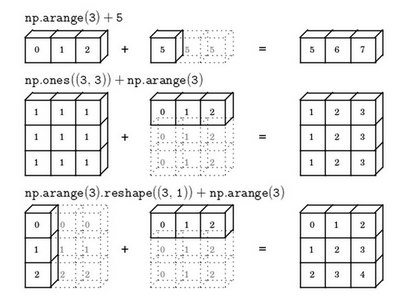
- 在numpy中:\(Z=np.dot(w.T, X)+b\),这里直接+b,实际使用了python重点额广播特性(broadcasting,自动填充)。计算了Z之后,直接调用sigmoid函数,可直接计算激活函数值。
- 向量化后向传播:
- 同时计算m个样本的梯度
- 之前:\(dz^{(1)}=a^{(1)}-y^{(1)}, dz^{(2)}=a^{(2)}-y^{(2)}, ...\)
- 构建:\(dZ=A-Y=[a^{(1)}-y^{(1)} a^{(2)}-y^{(2)} ...]\),这里的每个元素其实就是上面的导数
- 合在一起:
numpy广播机制
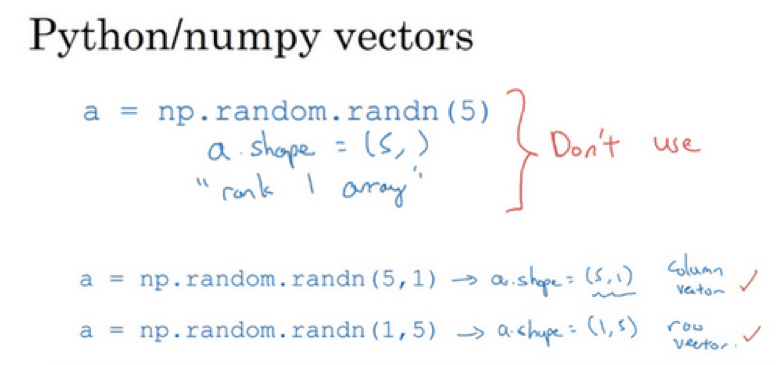
numpy向量:清除一维数组
- 广播功能:灵活,但是也可能出现bug
- 避免使用一位数组,使用向量
- 在随机生成函数中,只指定数目时,得到的是一维数组a,其shape函数返回值是
(n,) - 此时不是向量,所以其有些操作看起来是奇怪的,比如a和a的转置的乘积,得到的只是一个数值,而不是向量
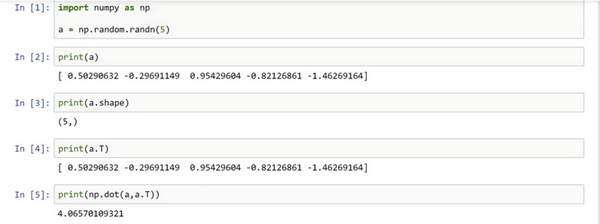
- 在随机生成函数中,只指定数目时,得到的是一维数组a,其shape函数返回值是
- 显示的指定向量维度:
- 使用assert判断维度:
assert(a.shape == (5,1)),可以避免其维度是(5,)的情况 - 使用reshape更改为指定的维度
参考
Read full-text »
强化学习
2019-01-15
目录
任务与奖赏
如何种西瓜?
- 选种
- 定期浇水、施肥等【执行某个操作】
- 一段时间才收获西瓜
-
收获后才知道种出的瓜好不好【好瓜是辛勤种植的奖赏】
- 执行操作后,不能立即获得最终奖赏
-
难以判断当前操作对最终操作的影响
- 强化学习:reinforcement learning
- 需要多次种瓜,在种瓜过程中不断摸索,然后才能总结出好的种瓜策略
-
这种过程的抽象
- 通常用马尔科夫决策过程描述:MDP(markov decision process)
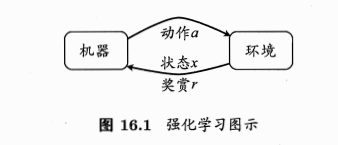
- 机器处于环境E中,状态空间为X,每个状态\(x\in X\)是机器感知到的环境的描述(如瓜苗的长势好不好的描述)
- 机器可采取的动作空间A:比如浇水、施肥
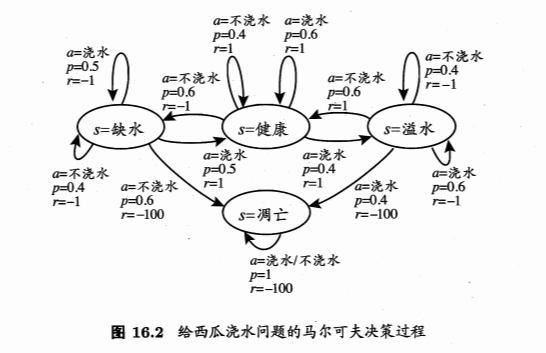
- 状态转移:某个动作a作用在当前状态x上,潜在的转移函数P使得环境从当前状态按照某种概率转移到另一个状态。如x=缺水,a=浇水,则瓜苗的长势发生变化,一定概率恢复健康,也一定概率无法恢复。
-
奖赏:在转移到另一个状态时,根据潜在的奖赏函数R反馈给机器一个奖赏,如健康+1,凋零-10
- 模型对应四元组:\(E=<X,A,P,R>\)
- \(P: X\times A\times X \longmapsto R\):状态转移概率
- \(R: X\times A\times X \longmapsto R\):奖赏
- 西瓜浇水的马尔科夫决策过程:
- 机器 vs 环境:
- 环境中的状态转移、奖赏返回不受机器控制
- 机器可通过选择动作影响环境
- 策略:
- 机器的核心:学习策略
- 通过在环境中不断尝试而学得一个策略(policy) \(\pi\)
-
根据这个策略,在状态x下就能得知要执行的动作\(a=\pi(x)\)
- 策略表示方法:
- 【1】函数表示:\(\pi: X \longmapsto A\),确定性策略表示
-
【2】概率表示:\(\pi: X \times A \longmapsto R\),随机性策略表示,当前状态x下选择动作a的概率
- 策略好坏?
- 取决于长期执行这一策略后得到的累计奖赏
- 强化学习目的:找到能使长期累计奖赏最大化的策略
- 计算方式:
- T步累计奖赏
- \(\gamma\)折扣累计奖赏
- 强化学习 vs 监督学习:
- 状态 =》 样本
- 动作 =》 标记
- 策略 =》 分类器或者回归器
-
模型形式无差异
- 强化学习没有有标记样本,没有直接可以告诉机器在什么状态下采取什么动作。
- 只有等最终结果揭晓,才能通过”反思“之前的动作是否正确进行学习
- 某种意义:延迟标记信息的监督学习问题
K-摇臂赌博机
探索-利用窘境
最大化单步奖赏:
- 最终奖赏的简单情况
- 仅考虑一步操作
-
通过尝试发现各个动作产生的结果
- 需考虑2个方面:
- 每个动作的奖赏
- 执行奖赏最大的动作
- 注意:如果每个动作的奖赏是确定值,直接尝试,选最大的即可。通常一个动作的奖赏值来于一个概率分布,仅一次尝试不能确切获得平均奖赏值。
单步强化学习:
- 理论模型:K-摇臂赌博机
- 有K个摇臂,在投入一个硬币后可选择按下一个摇臂,每个摇臂以一定概率吐出硬币,但是这个概率赌徒是不知道的
-
赌徒目标:通过一定的策略最大化自己的奖赏
- 仅探索法:
- exploration-only
- 若仅为了获知每个摇臂的期望奖赏
- 所有的尝试机会平均分配给每个摇臂,各自的平均吐币概率作为奖赏概率的近似估计
- 很好的估计每个摇臂的奖赏
- 失去很多选择最优摇臂的机会
- 仅利用法:
- exploitation-only
- 若仅为了执行奖赏最大的动作
- 按下目前最优的摇臂(即目前为止平均奖赏最大的),若多个最优,随机选取一个
- 不能很好的估计每个摇臂的奖赏
- 两者都难以使最终的累计奖赏最大化
- 探索-利用窘境:
- 尝试次数有限
- 一方加强则另一方削弱
- 需在探索和利用之间达成较好的折中
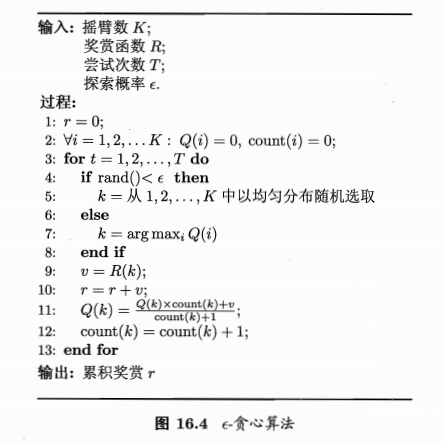
\(\epsilon\)-贪心
- 基于概率对探索和利用进行折中
- 每次尝试,以\(\epsilon\)概率进行探索,以均匀概率随机选取一个摇臂
- 以\(1-\epsilon\)概率进行利用,选择当前平均奖赏最高的摇臂
- 摇臂k的平均奖赏:\(Q(k)=\frac{1}{n}\sum_1^nV_i\),k此尝试的奖赏的均值
- 问题:对于每个臂的计算,都需要n个记录值,不够高效
- 做法:对均值进行增量式计算,每尝试一次就立即更新\(Q(k)\)
- 若概率分布较宽(不确定性大),需更多的探索,需较大的\(\epsilon\)
- 若概率分布较集中(不确定性小),需少的探索,需较小的\(\epsilon\)
- 通常:取较小的常熟,如0.1,0.01
- 如果尝试次数很大,可逐渐减小\(\epsilon\)值
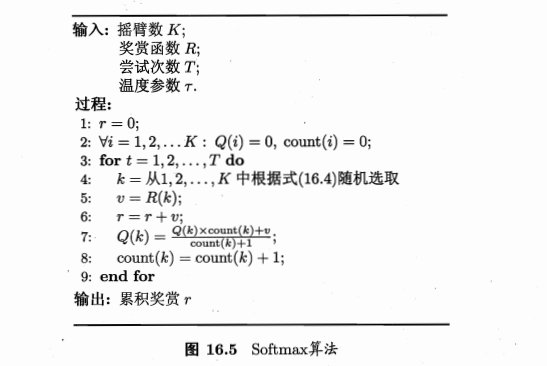
Softmax
- 基于当前已知的摇臂平均奖赏对探索和利用进行折中
- 若各摇臂平均奖赏相当,则选取概率也相当
- 若某些奖赏高于其他,则被选取概率也更高
- 摇臂概率分配基于玻尔兹曼分布:

- \(Q(i)\):当前摇臂的平均奖赏
- \(\tau>0\):温度,越小则平均奖赏高的摇臂被选取的概率越高
- \(\tau\)趋于0:趋于仅利用
- \(\tau\)趋于无穷大:趋于仅探索
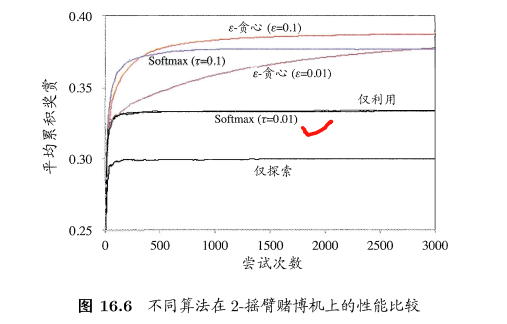
- Softmax vs \(\epsilon\)-贪心
有模型学习
- 上面的是单步强化学习
- 实际:多步强化学习
- 模型已知:假设任务对应的马尔科夫决策过程四元组已知(即机器对环境进行了建模,能在机器内部模拟出与环境相同或近似的状况)
- 状态x执行动作a到状态x‘的转移概率、对应的奖赏已知
策略评估
- 模型已知,能评估任意策略的期望累计奖赏
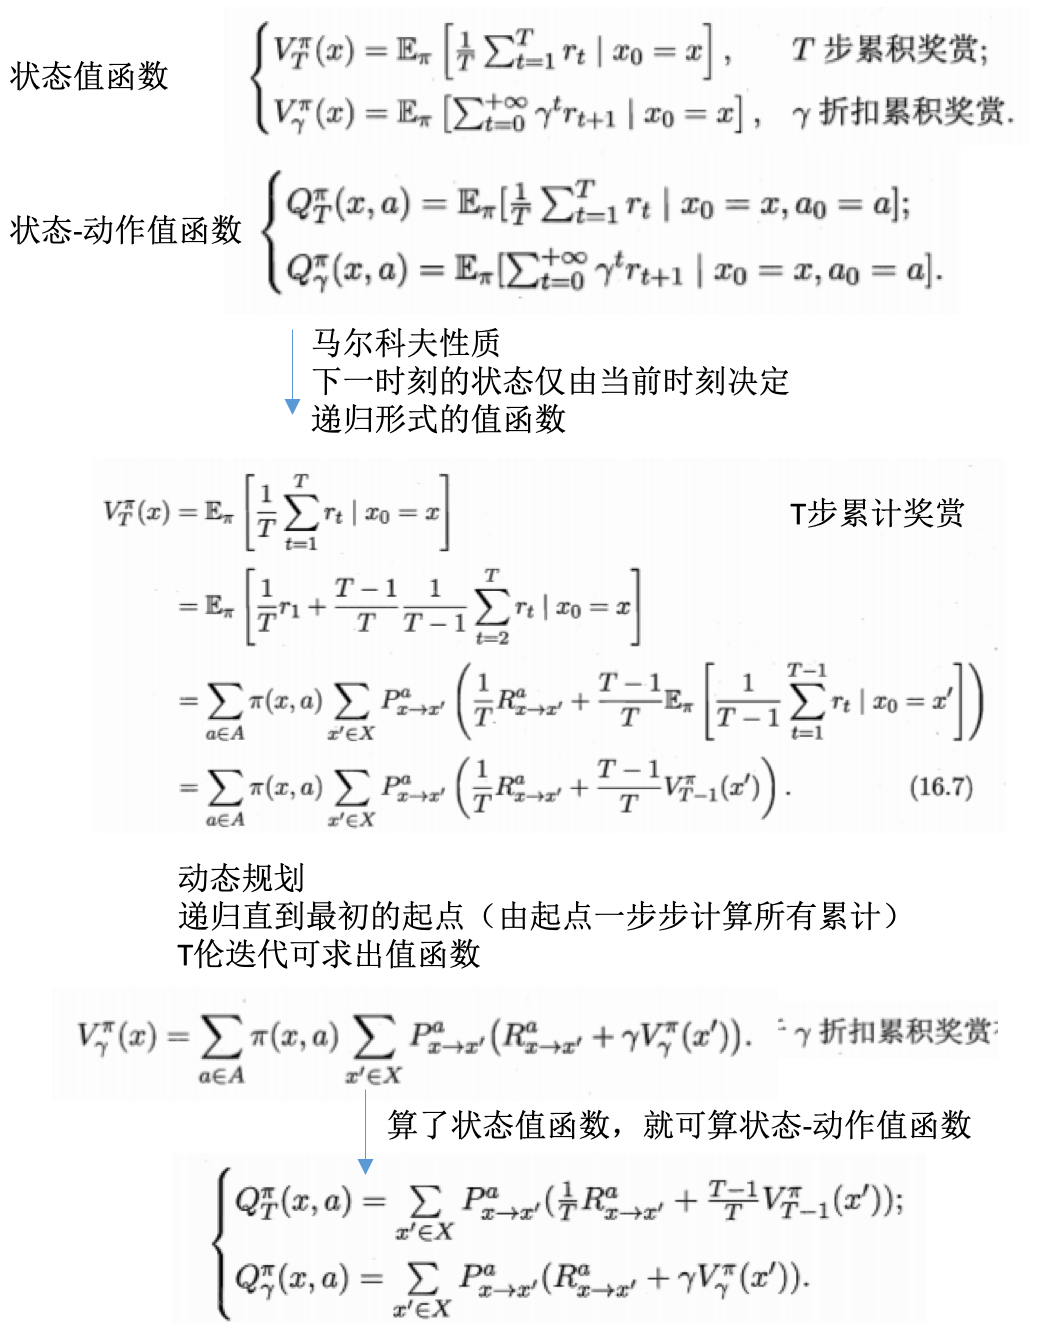
- 状态值函数:state value function,\(V^\pi(x)\),从状态x出发,使用策略\(pi\)带来的累计奖赏【指定状态】
- 状态-动作值函数:state-action value function,\(Q^\pi(x,a)\):从状态x出发,执行动作a后,再使用策略\(pi\)带来的累计奖赏【指定状态-动作】
- 马尔科夫性质计算值函数:
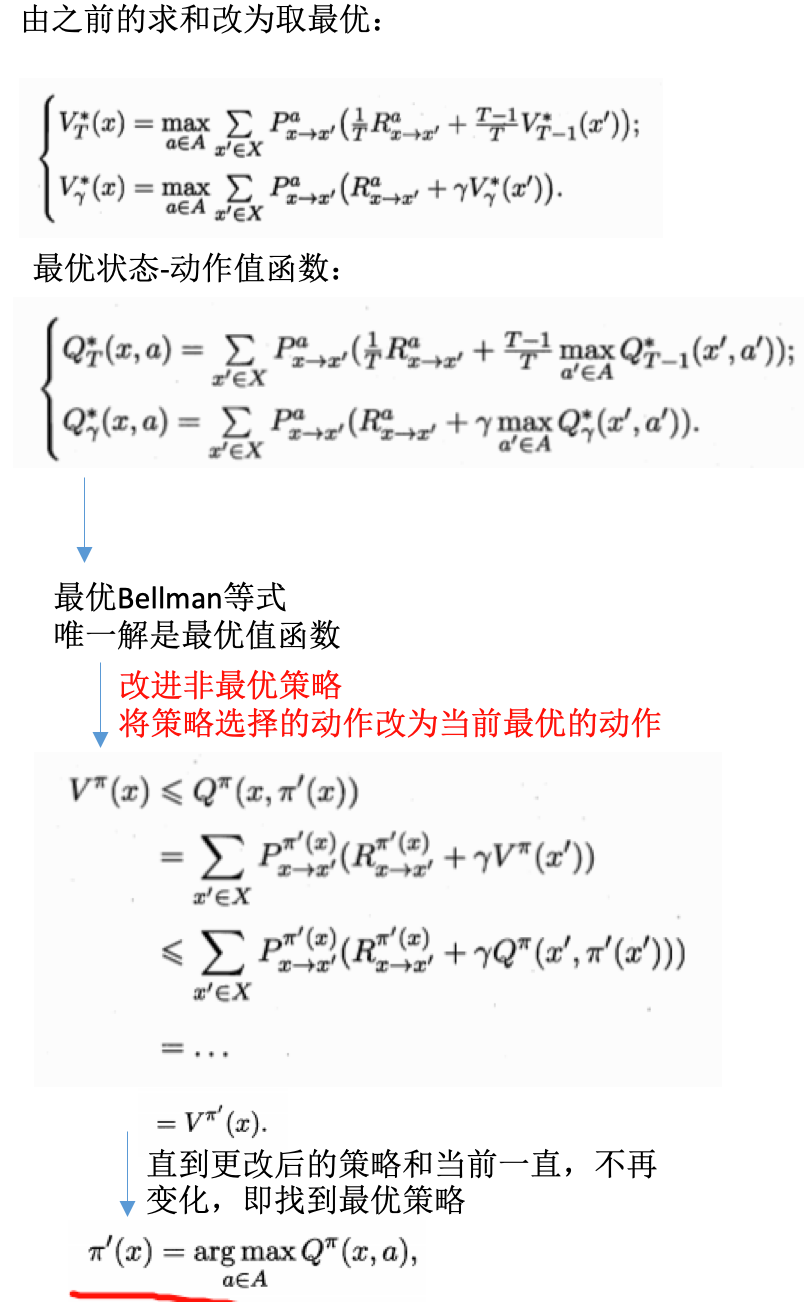
策略改进
- 策略进行累计奖赏评估后,发现不是最优策略,希望改进
- 理想的策略应该是能够最大化累计奖赏的:\(\pi^* = arg max \sum_{x \in X}V^{\pi}(x)\)
- 一个强化学习可能有多个最优策略,最优值函数
策略迭代与值迭代
- 前面:如何评估一个策略的值函数+评估策略后改进
- 策略迭代:policy iteration,结合以找到最优解
- 从一个初始策略出发
- 先进行策略评估,然后改进策略
- 评估改进的策略,再进一步改进策略
- 。。。
- 不断迭代评估和改进
- 直到策略收敛、不再改变
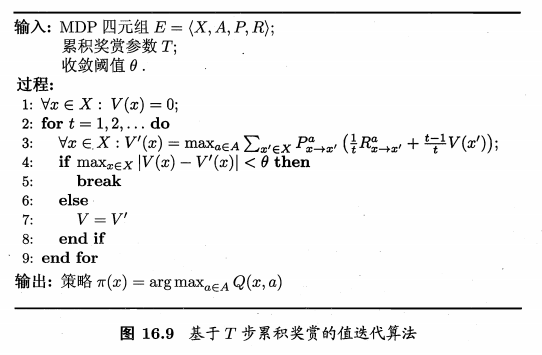
- 基于T步累计奖赏的策略迭代:
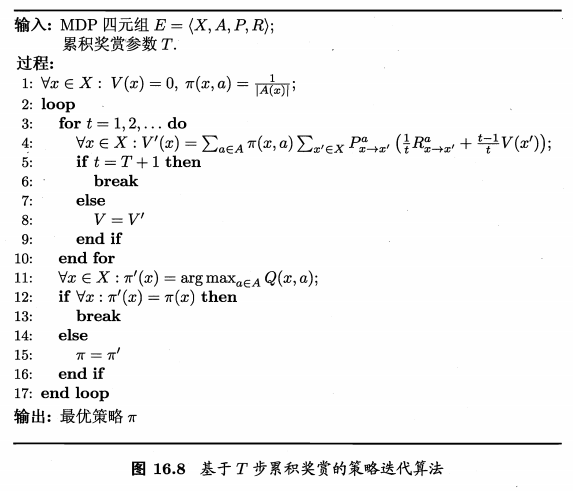
- 基于T步累计奖赏的值迭代:
- 模型已知:
- 强化学习 =》 基于动态规划的寻优问题
- 与监督学习不太,不涉及泛化能力,而是为每一个状态找到最好的动作
免模型学习
- 现实:环境的转移概率、奖赏函数难以得知
- 免模型学习:
- model-free learning
- 学习算法不依赖于环境建模
- 比有模型学习困难得到
蒙特卡罗强化学习
- 策略迭代问题:如何品谷策略?模型未知不能做全概率展开
- 通过在环境中执行动作,以观察专一的状态和得到的奖赏
- 策略评估替代方案:多次采样,求平均
- 蒙特卡罗强化学习
- 策略迭代算法:估计状态值函数V
- 由V退出状态-动作值函数Q
- 模型已知时,容易
- 未知时困难
- 估计对象从V转变为Q:估计状态-动作值函数
- 评估过程:
- 从起始状态出发,使用某种策略进行采样
- 执行该策略T步获得轨迹:\(<x_0,a_0,r_q,...,x_{T-1},a_{T-1},r_{T-1}>\)
- 对轨迹中出现的每一对状态-动作,记录奖赏之和,作为其一次采样
- 多次采样获得多个轨迹
-
每个状态-动作的累计奖赏采样值求和取平均,得到状态-动作值函数的估计
- 策略是确定性的,对策略进行采样,可能得到的是多个相同的轨迹
- 而我们需要不同的采样轨迹
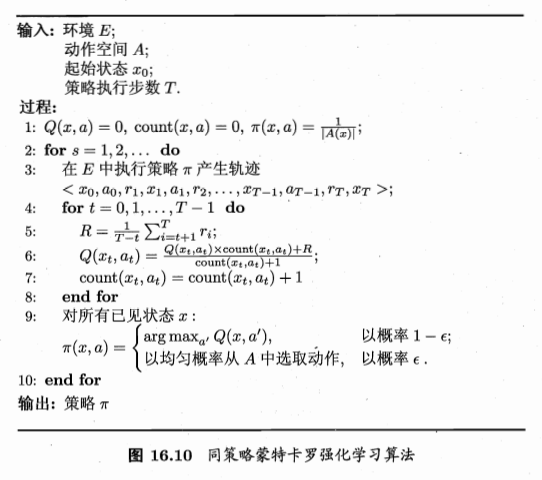
- 可使用\(\epsilon\)贪心法
- 以\(\epsilon\)的概率从所有动作中随机选取一个,以\(1-\epsilon\)的概率选取当前最优动作
- 这样多次采样会产生不同的采样轨迹
- 策略改进:
- 可以以同样的策略进行改进
- 因为引入的贪心策略是均匀分配给所有动作的
- 同策略蒙特卡罗强化学习:
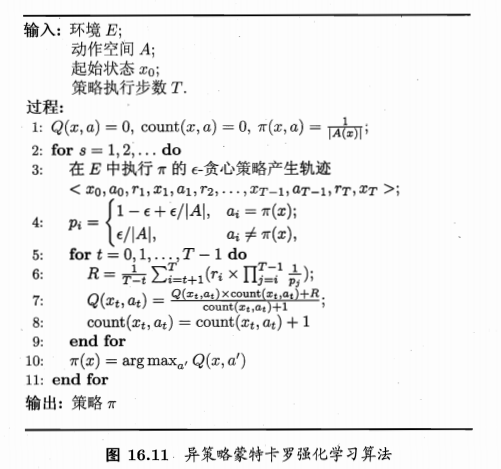
- 异策略蒙特卡罗强化学习:
时序差分学习
- 蒙特卡罗:
- 考虑采样轨迹,克服模型未知给策略评估造成的困难
- 完成采样轨迹后进行评估,效率低下
- 没有充分利用强化学习任务的MDP结构
- 时序差分:
- temporal difference
- 结合动态规划和蒙特卡罗的思想
- 更高效的免模型学习
- 蒙特卡罗:求平均是批处理式的
- 增量式进行:
- 每执行一步策略就更新一次值函数估计
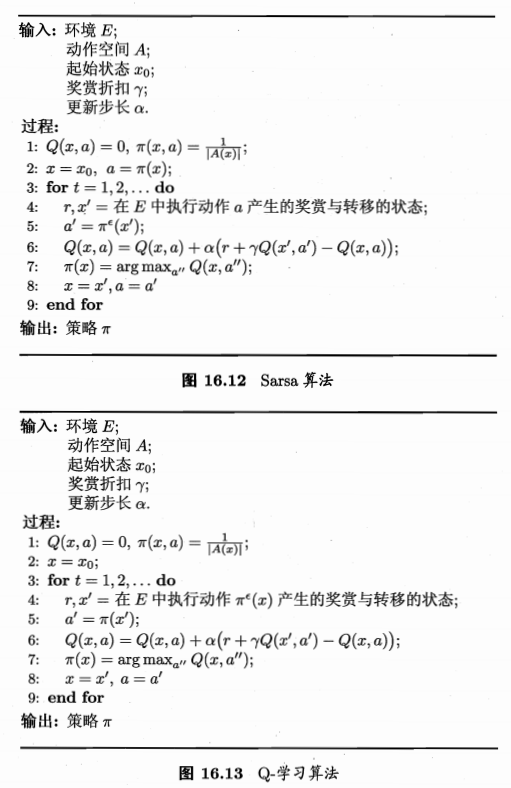
- Sarsa算法:
- 同策略算法
- 评估\(\epsilon\)-贪心策略
- 执行\(\epsilon\)-贪心策略
- 更新需知道:State前一步状态, Action前一步动作, Reward奖赏值, State当前状态, Action将执行动作【这也是使用了马尔科夫的性质的体现】
- Q-学习算法:
值函数近似
- 强化学习:
- 有限空间状态,每个状态可用一个编号指代
- 值函数:关于有限状态的表格值函数,数组表示,i对应的函数值就是数组i的值
- 状态空间是连续的?无穷多个状态?
- 状态空间离散化:转换为有限空间后求解
-
转换:是难题
- 直接对连续状态空间进行学习
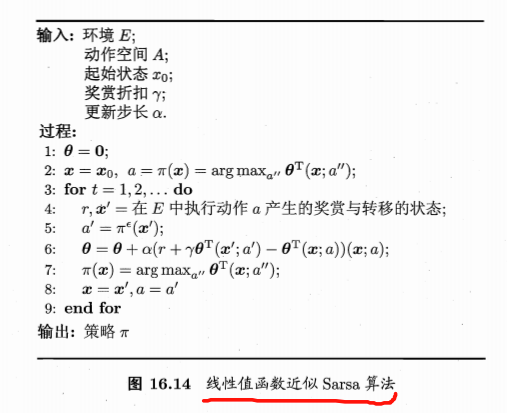
- 简化情形:值函数为状态的线性函数:\(V_{\theta}(x)=\theta^Tx\)
- x:状态向量,\(\theta\):参数向量
- 此时的值函数难以像有限状态那样精确记录,这种求解是值函数近似(value function approximation)
- 线性值函数近似:
模仿学习
- 模仿学习:
- imitation learning
- 现实任务中,往往能得到人类专家的决策过程范例,从这样的范例中学习,就是模仿学习
直接模仿学习
- 多步决策搜索空间巨大
-
缓解:直接模仿人类专家的“状态-动作对”
- 人类专家轨迹数据集:\(\{\tau_1,\tau_2,...,\tau_m\}\)
- 每条轨迹包含状态+动作:\(\tau_i=<s_1^i,a_1^i,...,s_{n_i+1}^i>\), \(n_i\):第i条轨迹的转移次数
- 数据 =》在什么状态下选择什么动作,可利用监督学习
- 抽取“状态-动作”对:
- 新数据集:\(D=\{(s_1,a_1),(s2,a_2),...\}\)
- 特征:状态
- 标记:动作
- 使用分类或回归算法学得策略模型
逆强化学习
- 现实任务:设计奖赏函数很困难
- 逆强化学习:
- 从人类专家提供的范例数据中反推奖赏函数有助于解决该问题
- inverse reinforcement learning
- 基本思想:
- 使机器做出与范例一致的行为,等价于在某个奖赏函数的环境下寻求最优策略,该策略所产生的轨迹与范例数据一致。
- 寻找某种奖赏函数使得范例数据最优,然后使用这个奖赏函数来训练强化学习策略
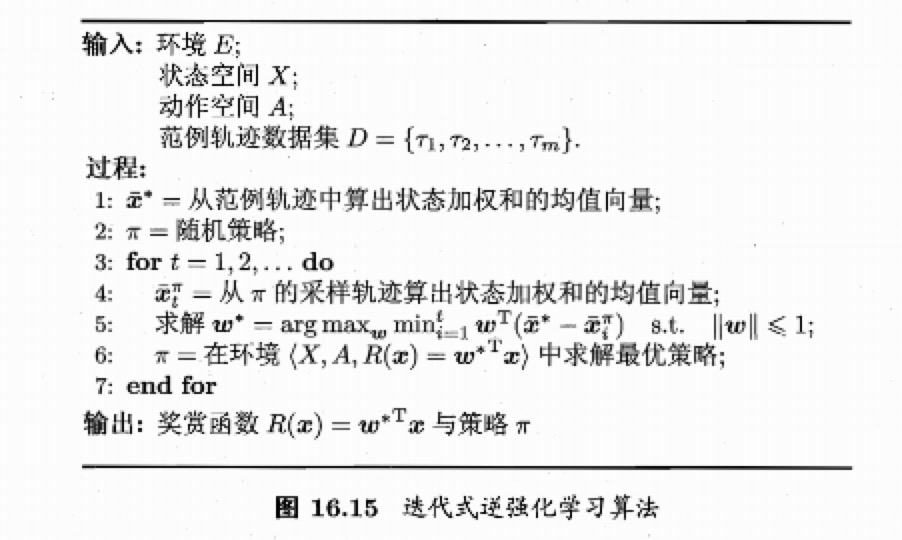
- 算法:
- 从随机策略开始
- 迭代求解更好的奖赏函数
- 基于奖赏函数获得更好的策略
- 直到最终获得最符合范例轨迹数据集的奖赏函数和策略
参考
- 机器学习周志华第16章
Read full-text »
【1-1】深度学习引言
2019-01-12
目录
简介
- AI是最新的电力
- 深度学习:AI中发展最为迅速的分支
- 课程1:神经网络与深度学习
- 神经网络基础
- 建立神经网络
- 在数据上训练
- 用一个深度神经网络进行辨认猫
- 课程2:
- 深度学习实践
- 严密构建神经网络
- 使得表现良好:超参数调整、正则化、诊断偏差和方差
- 高级优化算法:momentum、Adam
- 课程3:
- 结构化机器学习工程
- 构建机器学习系统能改变深度学习的错误
- 端对端深度学习
- 课程4:
- CNN:应用于图像领域
- 课程5:
- 序列模型
- 应用于自然语言处理
- RNN、LSTM
什么是神经网络
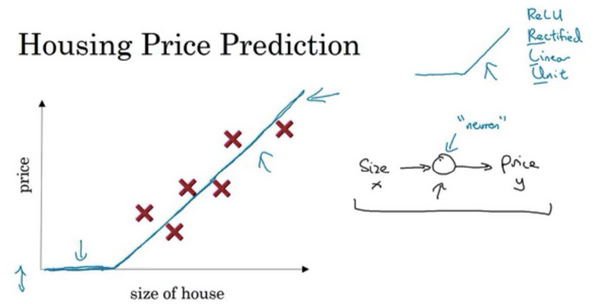
- 预测房价:
- 基于房屋面积
- 线性回归
- 房价不可能为负
- 所以让直线变得“弯曲”了一点
- 这条线对应于神经网络中的激活函数ReLU
- ReLU:Rectified Linear Unit,可以理解为max(0,x)。具有修正作用。【预测房价引入修正功能的激活函数】
- 房价预测的更复杂的神经网络:
- 同样是房价预测,其实很多其他的因素对于房价也具有影响
- 考虑:size,bedroom,zip code,wealth
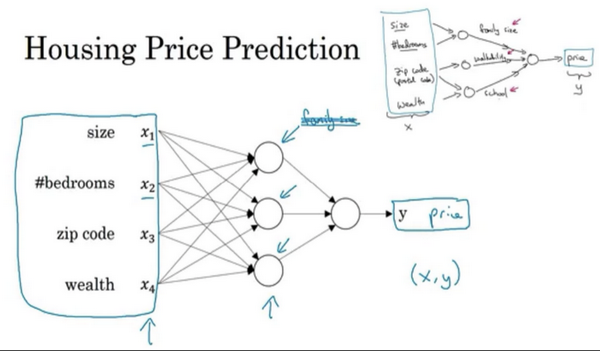
-
隐藏单元:比如第一个节点代表家庭人口,这个只与size和bedroom特征有关,通过权重来实现
- 神经网络:擅长计算从x到y的函数映射
–
神经网络的监督学习
- 神经网络创造的经济价值,本质上离不开监督学习
- 很多监督学习的例子
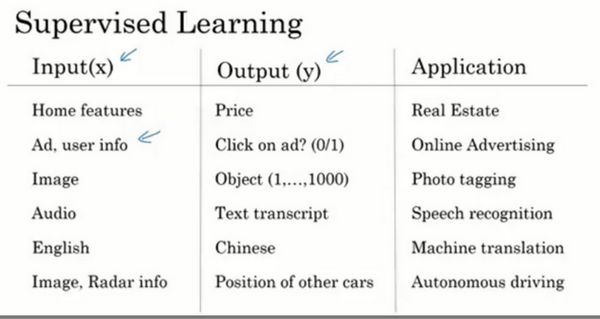
- 在线广告:
- 深度学习最获利
- 网站中输入广告的相关信息
- 输入用户的信息
- 考虑是否展示广告
- 计算机视觉:
- 给照片打标签
- 语音识别:
- 机器翻译:中英文
- 语音转换为文字
-
自动驾驶
- 标准的神经网络:房地产、在线广告
- CNN:图像
-
RNN:序列数据,如音频、语言
- 结构化 vs 非结构化:
- 结构化数据:诶个特征有一个很好的定义,基本数据库等
- 非结构化数据:音频、图像、文本,特征可能是像素值或者单个单词
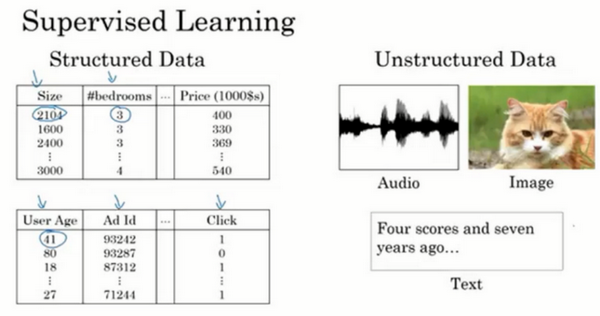
- 计算机:善于理解结构化数据
- 人:善于解读非结构化数据
为什么深度学习会兴起
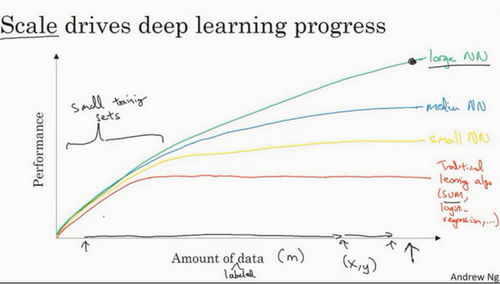
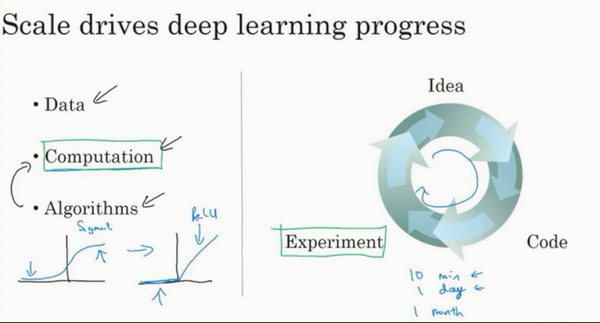
- 数据规模增大
- 数字化的数据
- 超过传统机器学习算法的能力
- 好的性能:【1】训练足够大的神经网络,【2】需要很多的数据
- 算法的创新:
- 巨大突破:从sigmoid函数转换到ReLU函数。sigmoid的梯度会接近于0,从而参数更新非常缓慢,速率变得很慢。
- 更多的影响:计算的优化。提出想法到实现想法,检查结构时间更短。
- 计算能力的提升
参考
Read full-text »
规则学习
2019-01-10
目录
基本概念
- 规则:
- rule
- 语义明确、能描述数据分布所隐含的客观规律或领域概念
- 可写成”若。。。,则。。。“形式的逻辑规则
- 形式表示:\(\bigoplus \leftarrow f_1 \wedge f_2 \wedge \cdot\cdot\cdot \wedge f_L\)
- \(\leftarrow\):逻辑蕴含符号
- \(f_1 \wedge f_2 \wedge \cdot\cdot\cdot \wedge f_L\):规则体(body),表示该规则的前提(右边部分)。由逻辑文字组成的合取式,\(\wedge\):表示并且。
- \(\bigoplus\):规则头(head),表示该条规则的结果。一般是逻辑文字,规则所判定的目标类别或概念。
- \(L\):规则中逻辑文字的个数,是规则的长度
- 这样的逻辑规则也称为”if-then规则“
- 规则学习:
- rule learning
- 从训练数据中学习出一组能用于对未见示例进行判别的规则
- 具有更好的可解释性
- 数理逻辑具有很强的表达能力
- 覆盖:cover,符合某规则的样本称为被该规则覆盖
- 例子:
- 规则1:\(好瓜 \leftarrow (根蒂=蜷缩) \wedge(脐部=凹陷)\)
- 规则2:\(\neg好瓜 \leftarrow (纹理=模糊)\)
- 被规则1覆盖的是好瓜,但未被规则1覆盖的未必不是好瓜
- 被规则2覆盖的是好瓜,但未被规则2覆盖的不是好瓜。因为此时的规则头带有\(\neg\)标签
- 冲突:
- conflict
- 规则集合中的每一条规则可看做一个模型
- 当同一个示例被判别结果不同的多条规则覆盖时,发生冲突
- 冲突消解:
- conflict resolution
- 投票法:判别规则数多的一类结果
- 排序法:在规则集合上定义顺序,冲突时使用排序最前的规则。带序规则或者优先级规则
- 元规则法:根据领域知识事先设定一些元规则,即关于规则的规则,比如”发生冲突时使用长度最短的规则“
- 默认规则:
- default rule
- 有的样本不能被所有规则所覆盖
- 处理未被覆盖的样本,比如设置默认规则:未被规则1、2所覆盖的瓜不是好瓜
- 形式分类:
- 命题规则:原子命题和逻辑连接词构成的简单陈述句。
- 一阶规则:所有自然数加1都是自然数,这种就是一阶规则,可以写成表达式:\(\forall X(自然数(\sigma(X)) \leftarrow 自然数(X), sigma(X)=X+1)\)
- 能表达复杂的关系,也称为关系型规则(relational rule)
- 命题规则是一阶规则的一个特例,一阶规则的学习复杂得多
序貫覆盖
- 规则学习目标:产生一个能覆盖尽可能多的样本的规则集
- 序貫覆盖:
- sequential covering
- 最直接做法
- 逐条归纳
- 在训练集上每学到一条规则,就将该规则覆盖的训练样本去除,然后以剩下的训练样本组成训练集重复上述过程
- 每次只处理一部分数据,也称为分治策略
- 关键:如何从训练集学出单条规则
- 寻找最优的一组逻辑文字构成规则体
- 搜索问题
- 最简单做法:
- 从空规则开始
- 将正样本类别作为规则头,逐个遍历训练集中的每个属性及取值,尝试将其作为逻辑文字增加到规则体中
- 若能使当前规则仅覆盖正样本,则产生一条规则
-
去除此规则所覆盖的正样本,尝试生成下一条规则
- 例子:西瓜训练集2.0
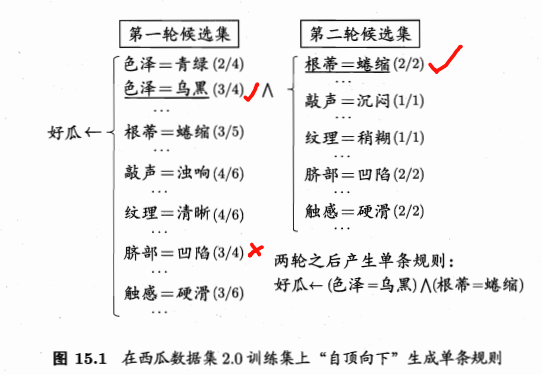
- 根据第一个样本加入规则:\(\neg好瓜 \leftarrow (色泽=亲绿)\)
- 此规则覆盖样本1,6,10,17,其中2个正样本,2个负样本,不符合规则的条件
- 尝试基于”色泽“的其他原子命题:”色泽=乌黑“,亦不能满足
- 基于”色泽“不能产生一条规则,所以返回”色泽=青绿“,尝试增加一个基于其他属性的原子命题,比如”根蒂=蜷缩“,\(好瓜 \leftarrow (色泽=青绿) \wedge(根蒂=蜷缩)\)
- 此规则覆盖了负样本17,不行
- 更换基于”根蒂“的其他原子命题:\(好瓜 \leftarrow (色泽=青绿) \wedge(根蒂=稍蜷)\)
- 此规则不覆盖任何负样本,符合规则的条件
- 保留此规则,去掉其覆盖的正样本6,将剩下的样本作为训练集。重复进行规则生成。
- 最后可得到一个序贯覆盖学习的结果:

- 缺点:基于穷尽搜索,在属性和候选值较多事出现组合爆炸
- 现实策略:
- 自顶向下:top-down,从比较一般的规则开始,逐渐添加新文字以缩小规则覆盖范围,直到满足预定条件为止。规则逐渐特化的过程,也称为生成-测试法。
- 自底向上:bottom-up,从比较特殊的规则开始,逐渐删除文字以扩大规则覆盖范围,直到满足条件为止。规则逐渐泛化的过程,也称为数据驱动法。
- 自顶向下:容易获得泛化性能较好的规则,对噪声的鲁棒性更强。命题规则学习通常使用。
- 自底向上:更适合训练样本较少的情形。一阶规则学习这类假设空间很复杂的任务上使用。
- 自顶向下:
- 序贯覆盖:
- 简单有效
- 基本框架,可扩展至其他规则学习
- 多分类问题:当学习第c类的规则时,将所有 属于类别c的为正样本,其他均为负样本
剪枝优化
- 规则生成:贪心搜索过程,容易过拟合
- 缓解过拟合:
- 后剪枝:
- 减错剪枝,reduced error pruning,REP
- 将样本集划分为训练集和验证集
- 从训练集学得规则集合
- 对规则集合进行多轮剪枝:每一轮穷举可能的剪枝操作,然后用验证集对剪枝产生的所有候选规则集进行评估,保留最好的那个规则集进行下一轮剪枝
-
重复,直到通过剪枝无法提高验证集的性能为止
- 有效
-
复杂度太高
- IREP:incremental REP
- 在生成每条规则前,先将当前样本集划分为训练集和验证集
- 在训练集山生成一条规则r,立即在验证集上对其进行REP剪枝,得到规则r’
- 将r’覆盖的样本去掉,在更新后的数据集上重复上述过程
- IREP:对单条规则进行剪枝,更加高效
- REP:针对规则集进行剪枝
- RIPPER:
- 泛化性能超过很多决策树
- 学习速度更快
- 将剪枝和后处理优化相结合
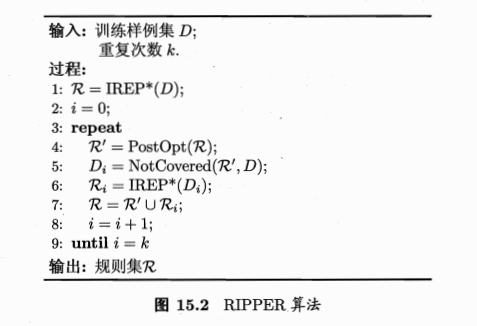
- 剪枝+后处理:
- 对于R中的每条规则\(r_i\),会产生两个变体:
- \(r_i'\):基于\(r_i\)覆盖的样本,用IREP*重新生成一条规则\(r_i'\),称为替代规则(replacement rule)
- \(r_i''\):对\(r_i\)增加文字进行特化,然后使用IREP*剪枝生成一条规则\(r_i''\),称为修订规则(revised rule)
-
把\(r_i'\)和\(r_i''\)分别与R中除了\(r_i\)之外的规则放在一起,组成规则集R’和R‘’,与R进行比较,选择最优的保留下来。
- 为什么更好?
- 之前:按序生成规则,每条规则没有考虑对其后产生的规则,属于贪心算法,容易陷入局部最优
- 现在:后处理优化过程中将R中的所有规则放在一起重新加以优化,是通过全局的考虑来缓解贪心算法的局部性,从而得到更好的效果。
一阶规则学习
- 命题逻辑:难以处理对象之间的关系
- 挑西瓜:很难把西瓜的特征用具体的属性值描述出来
- 现实:西瓜之间进行比较。命题逻辑难以胜任。
- 关系数据:根据属性的比较,可以把训练集转换为关系集
- 一阶规则:
- 规则头、规则体:一阶逻辑表达式
- 可表达递归概念:\(更好(X,Y) \leftarrow 更好(X,Z) \wedge 更好(Z,Y)\)
- 容易引入领域知识
- FOIL:
- first-order inductive learner
- 著名的一阶规则学习算法
- 遵循序罐覆盖框架且采用自顶向下的规则归纳策略
- 使用“FOIL增益”来选择文字:\(F_{Gain}=\hat m_+ \times (log_2{\frac{\hat m_+}{\hat m_+ + \hat m_-}} - log_2{\frac{m_+}{m_+ + m_-}})\)
- vs 决策树增益:仅考虑正样本的信息量,并使用新规则覆盖的正样本数作为权重
归纳逻辑程序设计
- 归纳逻辑程序设计
- ILP:inductive logic programming
- 一阶规则学习中引入函数和逻辑表达式嵌套
- 具备强大的表达能力
- 解决基于背景知识的逻辑程序归纳
- 函数和表达式嵌套的挑战:
- 给定一元谓词P、一元函数f
- 组成的文字有无穷多个
- 候选原子公式有无穷多个
- 若采用自顶向下的规则生成,在规则长度很大时无法列举而失败
最小一般泛化
- 归纳逻辑:
- 自底向上
- 一个正样本作为初始
- 对规则进行逐步泛化
- 泛化:
- 将规则中的常量替换为逻辑变量
- 删除规则中的某个文字
- 最小一般泛化:
- LGG:least general generalization
-
把特殊的规则转变为更一般的规则
- 给定一阶公式r1,r2
- 先找出涉及相同谓词的文字
- 对文字的每个位置的常量进行考察
- 若常量在两个文字中相同则保持不变,记为:\(LGG(t,t)=t\)
- 若不同则替换为用一个新变量,且变换应用于公式其他位置,记为:\(LGG(s,t)=V\),V是新变量
- 例子:
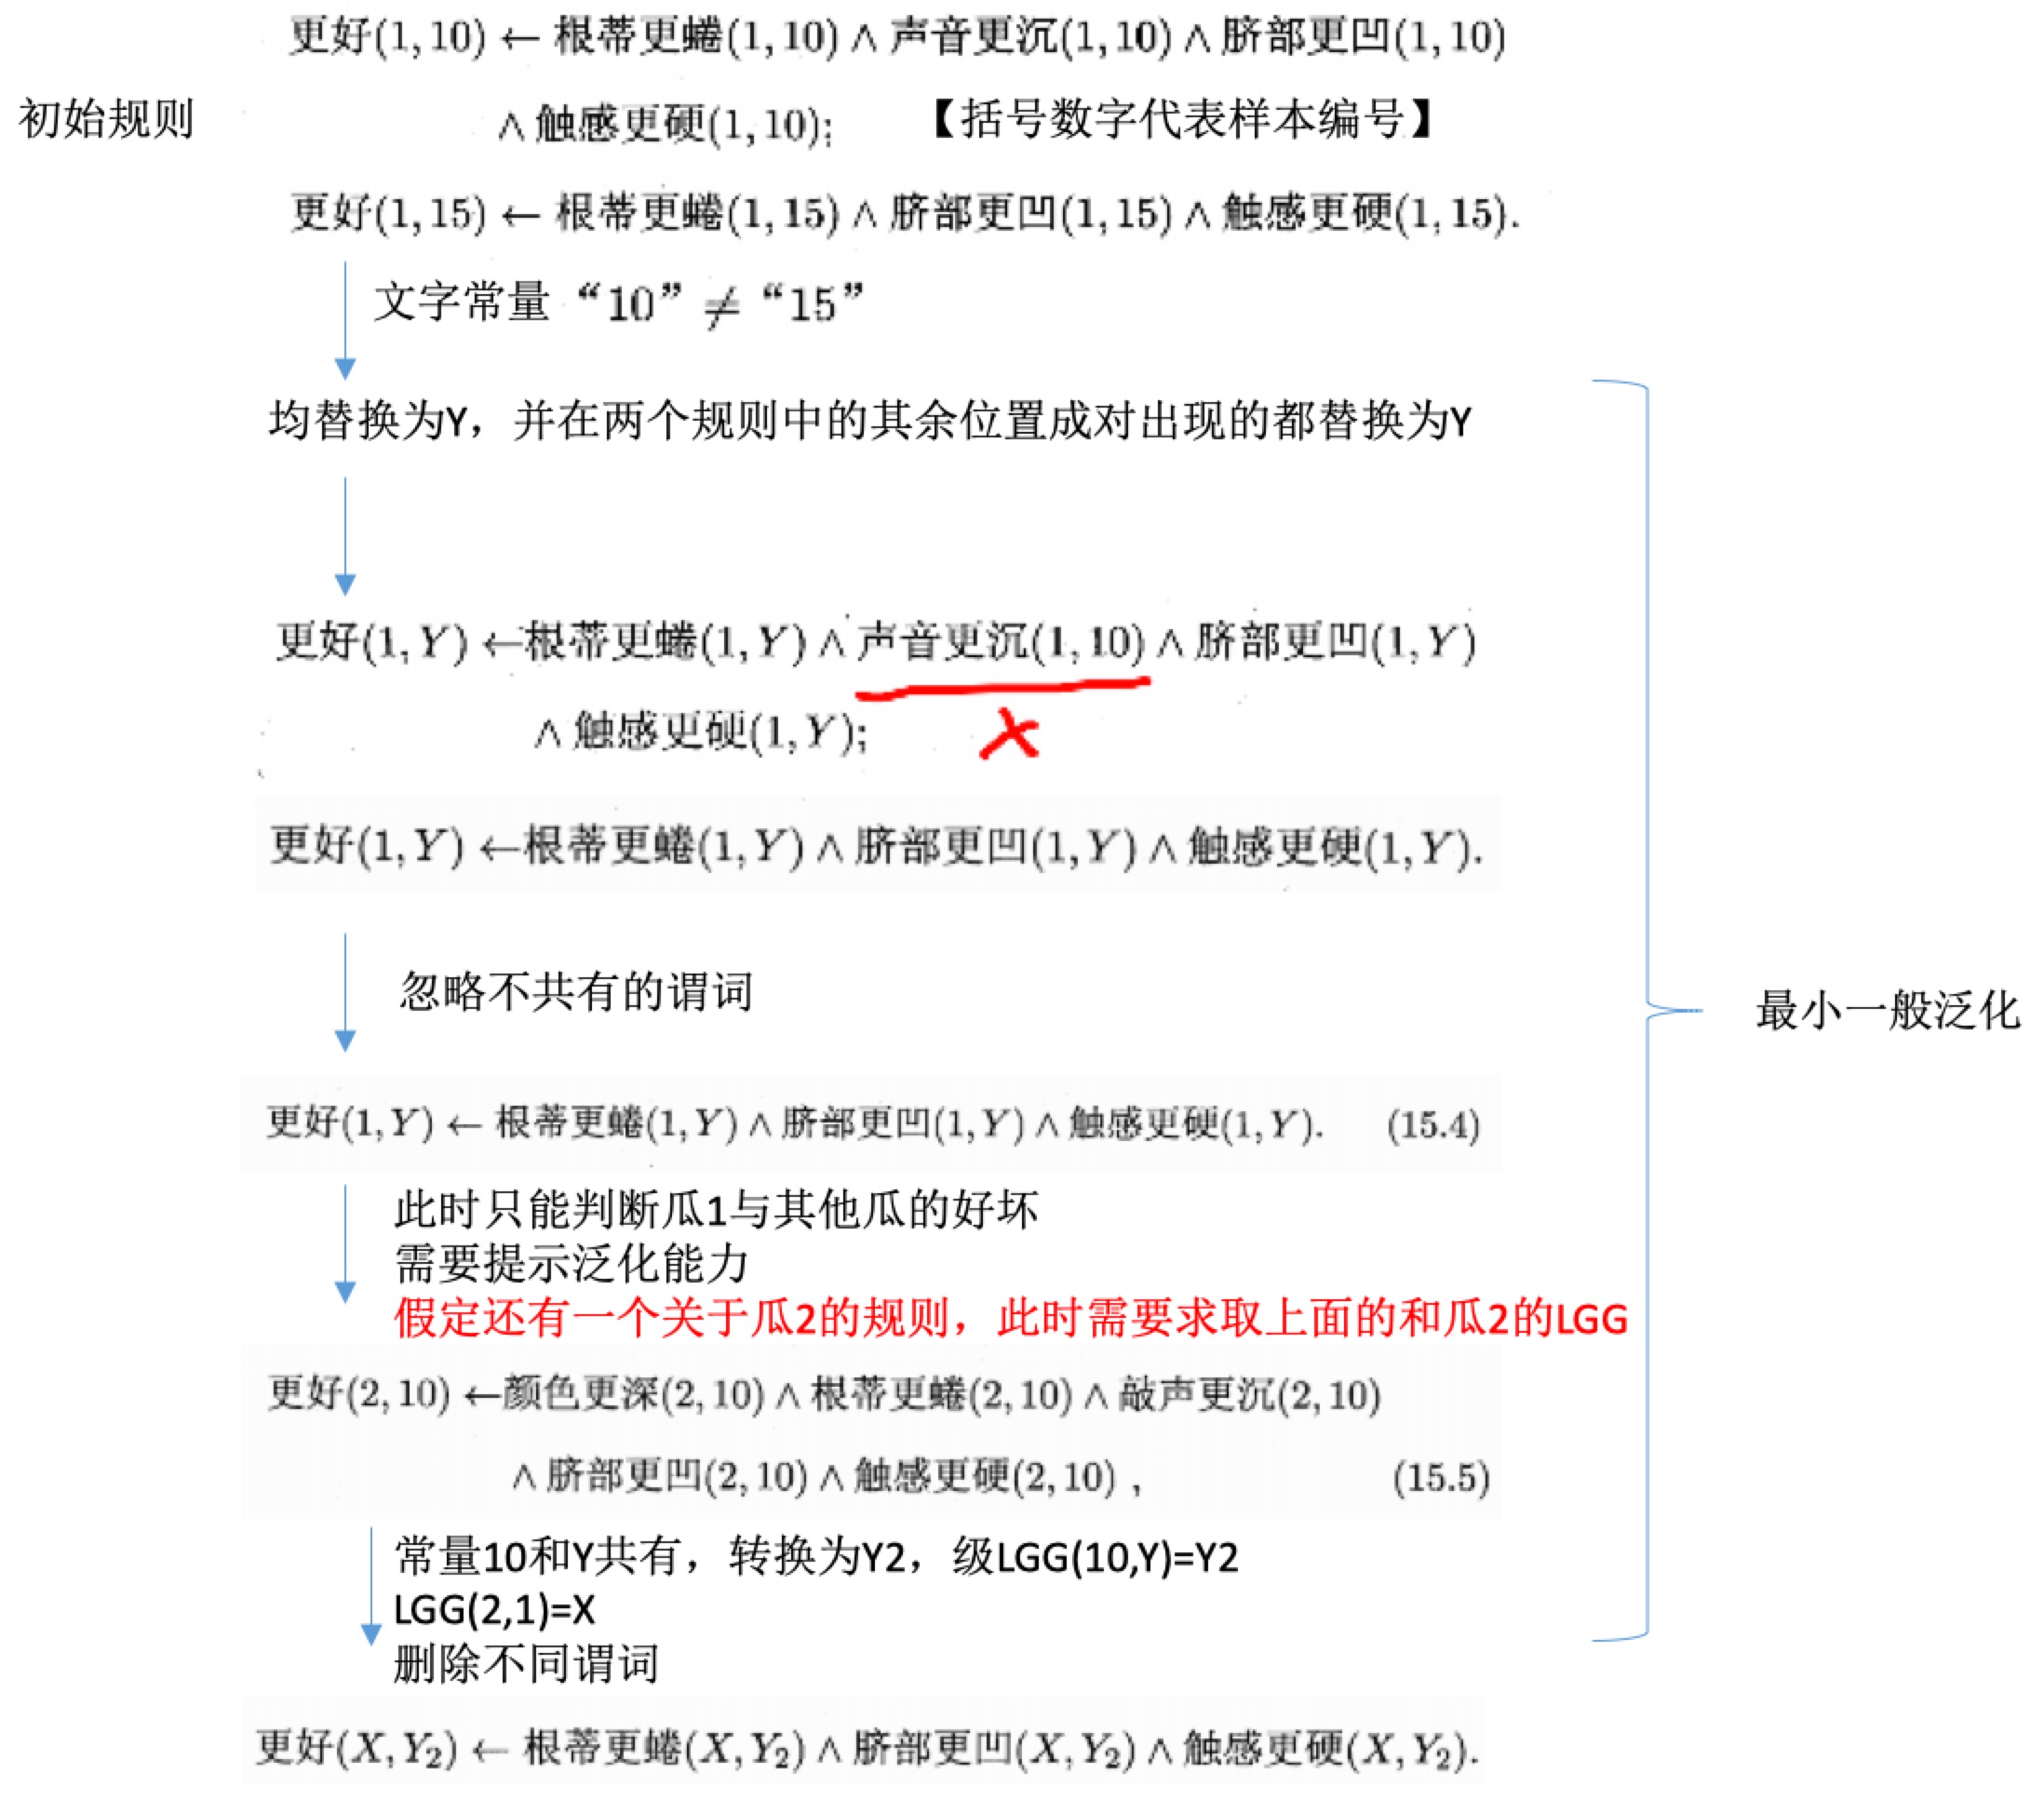
- LGG是能特化为r1和r2的所有一阶公式中最为特殊的一个:BU 不存在既能特化为r1和r2,也能泛化为他们的LGG的一阶公式r‘。
逆归结
- 演绎:从一般性规律出发来探讨具体事物。代表:数学定理证明
- 归纳:从个别事物出发概括出一般性规律。代表:机器学习
- 归结原理:
- resolution principle
- 一阶谓词演算中的演绎推理能用一条十分简洁的规则描述
- 将复杂的逻辑规则与背景知识联系起来化繁为简
- 逆归结:基于背景知识来发明新的概念和关系
参考
- 机器学习周志华第15章
Read full-text »
概率图模型
2019-01-07
目录
图模型
- 任务:根据已观测的样本对感兴趣的未知变量进行估计和推测
- 概率模型:将学习任务归结为计算变量的概率分布的描述框架
- 推断:利用已知变量推测未知变量的分布。核心:基于观测变量推测出未知变量的条件分布。
- 给定:关心的变量集合Y、可观测变量集合O、其他变量集合R
- 生成式模型:考虑联合分布\(P(Y,R,O)\)
- 判别式模型:考虑条件分布\(P(Y,R\|O)\)
- 推断:由观测变量值\(P(Y,R,O)\)或者\(P(Y,R\|O)\),推断得到条件概率分布\(P(Y\|O)\)
- 概率图模型:
- 一类用图表达变量相关关系的概率模型
- 节点:一个或一组随机变量
- 边:变量间的概率相关关系(变量关系图)
- 分类:基于边的性质
- 有向图(贝叶斯网):使用有向无环图表示变量间的依赖关系
- 无向图(马尔科夫网):使用无向图表示变量间的相关关系
隐马尔科夫模型(有向图)
- 隐马尔科夫模型:hidden markov model,HMM
- 结构最简单的动态贝叶斯网络
- 著名的有向图模型
- 时序数据建模:语音识别、自然语言处理
- 变量:
- 状态变量:\(y_i\),第i时刻的系统状态,通常为隐藏的,也称为隐变量(hidden variable)
- 系统通常在多个状态之间切换,因此状态变量的取值范围称为状态空间,通常是N个可能取值的离散空间。
- 观测变量:\(x_i\),第i时刻的观测值

- 箭头:变量间的依赖关系
- 观测变量:取值仅依赖于状态变量,即\(x_t\)由\(y_t\)确定,与其他状态变量及观测变量的取值无关
- t时刻的状态\(y_t\)仅依赖于t-1时刻的状态\(y_{t-1}\),与其余n-2个状态无关。即马尔科夫链:系统下一时刻的状态仅由当前状态决定,不依赖于以往的任何状态。
- 模型参数:
- 状态转移概率:模型在各个状态间切换的概率。记为矩阵:\(A=[a_{ij}]_{N\times N}\),其中的\(a_{ij}=P(y_{t+1}=s_j\|y_t=s_i), 1\le i, j\le N\)表示:在时刻\(t\)状态为\(s_i\),在下一时刻状态为\(s_j\)的概率
- 输出观测概率:模型根据当前状态获得各个观测值的概率。记为矩阵\(B=[b_{ij}]_{n\times M}\),其中的\(b_{ij}=P(x_t=o_j\|y_t=s_i), 1\le i, j\le N\)表示:在时刻\(t\)状态为\(s_i\),则观测值为\(o_j\)的概率
- 初始状态概率:模型在初始时刻各状态出现的概率。记为\(\pi={\pi_1,\pi_2,...,\pi_N}\),其中\(\pi_i=P(y_1=s_i), 1\le i\le N\)表示:模型的初始状态为\(s_i\)的概率
- 模型表示:
- 状态空间Y
- 观测空间\(\chi\)
- 3参数:状态转移概率,输出观测概率,初始状态概率,\(\lambda=[A,B,\pi]\)
- 对于给定参数的模型,产生观测序列的过程:
- 设置t=1,根据初始状态概率\(\pi\)选择初始状态\(y_1\)
- 根据状态\(y_t\)和输出观测概率\(B\)选择观测变量取值\(x_t\)
- 根据状态\(y_t\)和状态转移矩阵\(A\)转移模型状态,即确定\(y_{t+1}\)
- 若\(t<n\),设置\(t=t+1\),并转移到第2步,否则停止
- 3个基本问题:
- 给定模型与观测序列的匹配程度。给定模型\(\lambda=[A,B,\pi]\),如何计算产生观测序列\(x=[x_1,x_2,...,x_n]\)的概率\(P(x\|\lambda)\)。【根据以往的观测,推测当前观测有可能的值,求取概率\(P(x\|\lambda)\)取最大的】
- 给定模型和观测推断隐藏状态。给定模型\(\lambda=[A,B,\pi]\)和观测序列\(x=[x_1,x_2,...,x_n]\),如何找到与此观测序列最匹配的状态序列\(y={y_1,y_2,...,y_n}\)。【语音识别:观测值为语音信号,隐藏状态为文字,根据信号推测最可能的文字】
- 给定观测序列得到最佳模型参数。给定观测序列\(x=[x_1,x_2,...,x_n]\),如何调整模型参数\(\lambda=[A,B,\pi]\),使得该序列出现的概率最大。【通常不好人工指定模型参数,需根据训练样本学得最优参数】
马尔科夫随机场(无向图)
- 典型的马尔科夫网的无向图模型
- 节点:一个或一组变量
- 边:变量之间的依赖关系
-
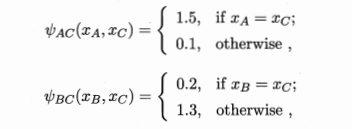
势函数(potential functions):又称为因子,定义在变量子集上的非负实函数,主要用于定义概率分布函数
- 例子:简单的随机场

- 团:clique,对于某个子集节点,若其中任意两结点有边连接,则子集为一个团
- 极大团:maximal clique,在一个团中加入另外任何一个结点都不再形成团。极大团就是不能被其他团所包含的团。
- {x1,x2,x3}不构成团,因为x2与x3之间无连接
- {x2,x6}是团,但不是极大团,因为可加入x5,从而形成团。同样的{x2,x5},{x5,x6}都不是极大团
- 极大团:{x1,x2},{x1,x3},{x2,x4},{x3,x5},{x2,x5,x6}
-
每个节点至少出现在一个极大团中
- 多变量的联合概率分布:
- 基于团分解为多个因子的乘积,每个因子仅与一个团有关
- n个变量\(x={x_1,x_2,...,x_n}\),所有团构成的集合是C,\(x_Q\):团\(Q\subset C\)对应的变量集合
-
联合概率:\(P(x)=\frac{1}{Z}\prod_{Q\subset C}\phi_Q(x_Q)\),\(\phi_Q\)是团Q对应的势函数(因子),可对Q中的变量关系进行建模,Z是规范化因子,确保P(x)是被正确定义的概率。
- 若变量个数很多,团数目很多,很多项的乘积,有计算负担
- 注意:若团Q不是极大团,则Q必须被一个极大团\(Q'\)包含,即\(x_Q\subseteq x_{Q*}\)
- 所以联合概率可基于极大团定义
- 极大团集合为\(C'\):\(P(x)=\frac{1}{Z*}\prod_{Q\subset C*}\phi_Q(x_Q)\)
- 对于上面的例子有(5个极大团的联合):

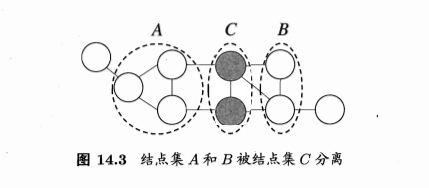
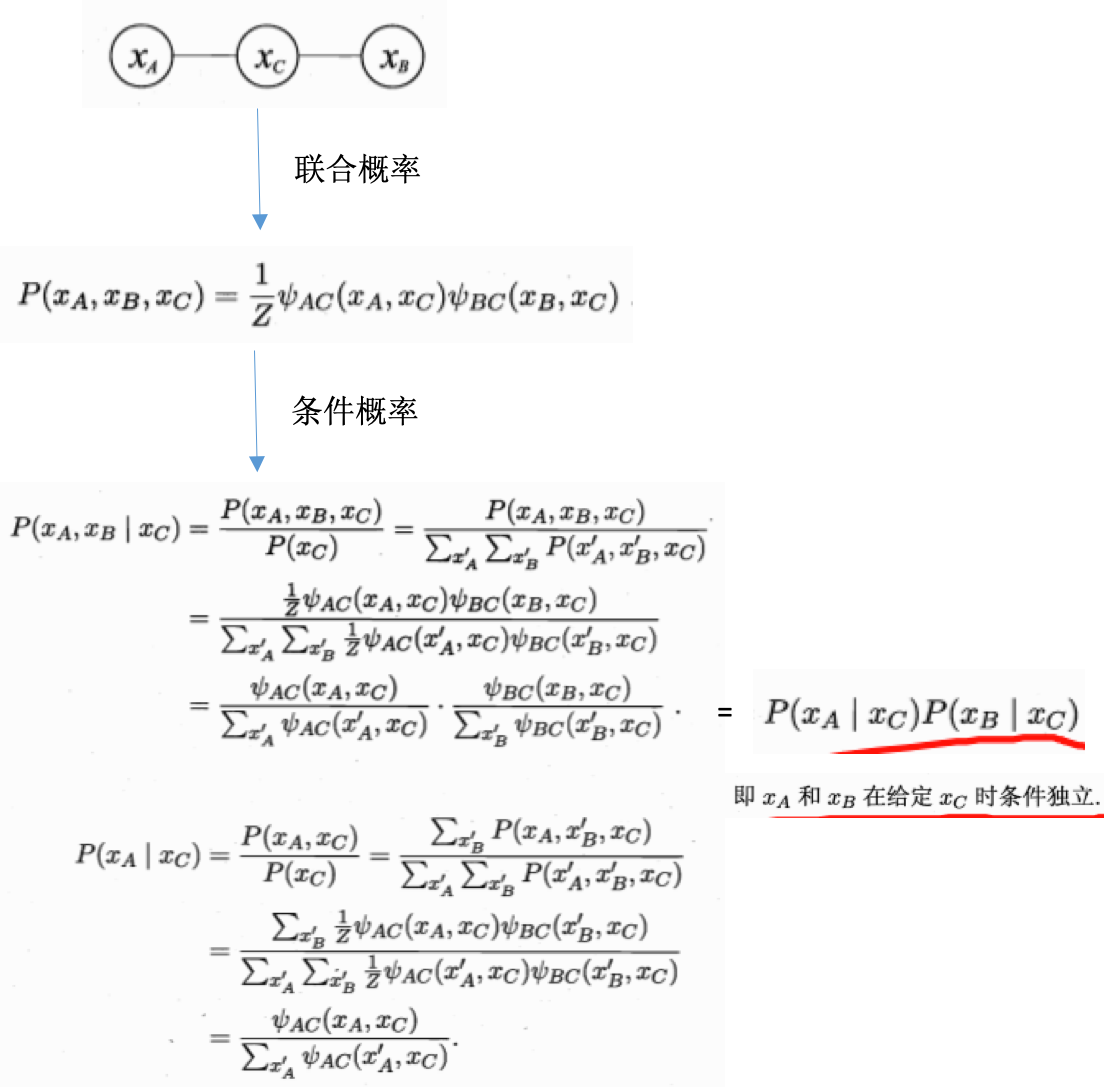
- 条件独立性
- 势函数:
条件随机场
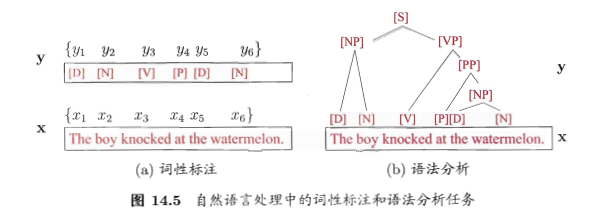
- 生成式模型:对联合分布进行建模。隐马尔科夫模型、马尔科夫随机场都是生成式的。
- 判别式模型:对条件分布进行建模。条件随机场模型。
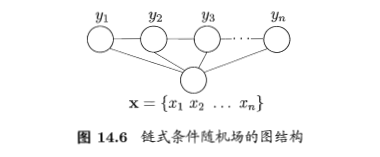
- 条件随机场:
- \(G=<V,E>\):结点与标记变量一一对应的无向图,若每个变量\(y_v\)均满足马尔科夫性,即:\(P(y_v\|x,y_{V\{v\}})=P(y_v\|x,y_{n(v)})\),则(y,x)构成一个条件随机场。
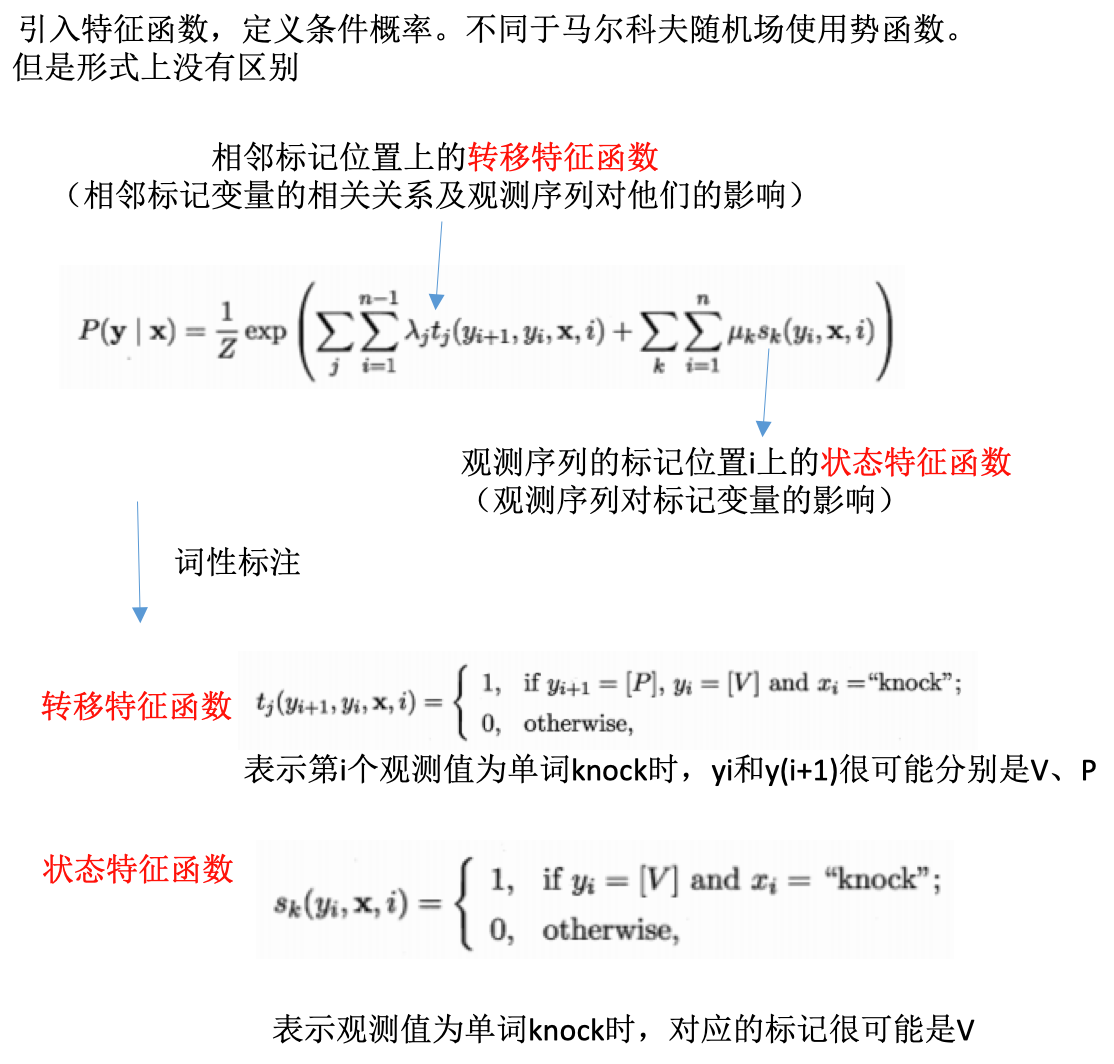
- 链式条件随机场:chain-structured CRF
- 条件概率定义:
学习与推断
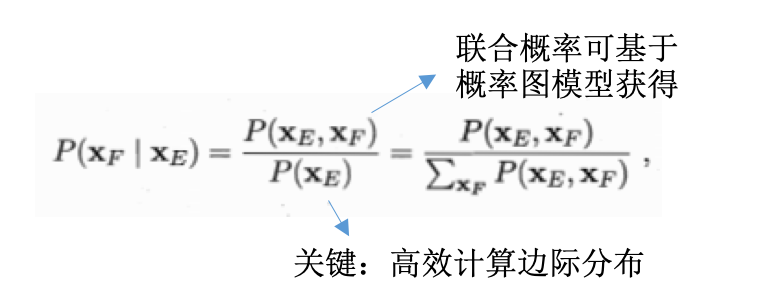
- 基于概率图模型定义的联合概率分布,对目标变量的边际分布或以某些可观测变量为条件的条件分布进行推断
- 边际分布:对无关变量求和或者积分后得到的结果。
- 例子:马尔科夫网,变量的联合分布表示为极大团的势函数乘积,给定参数\(\Theta\)求解变量x的分布,就是对其他无关变量进行积分的过程,称为边际化(marginalization)
- 参数估计(学习):确定具体分布的参数,极大似然法估计或者最大后验概率估计求解
- 具体的:
- 概率图推断:
- 精确推断:计算出目标变量的边际分布或条件分布的精确值。一般计算复杂度极高。
- 近似推断法:在较低的时间复杂度下获得原问题的近似解。
变量消去(精确推断)
- 动态规划算法
- 利用图模型所描述的条件独立性来消减计算目标概率值所需的计算量
-
最直观的精确推断法
- 有向图的推断流程:
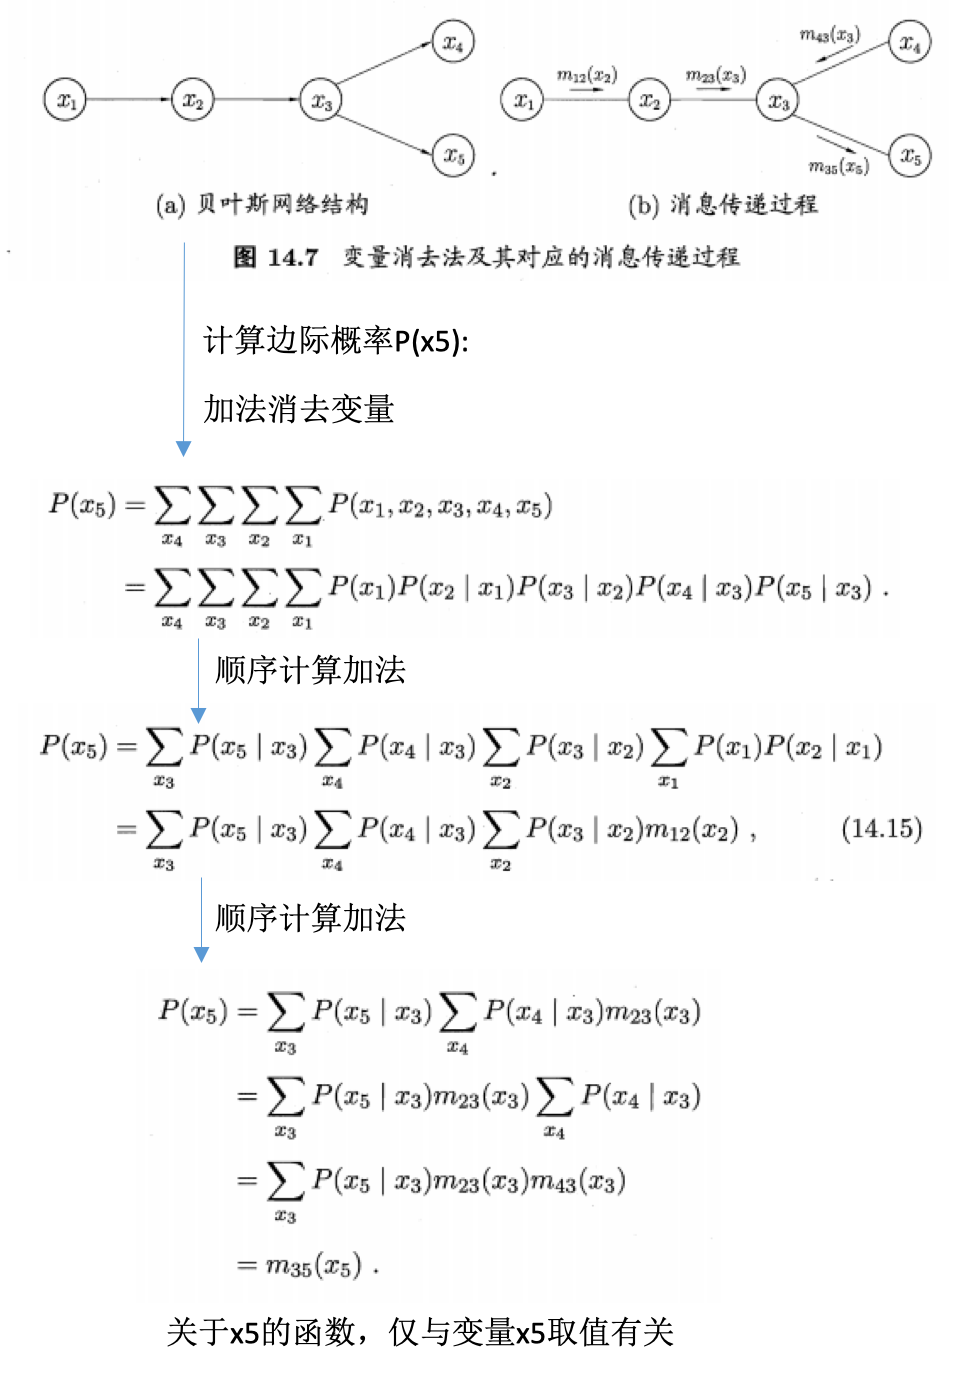
-
同样适用于无向图
- 缺点:
- 若需计算多个边际分布,重复使用变量消去法将会造成大量的冗余计算
信念传播
- 信念传播:belief propagation,将变量消去法中的求和操作看做一个消息传递过程,解决多个边际分布计算时的重复问题
- 消去过程看成是消息传递过程
- 每次消息传递仅与变量xi及其邻接结点直接相关(消息传递的计算被限制在图的局部进行)
- 一个结点仅在接收到其他所有结点的消息后才能向另一个结点发送消息
- 结点的边际分布正比于所接收的消息的乘积
近似推断
- 精确推断:大计算开销
- 近似推断:更常用
- 采样:sampling,使用随机化方法完成近似
- 变分推断:variational inference,使用确定性近似完成近似推断
MCMC采样
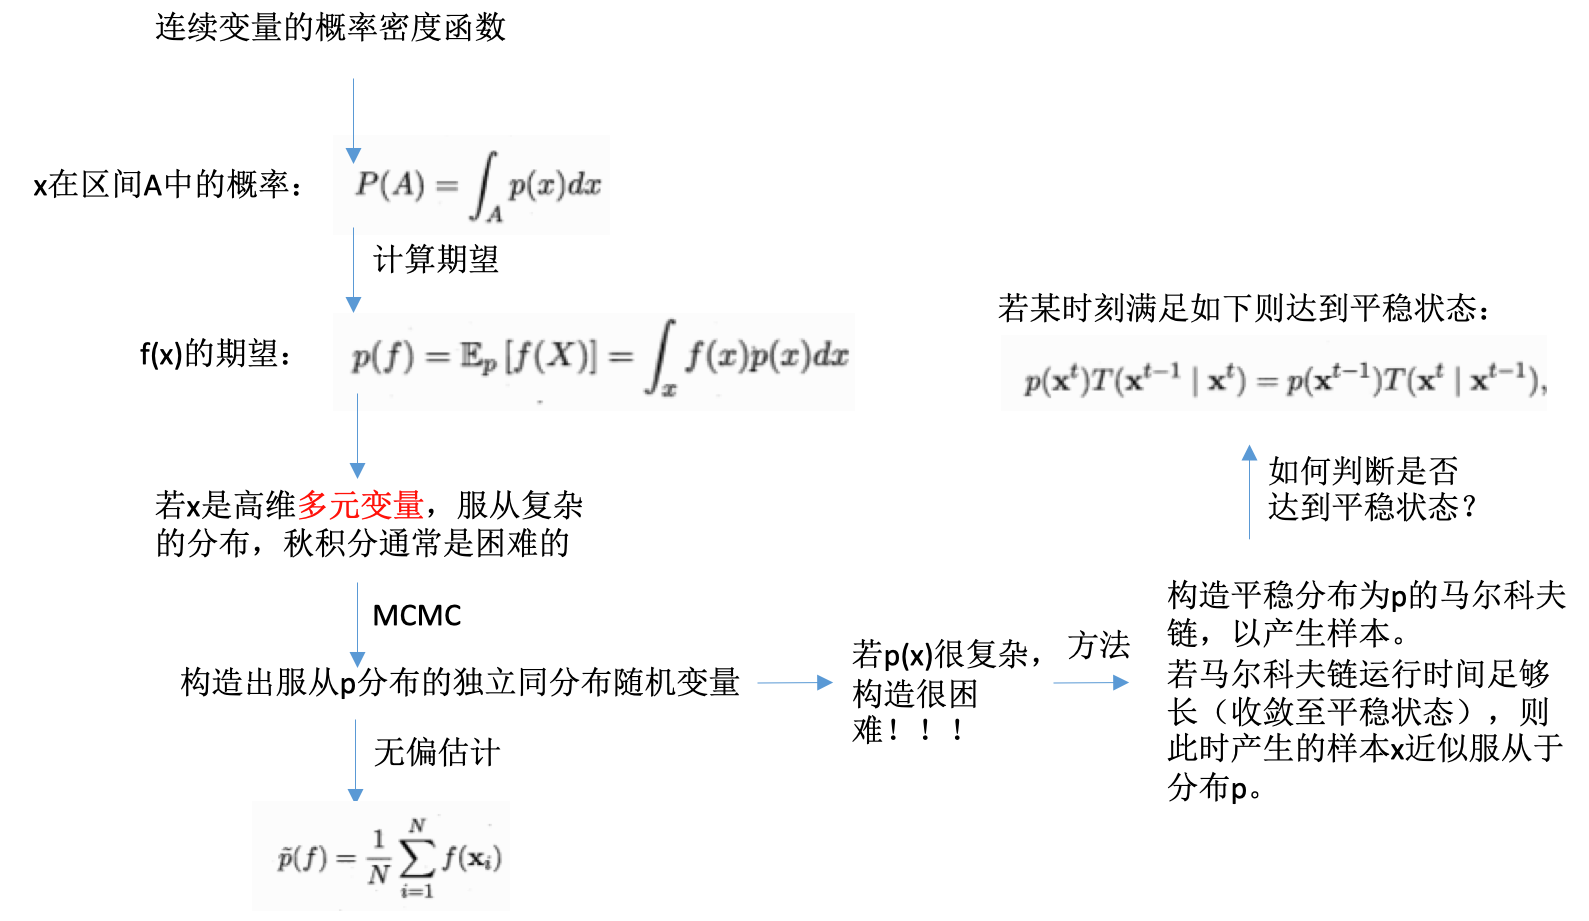
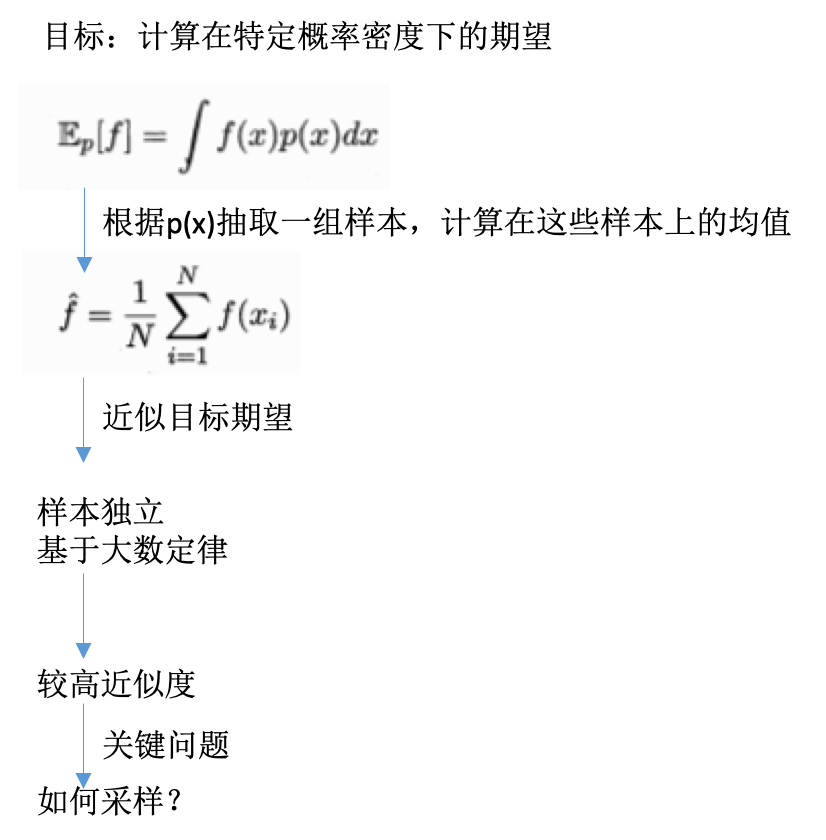
- 关心分布不是真的关心分布,是可以计算期望,以提供决策
- 推断很可能是计算期望
- 如果直接计算期望比推断概率更容易,则可直接操作计算期望使得推断的求解更高效
- 例子:
-
关键:采样,高效的基于图模型所描述的概率分布来获取样本
- MCMC:
- 马尔科夫链蒙特卡洛方法
- markov chain monte carlo
- 概率图模型最常用的采样技术
- 具体:
- 构建马尔科夫链关键:
- 构造转移概率
- 不同的构造方法得到不同的MCMC算法
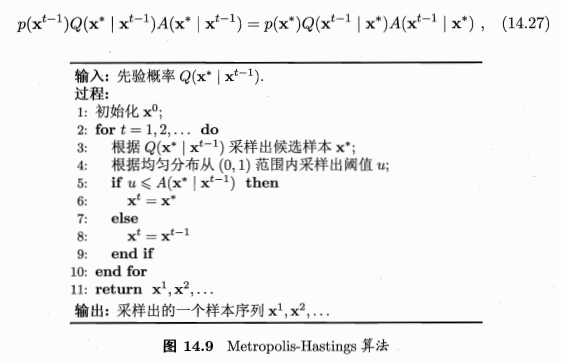
- MH算法
- 吉布斯采样:
- gibbs sampling
- MH算法的特例
- 同样适用马尔科夫链获取样本,该马尔科夫链的平稳分布也是采样的目标分布p(x)
- 具体:
- 给定\(x={x_1,x_2,...,x_N}\),目标分布p(x),初始化x的取值
- (1) 随机或以某个次序选取某变量\(x_i\)
- (2) 根据x中除了\(x_i\)外的变量的现有取值,计算条件概率\(p(x_i\|X_{\bar i})\)
- (3) 根据\(p(x_i\|X_{\bar i})\)对样本变量\(x_i\)采用,用采样值代替原值。【所以区别是没有拒绝概率这一条?】
变分推断
- 使用已知简单分布来逼近需推断的复杂分布
-
通过限制近似分布的类型,得到一种局部最优、但具有确定解的近似后验分布
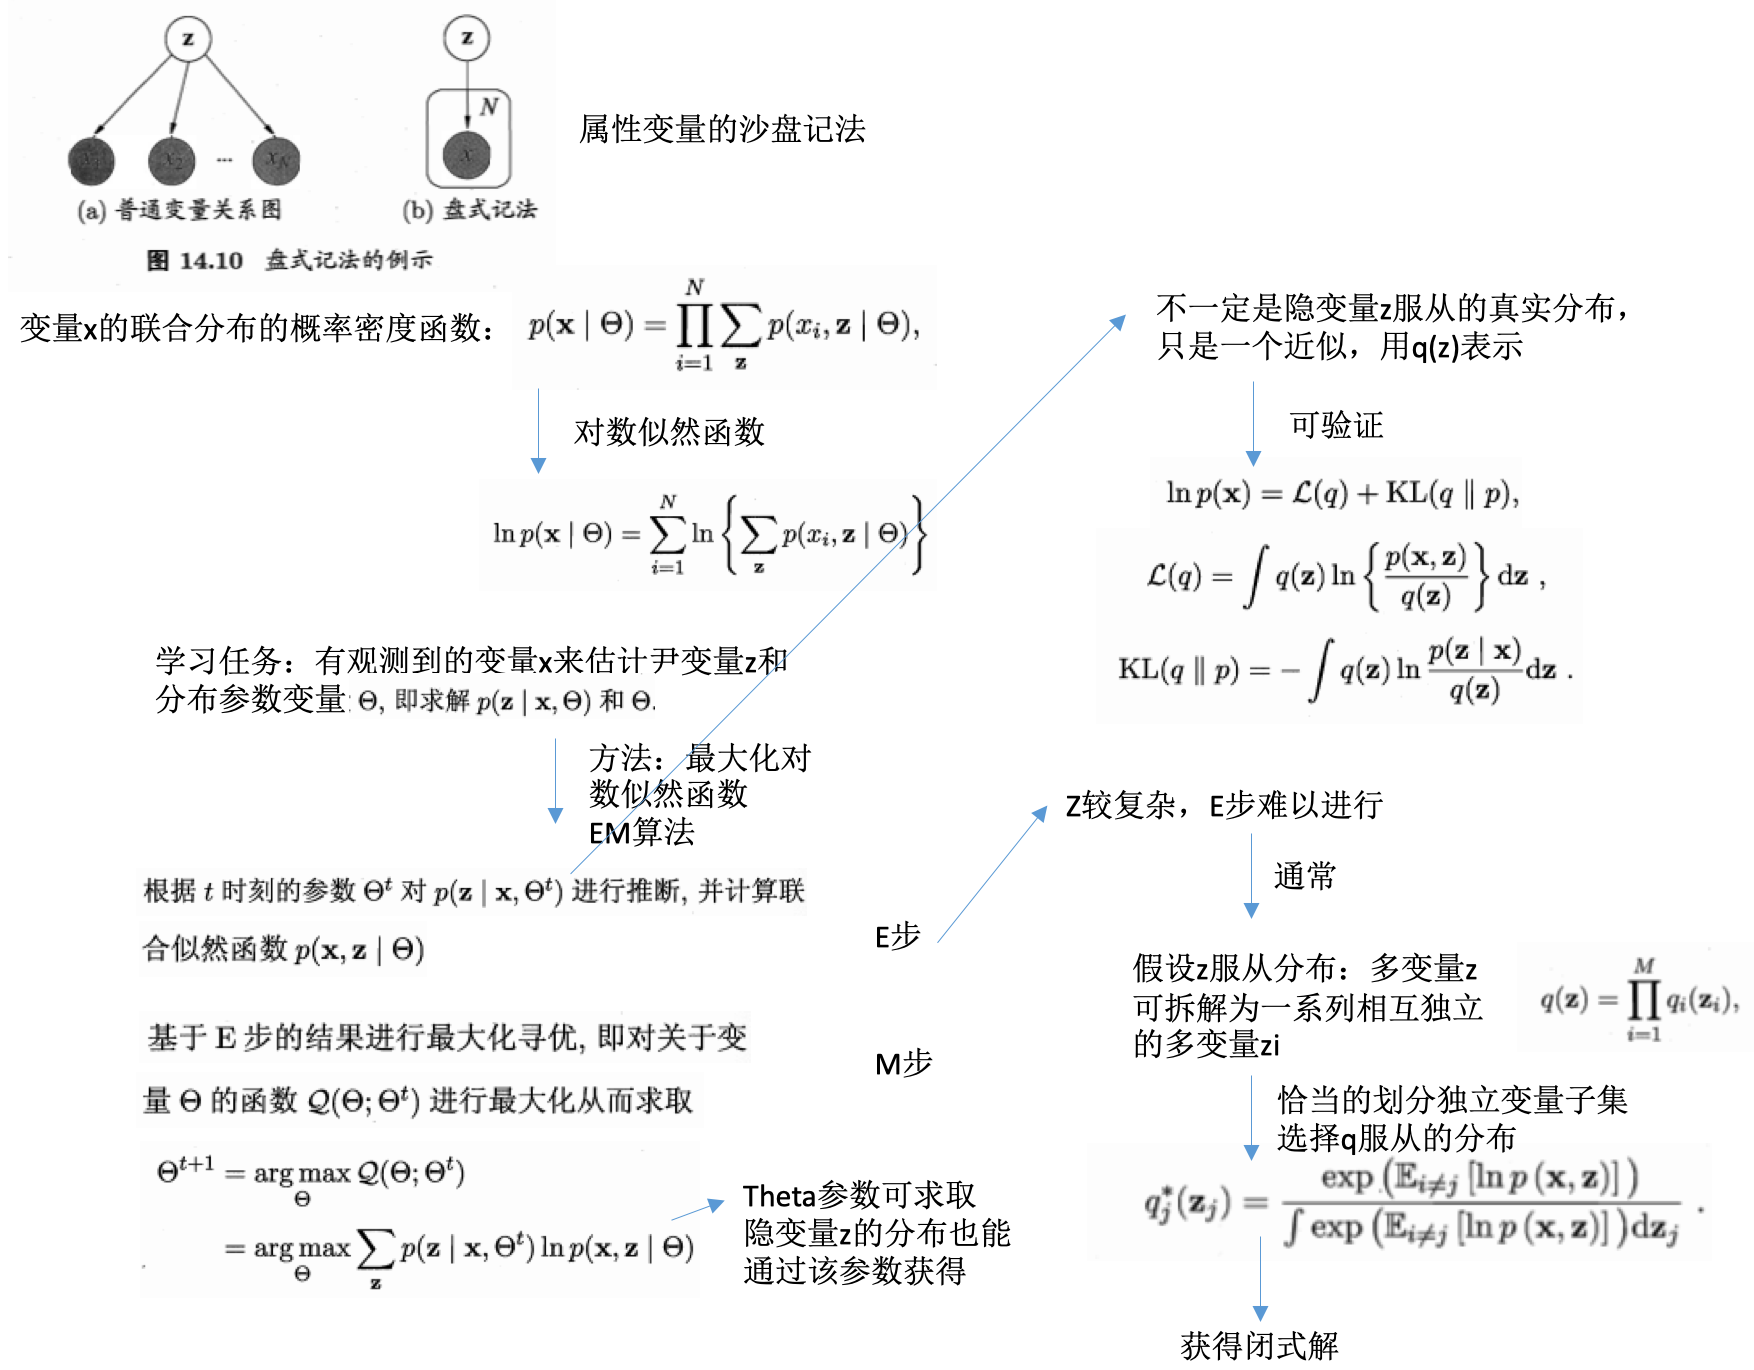
- 盘式记法:
- plate notation
- 概率图模型的一种简洁表示方法
- 隐变量分解及假设分布:
- 关键:
- 如何对隐变量进行拆解
- 假设各变量子集服从何种分布
- 两者确定后,即可套用上式的结论,结合EM算法进行概率图模型的推断和参数估计
- 若果隐变量的拆解或分布假设不恰当,会导致效率低、效果差
话题模型
- 话题模型:
- 一族生成式有向图模型
- 处理离散的数据,文本集合、信息检索、自然语言处理
- 隐狄利克雷分配模型LDA:典型代表,latent dirichlet allocation
- 词:
- word
- 待处理数据的基本离散单元
- 文本处理:一个词就是一个英文单词
- 文档:
- document
- 待处理的数据对象
- 由一组词组成
- 词在文档中不计顺序
- 一篇文章、网页等
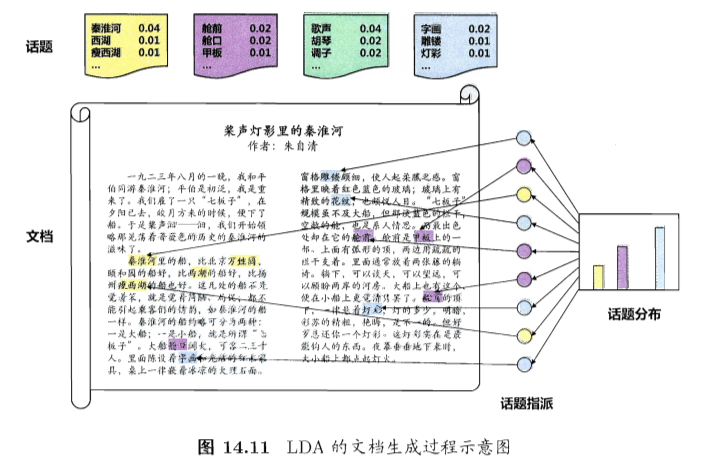
- 话题:
- topic
- 表示一个概念
- 具体表示为一系列相关的词,以及他们在该概念下出现的概率
- LDA生成过程:
- 现实任务:
- 统计可获得词频向量,但是不知道谈论哪些话题,不知道每篇文档与哪些话题有关
- LDA:
- 生成式模型的角度看待文档和话题
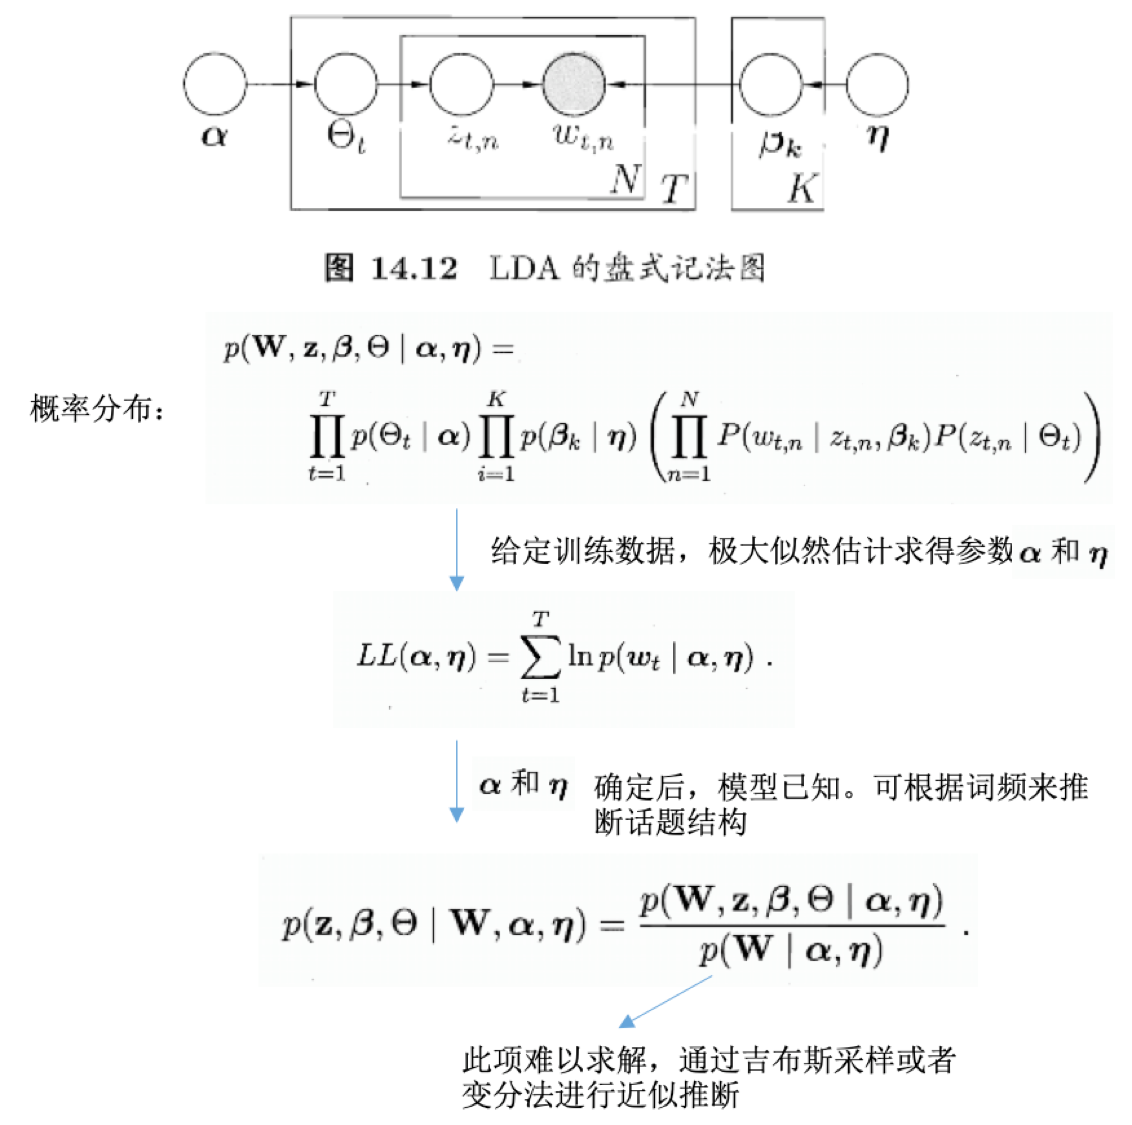
- 每篇文档包含多个话题:\(\Theta_{t,k}\)表示文档t中包含话题k的比例,进而通过下面的步骤由话题生成文档t:
- 根据参数为\(\alpha\)的狄利克雷分布随机采样一个话题分布\(\Theta_t\)
- 按如下步骤生成文档中的N个词:
- 根据\(\Theta_t\)进行话题指派,得到文档t中词n的话题\(z_{t,n}\)
- 根据指派的话题所对应的词频分布\(\beta_k\)随机采样生成词
- 示例:这个post举了一个例子,在python中如何进行LDA分析,这里是重新跑的notebook:
- 目标:分析1987-2016年间发表在NIPS上的文章的文本内容(共6560篇文档),获取话题
-
工具:sklearn(CountVectorizer统计文本、LatentDirichletAllocation进行LDA分析),pyLDAvis模块进行话题结果的可视化
- 问题:
- 【1】文本的前期处理不够干净,比如通过词云图,很多无用的符号(et,al,ie,example)是没有去掉的。当然,最后提取的话题的靠前的term也不包含这些。
- 【2】执行的速度有点慢
- 【3】这里直接指定的话题数目是5,没有采用评估量作为依据进行挑选(说会在后续的post给出)
- 【4】如何基于话题结果对每篇文章assign类型?
- 【5】跑出来的结果不太一样,比如其topic 0是:”model learning network neural figure time state networks using image “,但我这里是”learning data algorithm function set training problem 10 error kernel“。随机数的设定。
参考
- 机器学习周志华第14章
Read full-text »
Softmax function
2019-01-02
目录
概念
softmax函数(归一化的指数函数):”squashes”(maps) a K-dimensional vector z of arbitrary real values to a K-dimensional vector σ(z) of real values in the range (0, 1) that add up to 1 (from wiki)。
- 向量原来的每个值都转换为指数的概率值:\(\sigma(z)_{j}=\frac{e^{z_{j}}}{\sum^{K}_{k=1}e^{z_{k}}}\)。
- 转换后的值是个概率值,在[0,1]之间;
- 转换后的向量加和为1。
- 下面是用代码举例子说明是怎么计算的:
-
>>> import math
>>> z = [1.0, 2.0, 3.0, 4.0, 1.0, 2.0, 3.0]
>>> z_exp = [math.exp(i) for i in z]
>>> sum_z_exp = sum(z_exp)
>>> softmax = [i / sum_z_exp for i in z_exp]
>>> print([round(i, 3) for i in softmax])
[0.024, 0.064, 0.175, 0.475, 0.024, 0.064, 0.175]
应用
- 神经网络的多分类问题,作为最后一层(输出层),转换为类别概率,如下图所示,但是这个图里面
e的下标k应该写错了位置,k应该是z的下标(一般最后基于概率值有一个独热编码,对应具体的类别):
- 将某个值转换为激活概率,比如增强学习领域,此时的其公式为:\(P_{t}(a)=\frac{e^{\frac{q_{t}(a)}{T}}}{\sum^{n}_{i=1}e^{\frac{q_{t}(i)}{T}}}\)
softmax vs logistic
- 参考这里:logistic函数和softmax函数
- logistic: 二分类问题,基于多项式分布
- softmax:多分类问题,基于伯努利分布
- 因此logistic是softmax函数的一个特例,就是当K=2时的情况。所以在逻辑回归那里,也有softmax regression(多元逻辑回归)用于多分类问题,我在这里也记录了一点。
- 在多分类里面,也可以使用多个one-vs-all的逻辑回归,达到多元回归的目的,这种操作和直接的softmax回归有什么不同?softmax回归输出的类是唯一互斥的,但是多个逻辑回归的输出类别不一定是互斥的。
Read full-text »
sklearn: 教程
2018-12-30
目录
1. 机器学习简介
问题设置
- 考虑一系列数据,预测未知数据的属性
- 样本是多个属性的数据,则说有许多属性或者特征
- 监督学习:数据带有想要预测的结果值属性
- 分类
- 回归
- 无监督学习:数据是没有任何目标值的一组输入向量组成
- 聚类:发现数据中彼此类似的示例
- 密度估计:确定输入空间内的数据分布
- 降维:将高维数据投射到二维或者三位进行可视化
- 训练集:从中学习数据的属性
- 测试集:测试学习到的性质
加载示例数据集
具体参考sklearn: 数据集加载
>>> from sklearn import datasets
>>> iris = datasets.load_iris()
>>> digits = datasets.load_digits()

>>> print(digits.data)
>>> digits.target
学习和预测
- 基于训练数据,拟合一个估计器,预测未知的数据所属类别
>>> from sklearn import svm

# 设置
>>> clf = svm.SVC(gamma=0.001, C=100.)

# 学习
>>> clf.fit(digits.data[:-1], digits.target[:-1])

# 预测
>>> clf.predict(digits.data[-1:])
模型保存和加载
>>> import pickle

# 保存
>>> s = pickle.dumps(clf)

# 重新加载
>>> clf2 = pickle.loads(s)

# 预测新数据
>>> clf2.predict(X[0:1])
array([0])
>>> y[0]
0
再次训练和更新参数
- 同一个估计器,如果多次被调用,超参数存在更新,那么训练的到的模型也会被更新
>>> import numpy as np
>>> from sklearn.datasets import load_iris
>>> from sklearn.svm import SVC
>>> X, y = load_iris(return_X_y=True)

# 第一次训练,得到一个模型
>>> clf = SVC()
>>> clf.set_params(kernel='linear').fit(X, y)
SVC(C=1.0, cache_size=200, class_weight=None, coef0=0.0,
  decision_function_shape='ovr', degree=3, gamma='auto_deprecated',
  kernel='linear', max_iter=-1, probability=False, random_state=None,
  shrinking=True, tol=0.001, verbose=False)
>>> clf.predict(X[:5])
array([0, 0, 0, 0, 0])

# 第二次训练,得到一个模型
# 直接指定模型需要更改的超参数
>>> clf.set_params(kernel='rbf', gamma='scale').fit(X, y)
SVC(C=1.0, cache_size=200, class_weight=None, coef0=0.0,
  decision_function_shape='ovr', degree=3, gamma='scale', kernel='rbf',
  max_iter=-1, probability=False, random_state=None, shrinking=True,
  tol=0.001, verbose=False)
>>> clf.predict(X[:5])
array([0, 0, 0, 0, 0])
多分类和多标签拟合
如果预测的y是属于多类别的,比如有0,1,2三种类别,有两种方式进行预测:
- 一种是直接预测类别,输出为0,1,2其中的一个(也就是一种类别)
- 一种是先对y进行二值化(one-hot),比如这里就是一个1x3的数组
>>> from sklearn.svm import SVC
>>> from sklearn.multiclass import OneVsRestClassifier
>>> from sklearn.preprocessing import LabelBinarizer

# 直接预测,每个样本是某一类
>>> X = [[1, 2], [2, 4], [4, 5], [3, 2], [3, 1]]
>>> y = [0, 0, 1, 1, 2]

# 先对y进行二值化编码,预测值是二值编码的形式
>>> classif = OneVsRestClassifier(estimator=SVC(random_state=0))
>>> classif.fit(X, y).predict(X)
array([0, 0, 1, 1, 2])

>>> y = LabelBinarizer().fit_transform(y)
>>> classif.fit(X, y).predict(X)
array([[1, 0, 0],
       [1, 0, 0],
       [0, 1, 0],
       [0, 0, 0],  # 这里为0,表示预测的结果不匹配训练集合的任一标签
       [0, 0, 0]])
类似的,多标签的(一个样本属于多个类别,比如一个图片同时包含猫和狗)也可以先对y进行标签化,再训练预测:
>> from sklearn.preprocessing import MultiLabelBinarizer
>> y = [[0, 1], [0, 2], [1, 3], [0, 2, 3], [2, 4]]
>> y = MultiLabelBinarizer().fit_transform(y)
>> classif.fit(X, y).predict(X)
array([[1, 1, 0, 0, 0],
       [1, 0, 1, 0, 0],
       [0, 1, 0, 1, 0],
       [1, 0, 1, 1, 0],
       [0, 0, 1, 0, 1]])
# 这里有0-4共5个类别,所以是一个1x5的数组
# 如果某个样本属于多个类别,相应类别值为1
2. 统计学习:监督学习
k近邻分类器
维度惩罚(curse of dimensionality)
- 高维情形下出现的数据样本稀疏,距离计算困难(算法的空间可能复杂度指数上升)等问题
- 解决方法一般是降维和特征选择,常见的降维方法有PCA,embedding等
线性回归
- 最简单的拟合线性模型形式,是通过调整数据集的一系列参数令残差平方和尽可能小
稀疏
分类
支持向量机
- 判别模型
- 找到样例的一个组合来构建一个两类之间最大化的平面
- 参数C:正则化
使用核
- 特征空间内,数据不总是线性可分的
- 多项式或者非线性的进行拟合
3. 统计学习:模型选择
交叉验证
网格搜索
4. 统计学习:无监督学习
聚类
- kmeans聚类:结果不能完全对应真实情况
- 合适的聚类数量难以选取
- 初始化值的敏感性,陷入局部最优
分层聚类:慎用
- Agglomerative(聚合) - 自底向上的方法: 初始阶段,每一个样本将自己作为单独的一个簇,聚类的簇以最小化距离的标准进行迭代聚合。当感兴趣的簇只有少量的样本时,该方法是很合适的。如果需要聚类的 簇数量很大,该方法比K_means算法的计算效率也更高。
- Divisive(分裂) - 自顶向下的方法: 初始阶段,所有的样本是一个簇,当一个簇下移时,它被迭代的进 行分裂。当估计聚类簇数量较大的数据时,该算法不仅效率低(由于样本始于一个簇,需要被递归的进行 分裂),而且从统计学的角度来讲也是不合适的。
特征聚集
- 合并相似的维度(特征)
分解:PCA、ICA
- 提取数据的主要成分
5. 利用管道把所有的放在一起
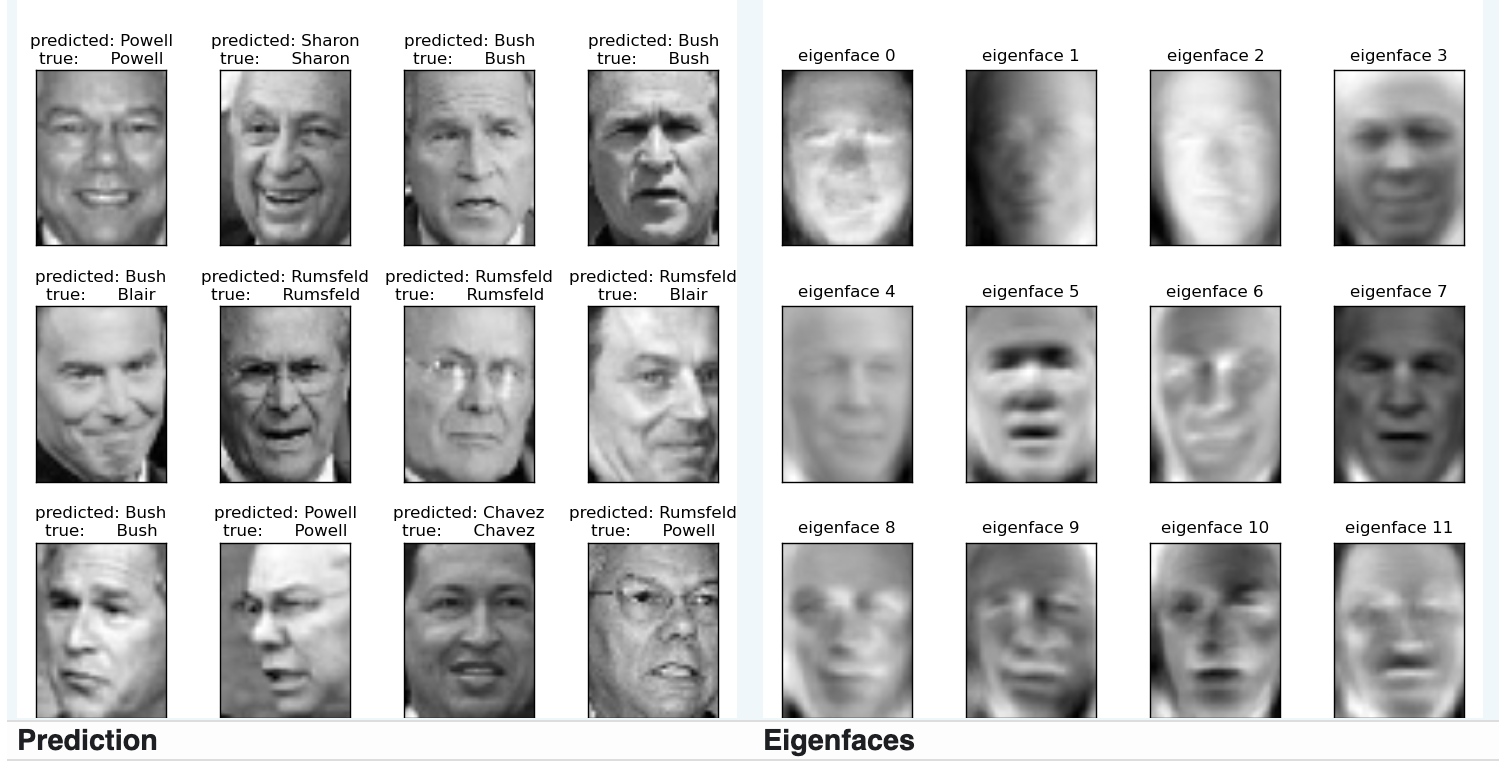
这个是使用面部特征进行人脸识别的例子:
"""
===================================================
Faces recognition example using eigenfaces and SVMs
===================================================

The dataset used in this example is a preprocessed excerpt of the
"Labeled Faces in the Wild", aka LFW_:

  http://vis-www.cs.umass.edu/lfw/lfw-funneled.tgz (233MB)

.. _LFW: http://vis-www.cs.umass.edu/lfw/

Expected results for the top 5 most represented people in the dataset:

================== ============ ======= ========== =======
                   precision    recall  f1-score   support
================== ============ ======= ========== =======
     Ariel Sharon       0.67      0.92      0.77        13
     Colin Powell       0.75      0.78      0.76        60
  Donald Rumsfeld       0.78      0.67      0.72        27
    George W Bush       0.86      0.86      0.86       146
Gerhard Schroeder       0.76      0.76      0.76        25
      Hugo Chavez       0.67      0.67      0.67        15
       Tony Blair       0.81      0.69      0.75        36

      avg / total       0.80      0.80      0.80       322
================== ============ ======= ========== =======

"""
from time import time
import logging
import matplotlib.pyplot as plt

from sklearn.model_selection import train_test_split
from sklearn.model_selection import GridSearchCV
from sklearn.datasets import fetch_lfw_people
from sklearn.metrics import classification_report
from sklearn.metrics import confusion_matrix
from sklearn.decomposition import PCA
from sklearn.svm import SVC


print(__doc__)

# Display progress logs on stdout
logging.basicConfig(level=logging.INFO, format='%(asctime)s %(message)s')


# #############################################################################
# Download the data, if not already on disk and load it as numpy arrays

lfw_people = fetch_lfw_people(min_faces_per_person=70, resize=0.4)

# introspect the images arrays to find the shapes (for plotting)
n_samples, h, w = lfw_people.images.shape

# for machine learning we use the 2 data directly (as relative pixel
# positions info is ignored by this model)
X = lfw_people.data
n_features = X.shape[1]

# the label to predict is the id of the person
y = lfw_people.target
target_names = lfw_people.target_names
n_classes = target_names.shape[0]

print("Total dataset size:")
print("n_samples: %d" % n_samples)
print("n_features: %d" % n_features)
print("n_classes: %d" % n_classes)


# #############################################################################
# Split into a training set and a test set using a stratified k fold

# split into a training and testing set
X_train, X_test, y_train, y_test = train_test_split(
    X, y, test_size=0.25, random_state=42)


# #############################################################################
# Compute a PCA (eigenfaces) on the face dataset (treated as unlabeled
# dataset): unsupervised feature extraction / dimensionality reduction
n_components = 150

print("Extracting the top %d eigenfaces from %d faces"
      % (n_components, X_train.shape[0]))
t0 = time()
pca = PCA(n_components=n_components, svd_solver='randomized',
          whiten=True).fit(X_train)
print("done in %0.3fs" % (time() - t0))

eigenfaces = pca.components_.reshape((n_components, h, w))

print("Projecting the input data on the eigenfaces orthonormal basis")
t0 = time()
X_train_pca = pca.transform(X_train)
X_test_pca = pca.transform(X_test)
print("done in %0.3fs" % (time() - t0))


# #############################################################################
# Train a SVM classification model

print("Fitting the classifier to the training set")
t0 = time()
param_grid = {'C': [1e3, 5e3, 1e4, 5e4, 1e5],
              'gamma': [0.0001, 0.0005, 0.001, 0.005, 0.01, 0.1], }
clf = GridSearchCV(SVC(kernel='rbf', class_weight='balanced'),
                   param_grid, cv=5, iid=False)
clf = clf.fit(X_train_pca, y_train)
print("done in %0.3fs" % (time() - t0))
print("Best estimator found by grid search:")
print(clf.best_estimator_)


# #############################################################################
# Quantitative evaluation of the model quality on the test set

print("Predicting people's names on the test set")
t0 = time()
y_pred = clf.predict(X_test_pca)
print("done in %0.3fs" % (time() - t0))

print(classification_report(y_test, y_pred, target_names=target_names))
print(confusion_matrix(y_test, y_pred, labels=range(n_classes)))


# #############################################################################
# Qualitative evaluation of the predictions using matplotlib

def plot_gallery(images, titles, h, w, n_row=3, n_col=4):
    """Helper function to plot a gallery of portraits"""
    plt.figure(figsize=(1.8 * n_col, 2.4 * n_row))
    plt.subplots_adjust(bottom=0, left=.01, right=.99, top=.90, hspace=.35)
    for i in range(n_row * n_col):
        plt.subplot(n_row, n_col, i + 1)
        plt.imshow(images[i].reshape((h, w)), cmap=plt.cm.gray)
        plt.title(titles[i], size=12)
        plt.xticks(())
        plt.yticks(())


# plot the result of the prediction on a portion of the test set

def title(y_pred, y_test, target_names, i):
    pred_name = target_names[y_pred[i]].rsplit(' ', 1)[-1]
    true_name = target_names[y_test[i]].rsplit(' ', 1)[-1]
    return 'predicted: %s\ntrue:      %s' % (pred_name, true_name)

prediction_titles = [title(y_pred, y_test, target_names, i)
                     for i in range(y_pred.shape[0])]

plot_gallery(X_test, prediction_titles, h, w)

# plot the gallery of the most significative eigenfaces

eigenface_titles = ["eigenface %d" % i for i in range(eigenfaces.shape[0])]
plot_gallery(eigenfaces, eigenface_titles, h, w)

plt.show()
6. 正确选择评估器

参考
Read full-text »
Latest articles
Links
- ZhangLab , RISE database , THU life , THU info
- Data analysis: pandas , numpy , scipy
- ML/DL: sklearn , sklearn(中文) , pytorch
- Visualization: seaborn , matplotlib , gallery
- Github: me


