[CS229] 10: Advice for applying machine learning techniques
2018-11-17
10: Advice for applying machine learning techniques
- 算法debug:
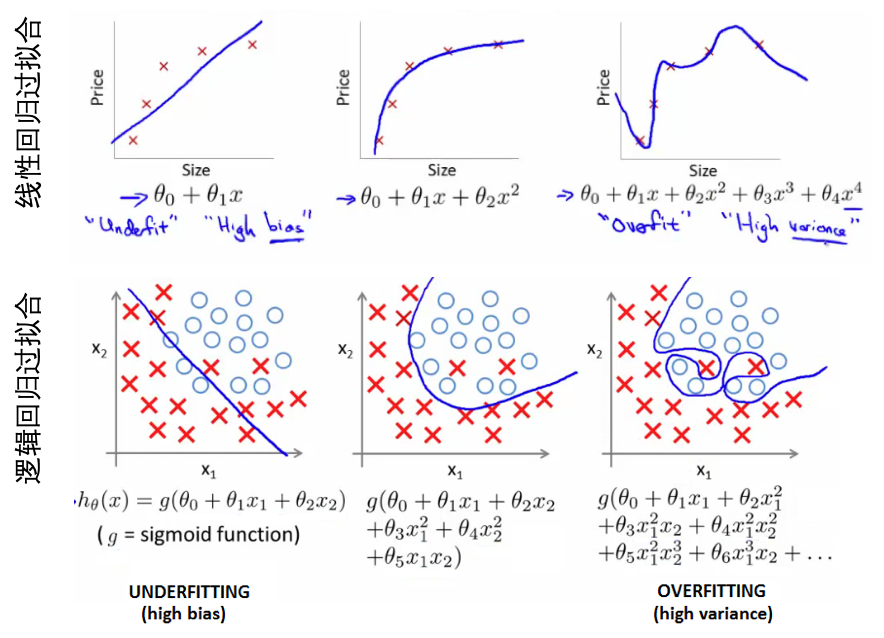
- 更多的训练样本 =》fix high variance(underfit)
- 减少特征数量 =》fix high variance
- 获得额外的特征 =》fix high bias(overfit)
- 增加高维(组合)特征 =》fix high bias
- 增大 lambda =》fix high bias
- 减小 lambda =》fix high variance
- 机器学习诊断:
- 算法在什么样问题是work的或者不work的
- 需要耗时构建
- 指导提高模型的性能
- 模型评估:
- 训练集效果好(错误低),但是不能很好的在新数据集上。可能存在过拟合,低维(二维)可以直接画,但是对于多维数据不合适。
- 分训练集和测试集,训练集构造模型,在测试集上预测,评估模型效果。
- 模型选择:
- 对于不同的模型,构建训练集+验证集+测试集,前两者用于构建模型,测试集计算错误评估效果
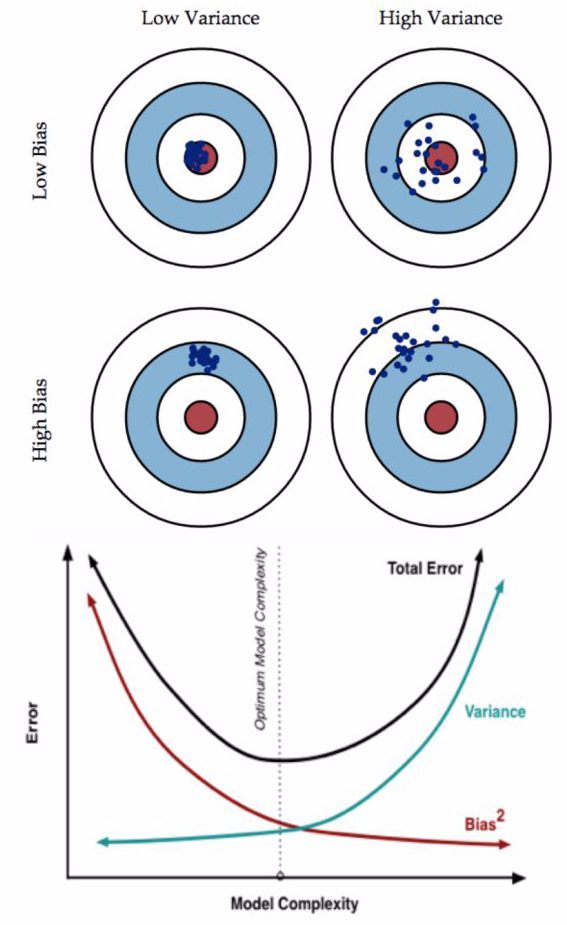
- 模型高偏差(bias)还是高差异(variance):
- high bias:underfit,比如在训练集和验证集上错误都很高,且两者很接近。
- high variance:overfit,比如在训练集上错误很低,但是在验证集上错误很高。
- 正则化与bias、variance:
- 正则化参数:lambda(平衡模型的性能和复杂度)
- 小的lambda,模型很复杂,可能会overfit,high variance
- 大的lambda,效果不很好,可能是underfit,high bias
- 选择不同的lambda值,起到正则化的效果,控制模型的复杂度。用训练集、验证集和测试集的错误值,选取合适的lambda值。
- 学习曲线(learning curve):
- 根据学习曲线判断如何提高模型的效果
- 学习曲线: 样本数量 vs 模型在训练集和验证集上的错误(error)
- 如果是模型high bias(underfit),训练集的误差随样本量增大逐渐增大到平稳,验证集的误差随样本量增大逐渐减小到平稳。【用更多的训练数据不会提升效果】
- 如果模型是high variance(overfit),【用更多的训练数据会提升效果】
- 神经网络和过拟合:
- 小网络:少的参数,容易欠拟合
- 大网络:多的参数,容易过拟合(模型太复杂,不易推广到新的数据)
- 大网络的过拟合可解决方式:正则化
- 知乎:Bias(偏差),Error(误差),和Variance(方差):
Read full-text »
[CS229] 09: Neural Networks - Learning
2018-11-13
09: Neural Networks - Learning
- 神经网络分类问题:
- 二分类:输出为0或1
- 多分类:比如有k个类别,则输出一个向量(长度为k,独热编码表示)
- 损失函数:类比逻辑回归的损失函数
- 逻辑回归的损失函数(对数损失+权重参数的正则项):

- 神经网络的损失函数:
- 注意1:输出有k个节点,所以需要对所有的节点进行计算
- 注意2:第一部分,所有节点的平均逻辑对数损失
- 注意3:第二部分,正则和(又称为weight decay),只不过是所有参数的

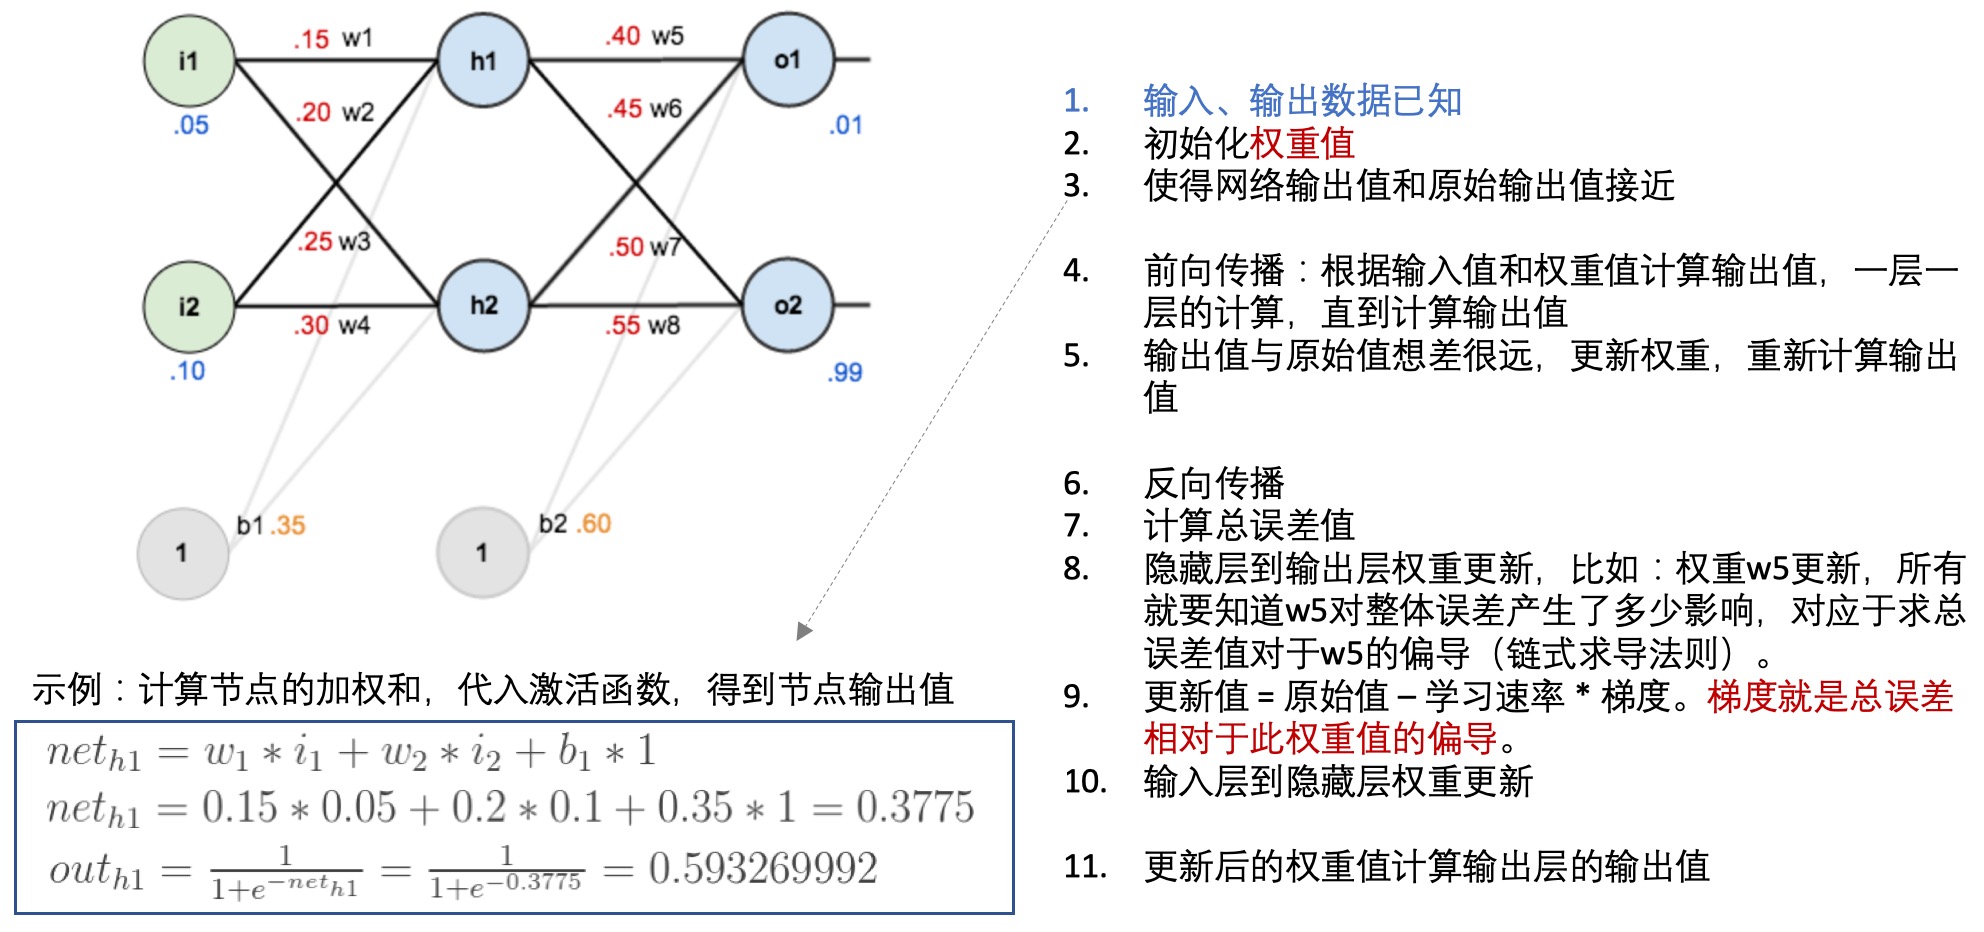
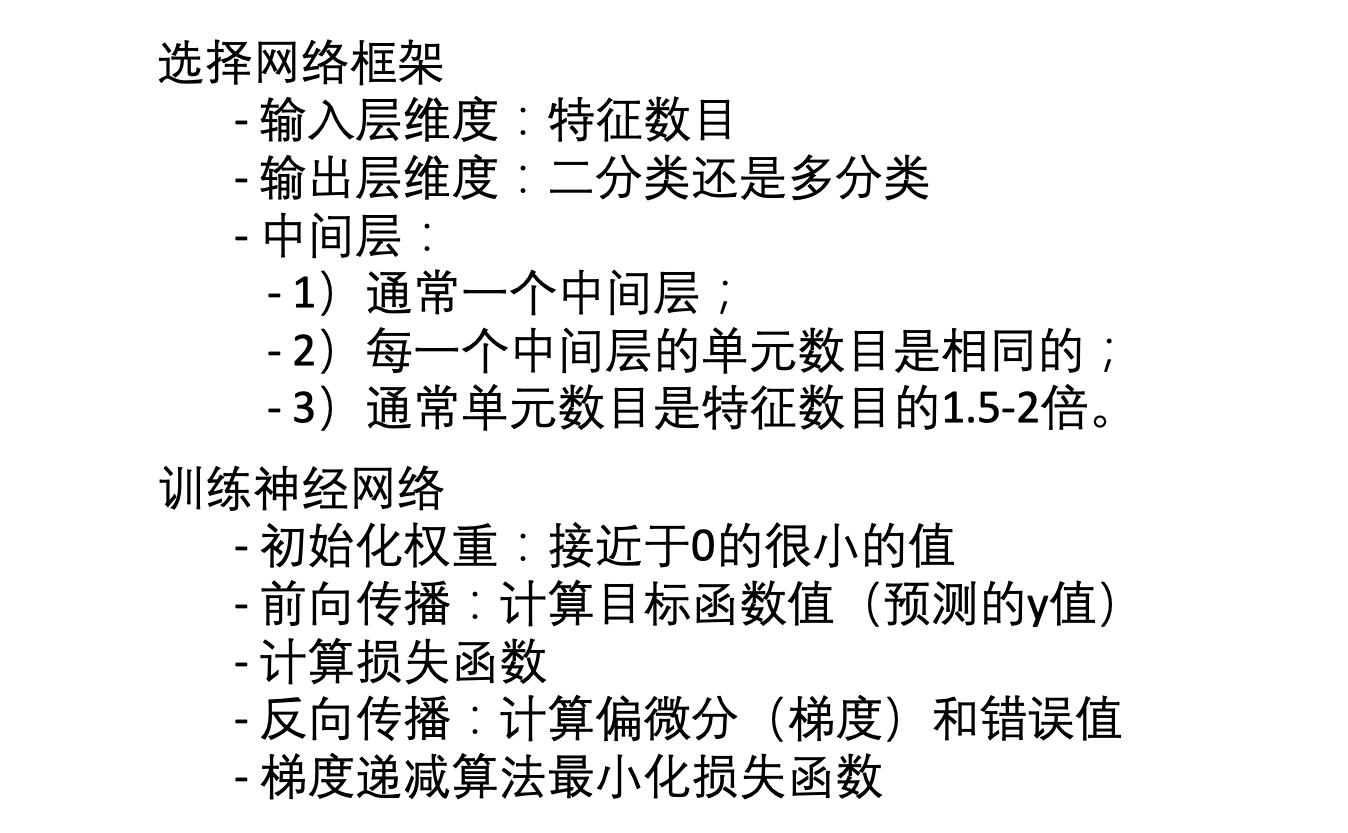
- 前向传播(forward propagation):
- 训练样本、结果已知
- 每一层的权重可以用theta向量表示,这也是需要确定优化的参数
- 每一层的激活函数已知
- 就可以根据以上的数据和参数一层一层的计算每个节点的值,并与已知的值进行比较,构建损失函数
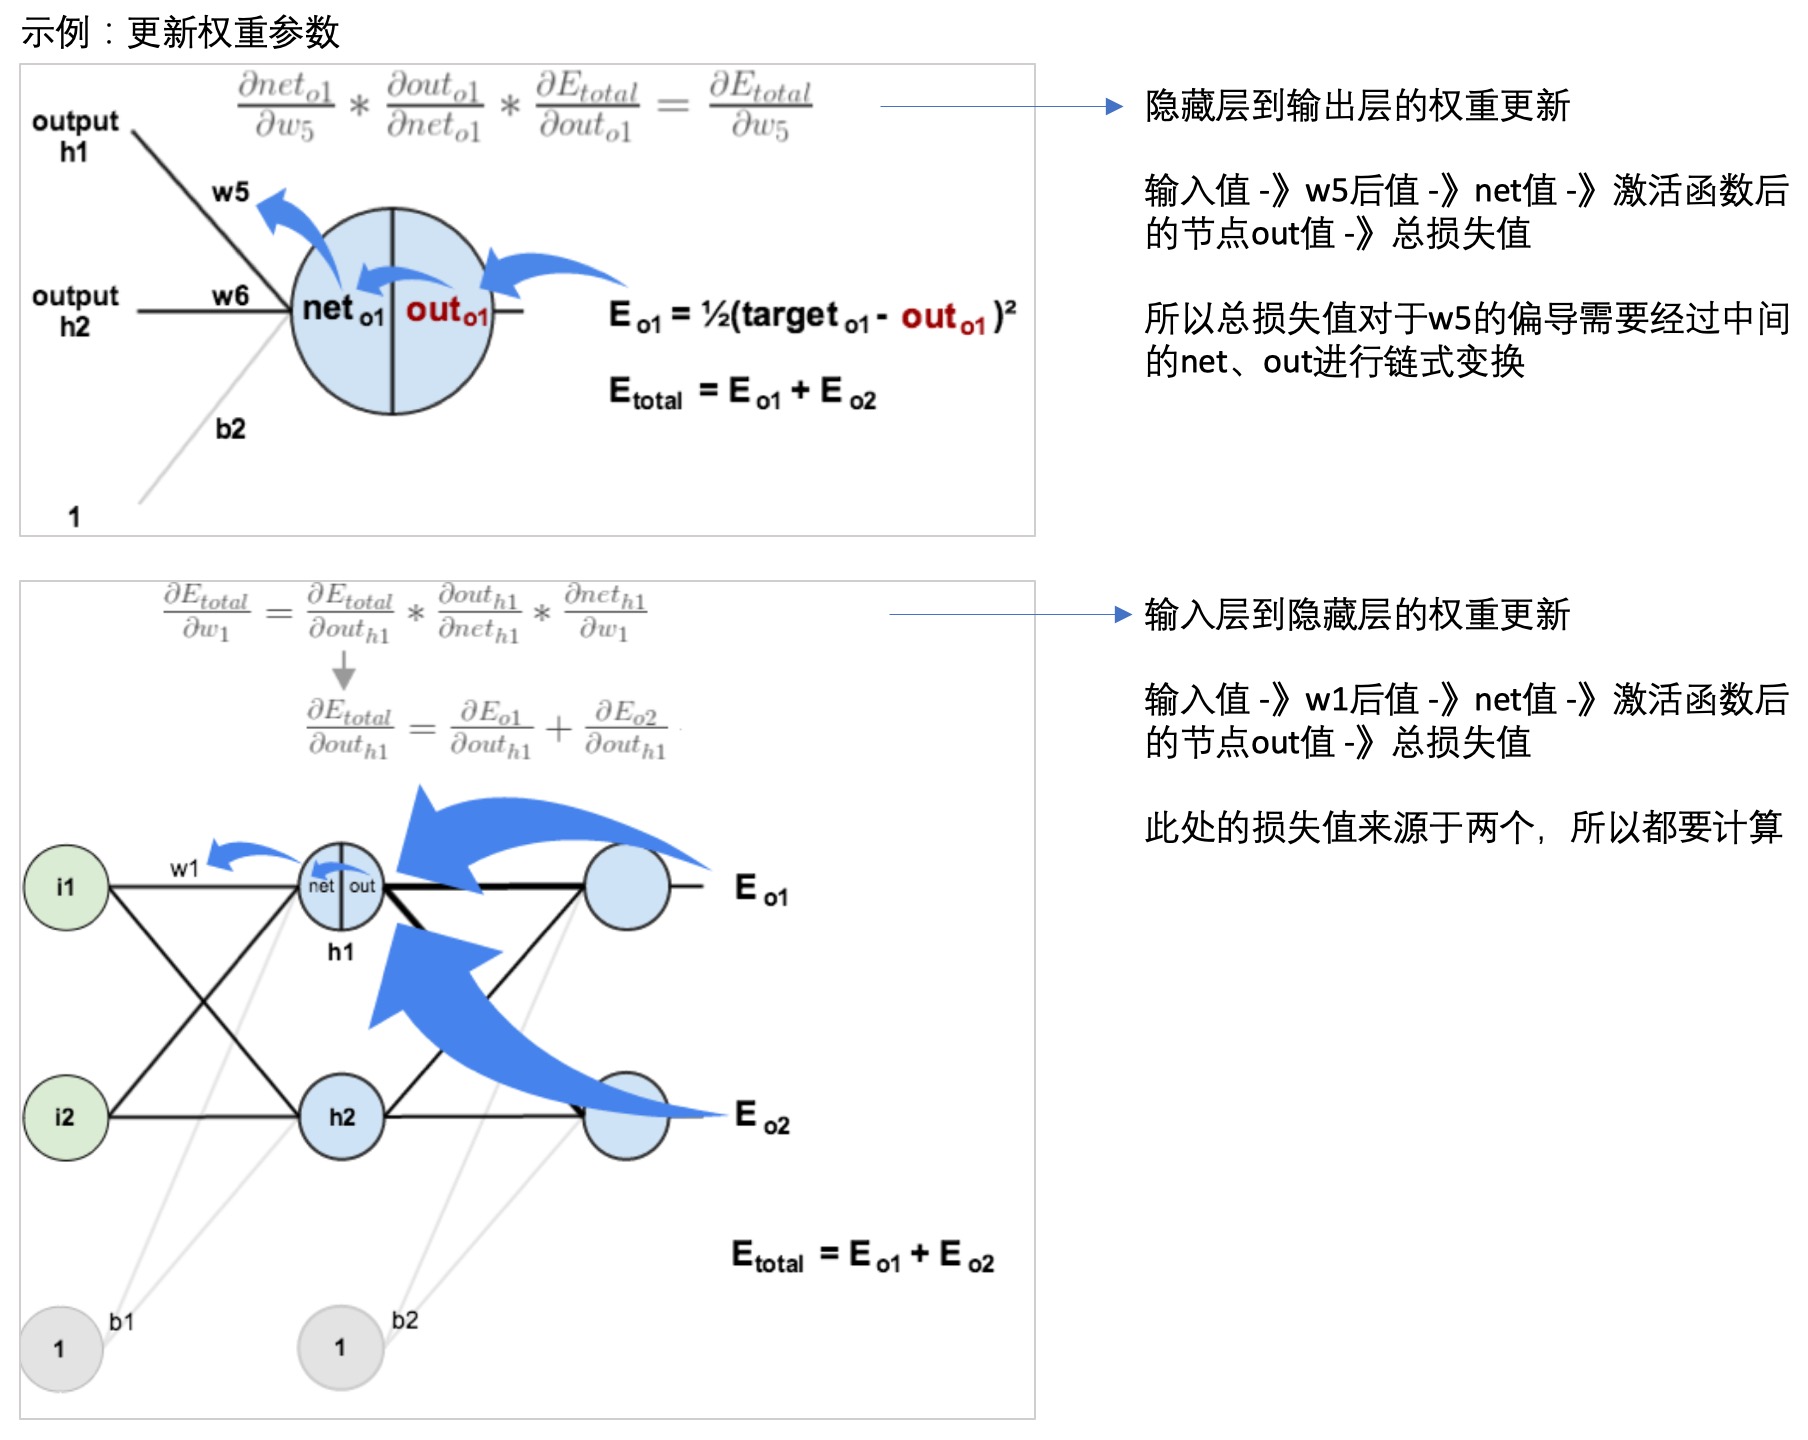
- 反向传播(back propagation):
- 每一层的每个节点都会计算出一个值,但是这个值与真实值是有差异的,因此可以计算每个节点的错误。
- 但是每个节点的真实值我们是不知道的,只知道最后的y值(输出值),因此需要从最后的输出值开始计算。
- 这个文章: 一文弄懂神经网络中的反向传播法——BackPropagation通过一个简单的3层网络的计算,演示了反向传播的过程,可以参考一下:
- 神经网络学习:
Read full-text »
神经网络
2018-11-11
目录
神经元模型
- 神经网络:由具有适应性的简单单元组成的广泛并行互联的网络,它的组织能够模拟生物神经系统对真实世界所做出的交互反应。【Kohonen,1988】
- 基本成员:神经元模型
- 兴奋时,会向其他相连的神经元发送化学物质,而改变这些神经元的电位。
- 如果某神经元的电位超过了一个阈值,那么就被激活,处于兴奋状态,向其他神经元发送化学物质。
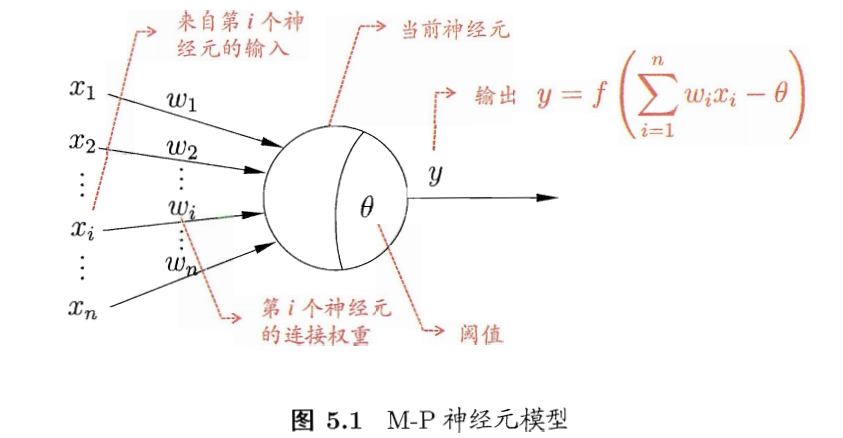
- M-P神经元模型:
- 激活函数
- 理想的:阶跃函数,将信号输出为1(兴奋)或者0(抑制)
- 阶跃函数:不连续,不光滑
- 实际使用Sigmoid函数,将输入值挤压到(0,1),也称挤压函数。

感知机与多层网络
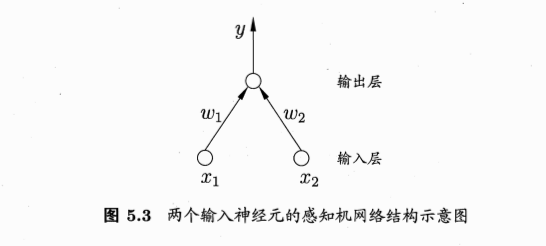
感知机
感知机的线性组合:aggregation
- 把许多感知机线性组合起来
- 得到的G也是一个感知机模型
- 包含两层权重:输入层到隐藏层的权重\(w_t\),隐藏层到输出层的权重\(\alpha\)
- 包含两层sign函数:注意是两层,隐藏层的转换有一层,最后输出层的转换也有一层

线性组合的感知机可实现非线性边界计算
- 例子:两个感知机线性组合实现逻辑AND运算
- g1,g2取值为{-1,1}
- G(x) = sign(-1 + g1(x) + g2(x))
- g1=-1,g2=-1,则G(x)=0
- g1=-1,g2=1,则G(x)=0
- g1=1,g2=-1,则G(x)=0
- g1=1,g2=1,则G(x)=1
- 所以只有当g1和g2均取正值1时,组合的G才取正值1

感知机越多越好?
多层功能神经元: multi-layer
单层感知机线性组合的局限:
单层扩展到多层,解决异或问题
- XOR的拆分:\(XOR(g_1,g_2) = OR(AND(-g_1, g_2), AND(g_1, -g_2))\)
- 拆分的结果显示,本身异或操作就是两次转换:第一层的AND,第二层的OR
- 对应的感知机模型:

多层神经网络:
- 感知机:简单
- 感知机的线性组合aggregation:powerful,能解决部分非线性问题
- 多层前馈神经网络(multi-layer feedforward neural networks):more powerful
输出层:
中间层:
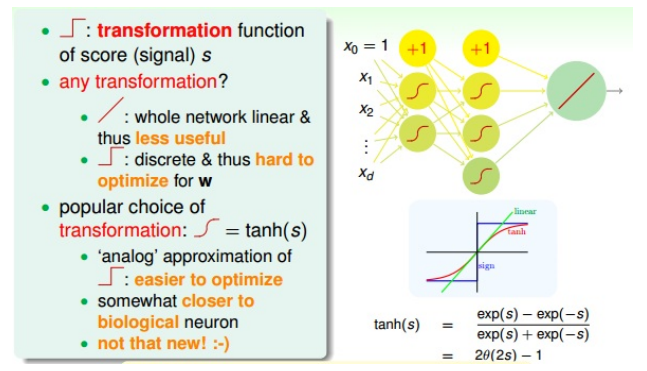
- 中间层,每层有神经元
- 不使用线性函数做变化。如果每个神经元(节点)都是进行线性运算,那么通过线性组合的神经网络模型也必然是线性的。这跟直接使用一个线性模型没有区别。
- 不使用阶梯函数(sign,非线性)做变换:离散、不处处可导,在优化计算时难处理
- 常使用tanh(s)做变换:\(tanh(s) = \frac{exp(s)-exp(-s)}{exp(s)+exp(-s)}\)
感知机和网络的学习
- 给定训练数据集,权重\(w_i(i=1,2,...,n)\),基于阈值\(\theta\)可通过学习得到
- 阈值\(\theta\)可看做一个固定输入为-1的哑结点(dummy node)所对应的链接权重\(w_{n+1}\),=》权重和阈值的学习统一为权重的学习
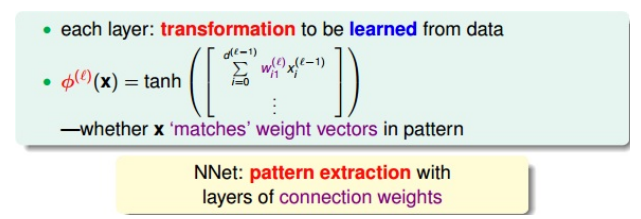
- 学习过程,就是根据训练数据来调整神经元之间的连接院(connection weight)以及每个功能神经元的阈值。(连接权重+阈值 =》统一的权重)
- 学习的核心:pattern extraction,模式提取
误差逆传播算法:BP
- BP算法(error backpropagation):神经网络的学习算法
- BP网络:
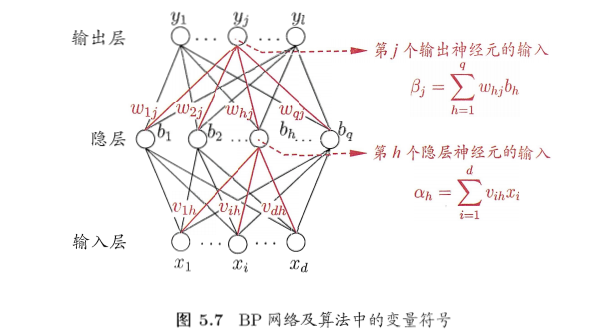
- 参数数目:(d+l+1)q+l,
- 输入层到隐藏层的权重:dxq
- 隐藏层到输出层的权重:qxl
- 隐藏层神经元的阈值:q
- 输出层神经元的阈值:l
- 基于梯度下降策略,以目标的负梯度方向对参数进行调整
- BP流程:

神经网络的过拟合优化
- 如果是SGD:每次迭代更新时只取一个点,会不够稳定。可采用mini-batch的方式,每次选取一些数据,训练然后求平均值更新权重
- 容易过拟合:训练误差持续下降,测试误差上升
- 缓解策略1:早停(early stopping),若训练集误差降低,验证集误差升高,则停止训练。使用验证集进行迭代次数的选取。
- 缓解策略2:正则化,目标函数增加一个描述网络复杂度的部分,比如链接权重和阈值的平方和。
- 熟悉的是L2正则化:\(\Omega=\sum (w_{ij}^{(l)})^2\),但是使得每个权重进行等比例缩小(shrink),大的权重缩小程度大,小的权重缩小程度小,问题:难以得到值为0的权重,而这时我们希望的,如果某些权重为0,则权重是稀疏的,能减少VC demension。
- L1正则化:\(\sum \|w_{ij}^{(l)}\|\),权重的稀疏解。但是绝对值不容易微分。
- 常用的weighted-elimination regularizer:\(\sum \frac{(w_{ij}^{(l)})^2}{1+(w_{ij}^{(l)})^2}\),类似于L2,但是做了尺度的缩小,能使得大的权重和小的权重得到同等程度的缩小,从而让更多的权重为0。

全局最小与局部极小
- 若\(E\)表示神经网络在训练集上的误差,则它是关于连接权重\(w\)和阈值\(\theta\)的函数。参数寻优过程,在参数空间中,寻找一组最优参数使得E最小。
- 最优:
- 跳出局部最小的策略
- 多组不同参数初始化。多个不同的初始点开始搜索,取最小的,可能不陷入局部最小。
- 模拟退化技术。在每一步都以一定的概率接受比当前解更差的结果,从而有助于跳出局部最小。
- 随机梯度下降。不同于标准的梯度下降,随机梯度下降在计算梯度时引入随机因素,有机会跳出局部最小。
- 遗传算法。训练神经玩过更好的逼近全局最小。
其他常见神经网络
RBF网络
- RBF(Radial Basis Function): 径向基函数网络
- 单隐藏层前馈神经网络
- 使用径向基函数作为隐藏层神经元的激活函数
- 输出层是对隐藏层输出的线性组合
- RBF网络表示:\(\phi(x)=\sum_{i=1}^qw_i\rho(x, c_i)\),q隐藏层神经元个数,\(c_i\)第i个神经元对应的中心,\(w_i\)第i个神经元对应的权重
- 训练步骤:
- 1.确定神经元中心\(c_i\),随机采用、聚类等方式
- 2.利用BP算法确定参数\(w_i,\beta_i\)
ART网络
- 竞争型学习:无监督学习策略,输出神经元相互竞争,每一时刻仅有一个竞争获胜的神经元被激活,其他均处于抑制状态(胜者通吃原则:winner-take-all)
- ART(adaptive resonance theory):自适应谐振理论网络。
- 比较层:接收输入样本,传给识别神经元
- 识别层:神经元对应一个模式类
- 识别阈值
- 重置模块
- 可进行增量学习或在线学习
SOM网络
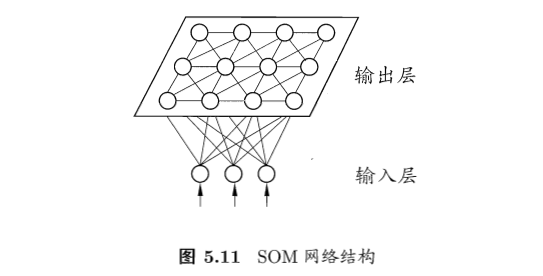
- SOM(self-organizing map):自组织映射网络
- 竞争学习型的无监督神经网络
- 将高维数据映射到低维空间,同时保持高维空间的拓扑结构,即高维空间相似的样本点映射到网络输出层中的邻近神经元
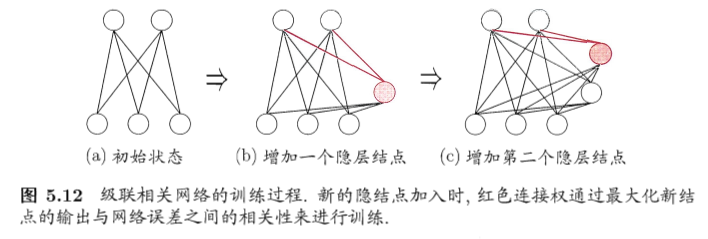
自适应网络:级联相关网络
- 结构自适应网络:网络结构也是学习的目标之一
- 在训练过程中找到最符合数据特点的网络结构
- 代表:级联相关网络(cascade-correlation)
- 优点:
- 无需设置网络层数、隐藏神经元数目
- 训练速度快
- 缺点:
- 数据小时容易过拟合
RNN:Elman网络
- 递归神经网络:网络中可出现环状结构
- 最早的递归神经网络:Elman网络
Boltzmann机
- 能量:为网络状态定义一个能量,最小化时网络最理想,网络训练就是最小化此能量函数
- 基于能量的模型:玻尔兹曼机
参考
- 机器学习周志华第5章
- 林轩田机器学习技法课程学习笔记12 — Neural Network
Read full-text »
[CS229] 08: Neural Networks - Representation
2018-11-09
08: Neural Networks - Representation
- 非线性问题:线性不可分,增加各种特征使得可分。比如根据图片检测汽车(计算机视觉)。当特征空间很大时,逻辑回归不再适用,而神经网络则是一个更好的非线性模型。
- 神经网络:想要模拟大脑(不同的皮层区具有不同的功能,如味觉、听觉、触觉等),上世纪80-90年代很流行,90年达后期开始没落,现在又很流行,解决很多实际的问题。
- 神经网络:
- cell body, input wires (dendrities, 树突), output wire (axon,轴突)
- 逻辑单元:最简单的神经元。一个输入层,一个激活函数,一个输出层。
- 神经网络:激活函数,权重矩阵:
- 输入层,输出层,隐藏层
- ai(j) - activation of unit i in layer j
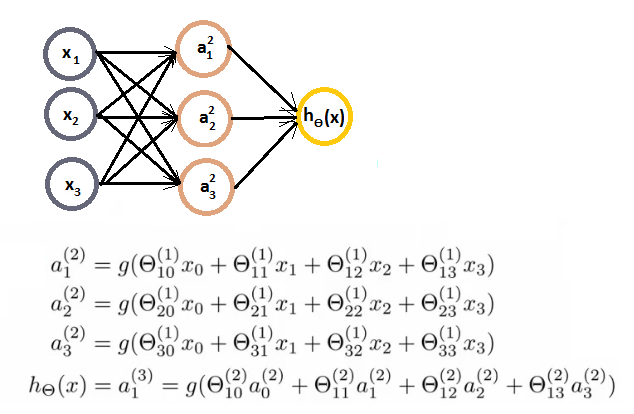
- 前向传播:向量化实现,使用向量表示每一层次的输出。
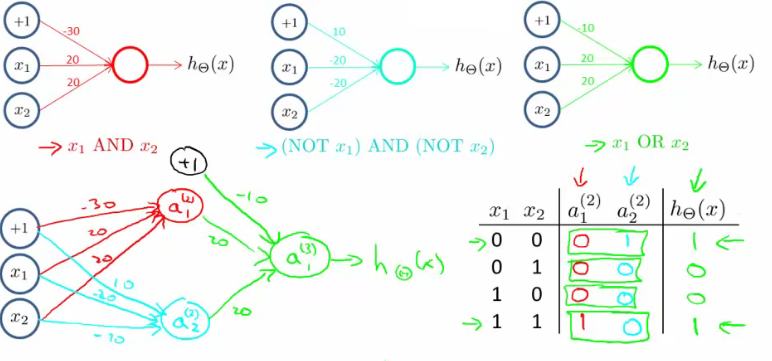
- 使用神经网络实现逻辑符号(逻辑与、逻辑或,逻辑和):
- 实现的是逻辑,而非线性问题,所以神经网络能很好的用于非线性问题上。
- 下面的是实现 XNOR (NOT XOR):
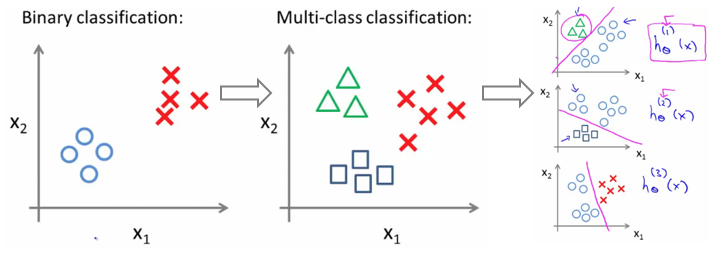
- 多分类问题:one-vs-all
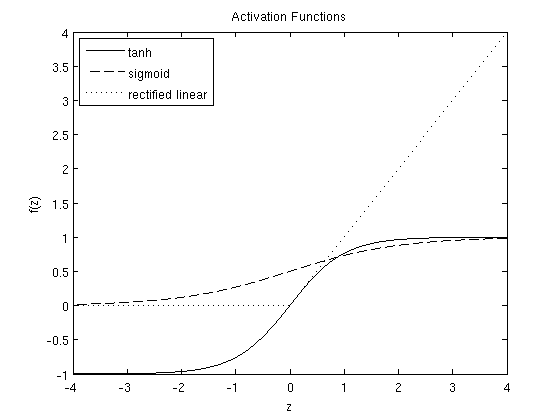
- 常见的激活函数:
- sigmoid: \(f(z) = \frac{1}{1+\exp(-z)}\)
- tanh (hyperbolic tangent): \(f(z) = \tanh(z) = \frac{e^z - e^{-z}}{e^z + e^{-z}}\)
- reLU (rectified linear): \(f(z) = \max(0,x)\)
Read full-text »
Confusion matrix
2018-11-07
概念
混淆矩阵(confusion matrix,also called error matrix):用于表征分类模型在一个测试集合上的效果的表格。
比如,对于一个二分类问题,其分类效果可用类似于下表表示,列是预测的类别,行是实际的类别,由此就可知道哪些类别容易预测,哪些容易预测错误(尤其是多分类问题的):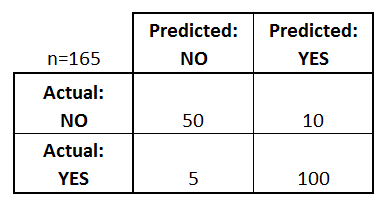
计算
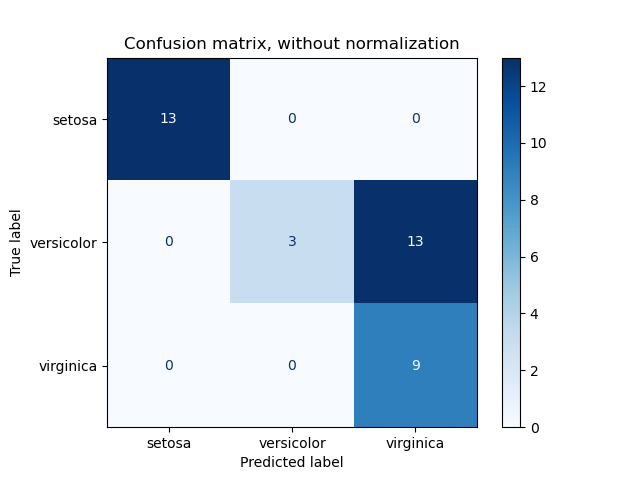
当有一个预测的label后,实际的label是已知的,所以可以直接根据这些数值计算并可视化混淆矩阵,sklearn提供了一个代码,可以参考一下:
计算混淆矩阵:
from sklearn.metrics import confusion_matrix

# 数字类别
y_true = [2, 0, 2, 2, 0, 1]
y_pred = [0, 0, 2, 2, 0, 2]
confusion_matrix(y_true, y_pred)

array([[2, 0, 0],
       [0, 0, 1],
       [1, 0, 2]])

# 字符类别
y_true = ["cat", "ant", "cat", "cat", "ant", "bird"]
y_pred = ["ant", "ant", "cat", "cat", "ant", "cat"]
confusion_matrix(y_true, y_pred, labels=["ant", "bird", "cat"])

array([[2, 0, 0],
       [0, 0, 1],
       [1, 0, 2]])
可视化
可视化,sklearn也提供了代码,注意的是,这里的classes如果是数字需要用np.array转换一下并设置数据类型(classes=np.array([0,1],dtype='<U10')):
def plot_confusion_matrix(y_true, y_pred, classes, normalize=False, title=None, cmap=plt.cm.Blues):
    """ plot_confusion_matrix(list(df_labels['cell_label']),
                              list(df_prediction_label['label']),
                              classes=np.array([0,1], dtype='<U10'), # use np to convert and set data type
                              title='Without normalization')
    """
    from sklearn.metrics import confusion_matrix
    from sklearn.utils.multiclass import unique_labels
    if not title:
        if normalize:
            title = 'Normalized confusion matrix'
        else:
            title = 'Confusion matrix, without normalization'
    cm = confusion_matrix(y_true, y_pred)
    classes = classes[unique_labels(y_true, y_pred)]
    if normalize:
        cm = cm.astype('float') / cm.sum(axis=1)[:, np.newaxis]
        print("Normalized confusion matrix")
    else:
        print('Confusion matrix, without normalization')

    print(cm)

    fig, ax = plt.subplots()
    im = ax.imshow(cm, interpolation='nearest', cmap=cmap)
    ax.figure.colorbar(im, ax=ax)
    ax.set(xticks=np.arange(cm.shape[1]),
           yticks=np.arange(cm.shape[0]),
           xticklabels=classes, yticklabels=classes,
           title=title,
           ylabel='True label',
           xlabel='Predicted label')
    plt.setp(ax.get_xticklabels(), rotation=45, ha="right",
             rotation_mode="anchor")
    fmt = '.2f' if normalize else 'd'
    thresh = cm.max() / 2.
    for i in range(cm.shape[0]):
        for j in range(cm.shape[1]):
            ax.text(j, i, format(cm[i, j], fmt),
                    ha="center", va="center",
                    color="white" if cm[i, j] > thresh else "black")
    fig.tight_layout()
    return ax

# Plot non-normalized confusion matrix
plot_confusion_matrix(y_test, y_pred, classes=class_names,
                      title='Confusion matrix, without normalization')

# Plot normalized confusion matrix
plot_confusion_matrix(y_test, y_pred, classes=class_names, normalize=True,
                      title='Normalized confusion matrix')
参考
Read full-text »
[CS229] 07: Regularization
2018-11-04
07: Regularization
- 过拟合的问题:
- 如何解决过拟合:
- 如何鉴定是否过拟合?泛化能力很差,对新样本的预测效果很糟糕。
- 低维时可以画出来,看拟合的好坏?高维时不能很好的展示。
- 特征太多,数据太少容易过拟合。
- 方案【1】减少特征数目。1)手动挑选特征;2)算法模型挑选;3)挑选特征会带来信息丢失
- 方案【2】正则化。1)保留所有特征,但是减小权重函数的量级;2)当有很多特征时,每一个特征对于预测都贡献一点点。
- 正则化:
- 参数值较小时模型越简单
- 简单的模型更不容易过拟合
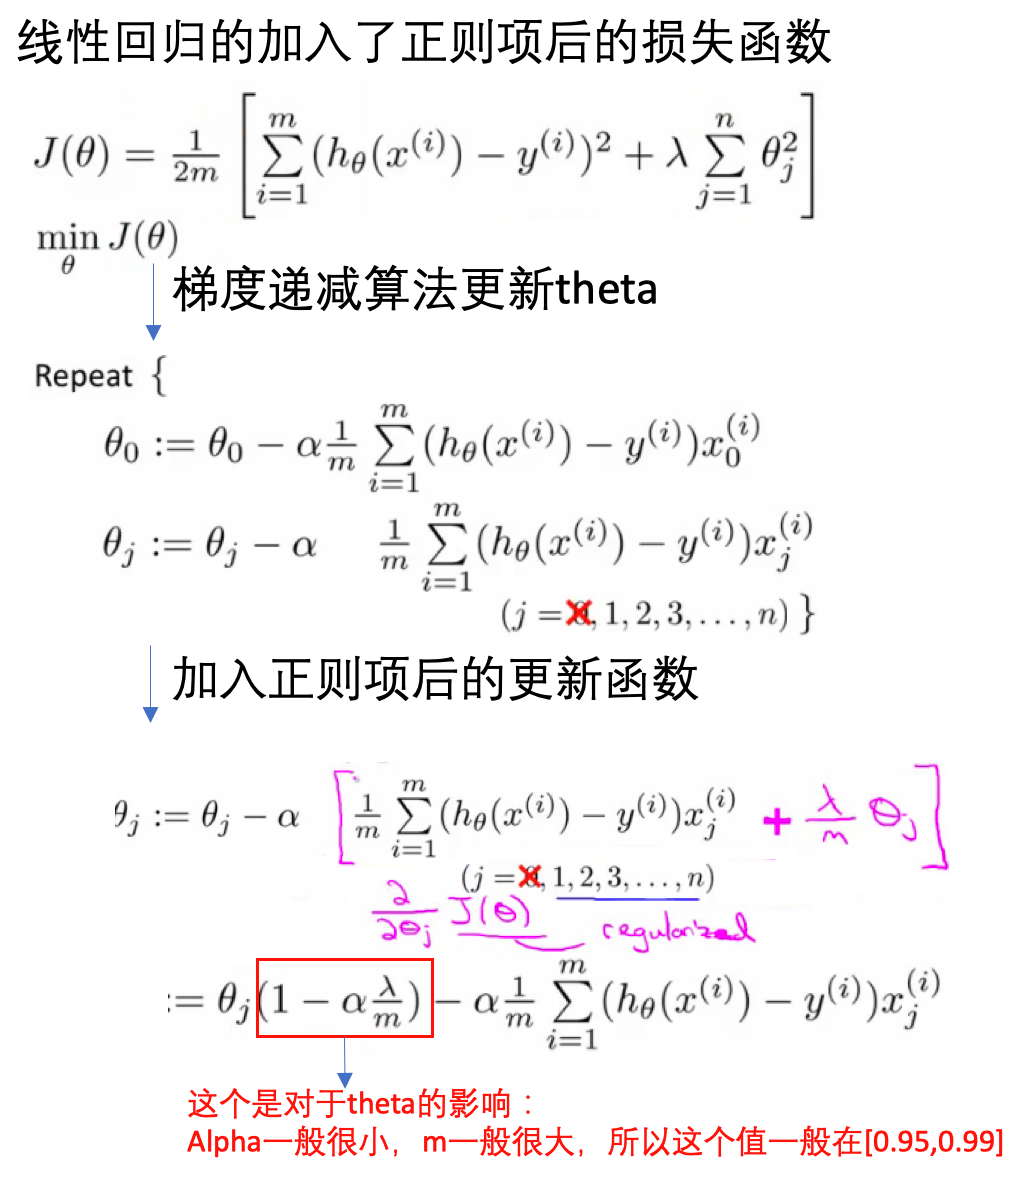
- 加入正则项,减小每个参数的值
- 加入正则项后的损失函数:

- λ正则化参数:平衡模型对于训练数据的拟合程度,和所有参数趋于小(模型趋向于简单)
Read full-text »
sklearn: 数据集加载
2018-11-01
目录
1. 数据集
- 类:
sklearn.datasets - 通用数据
- 生成数据
- 获取真实数据
2. 通用数据集
三种API接口:
loader:加载小的标准数据集fetchers:下载大的真实数据集generate functions:生成受控的合成数据集
3. 通用标准数据集
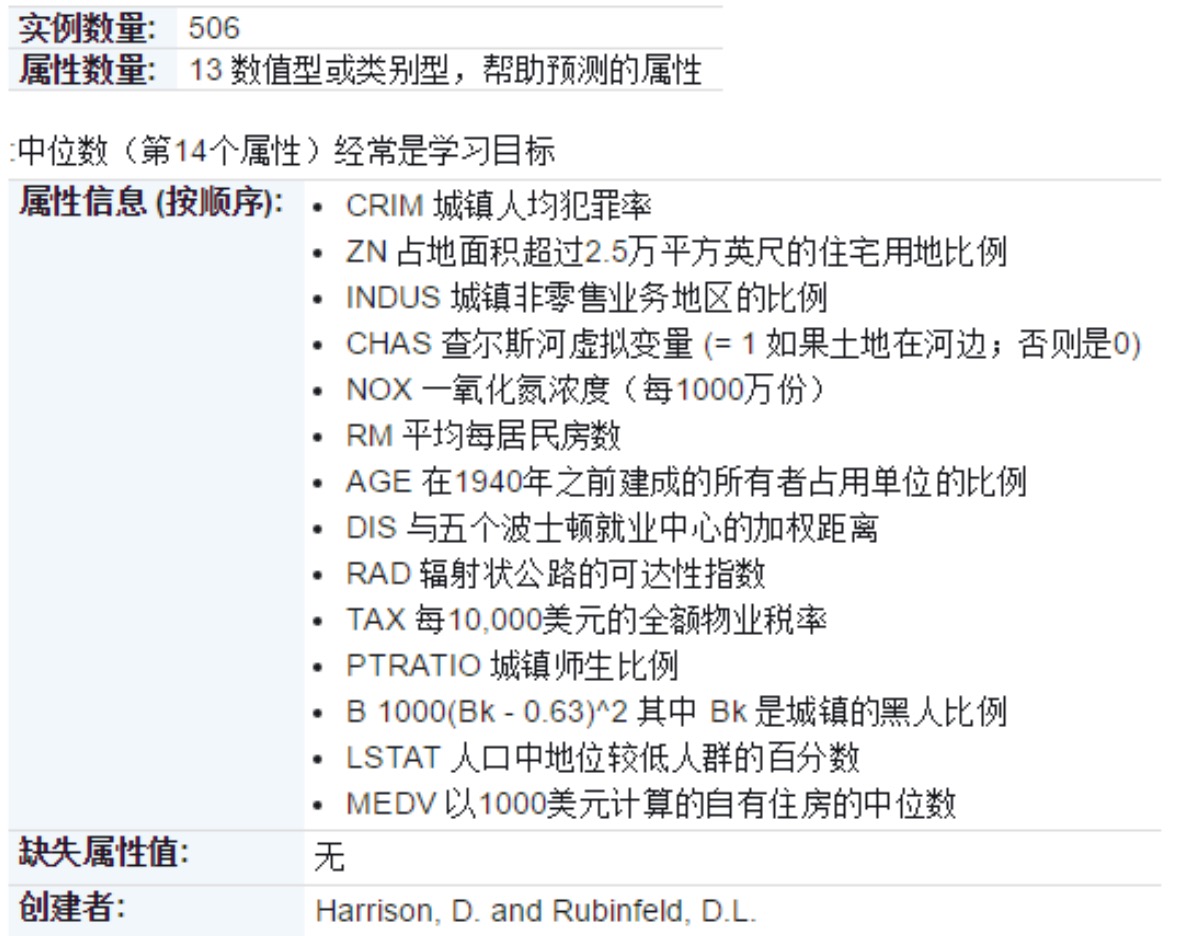
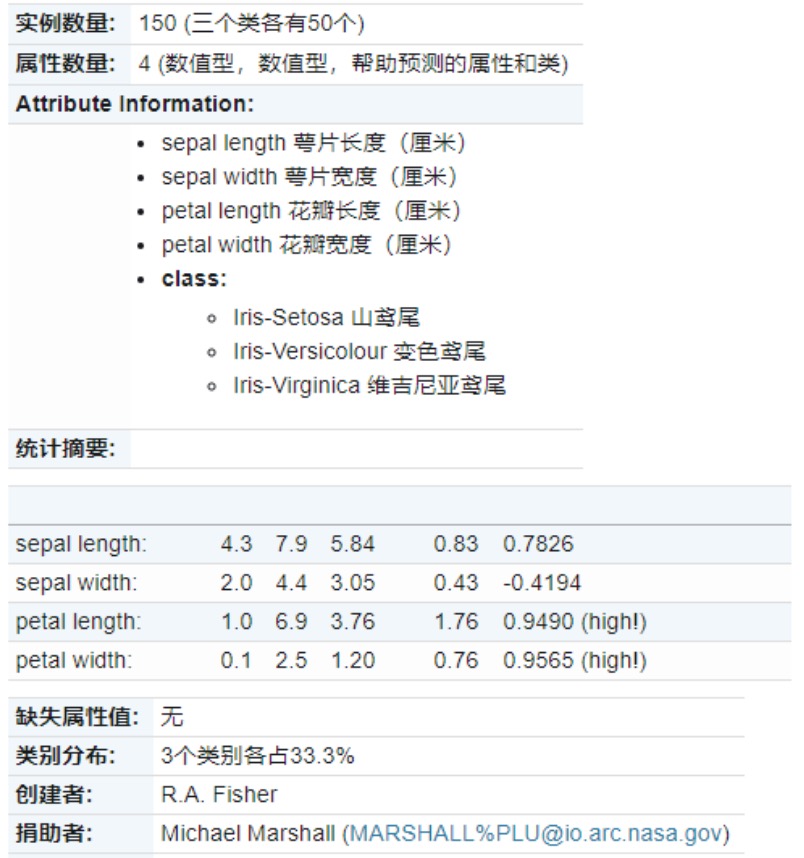
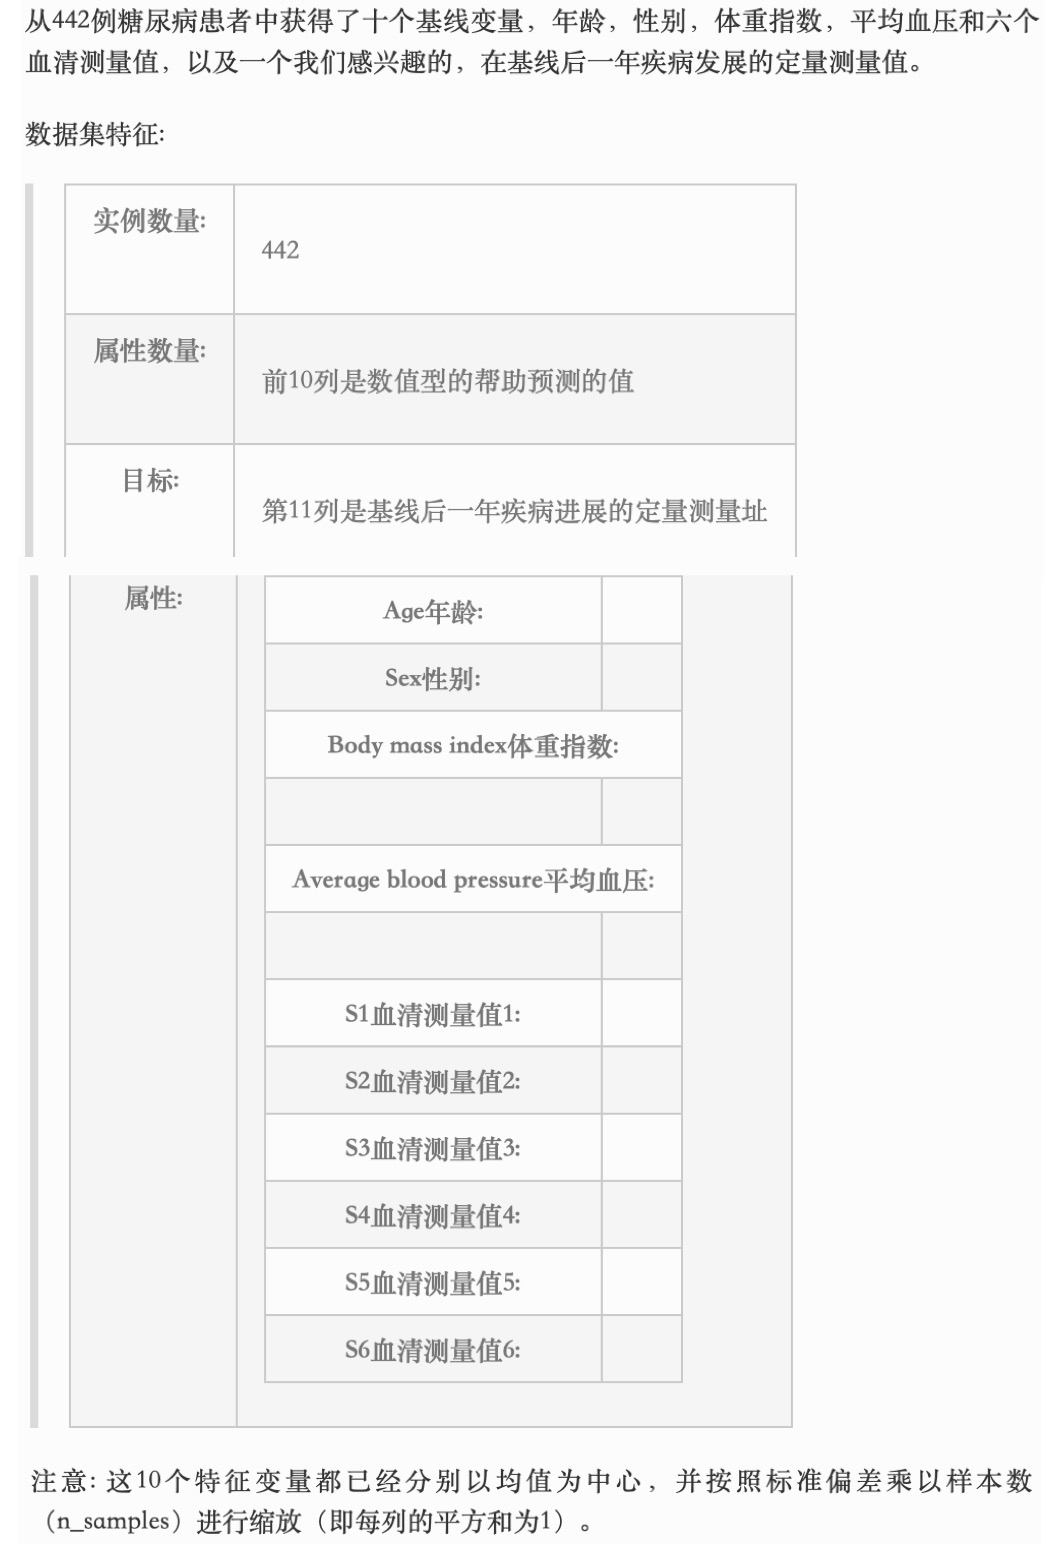
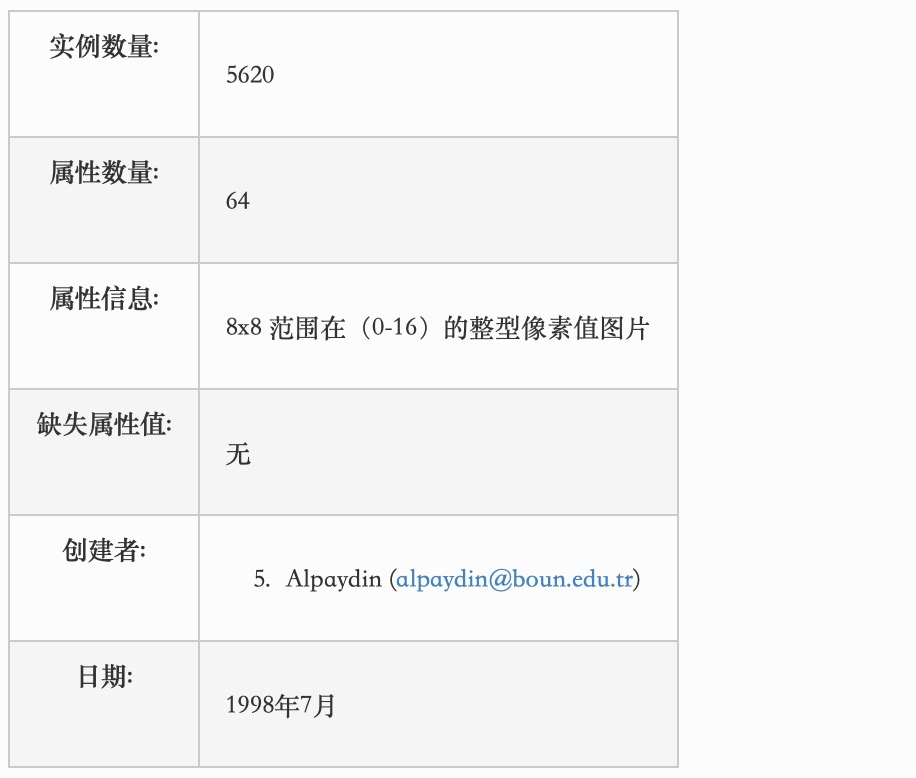
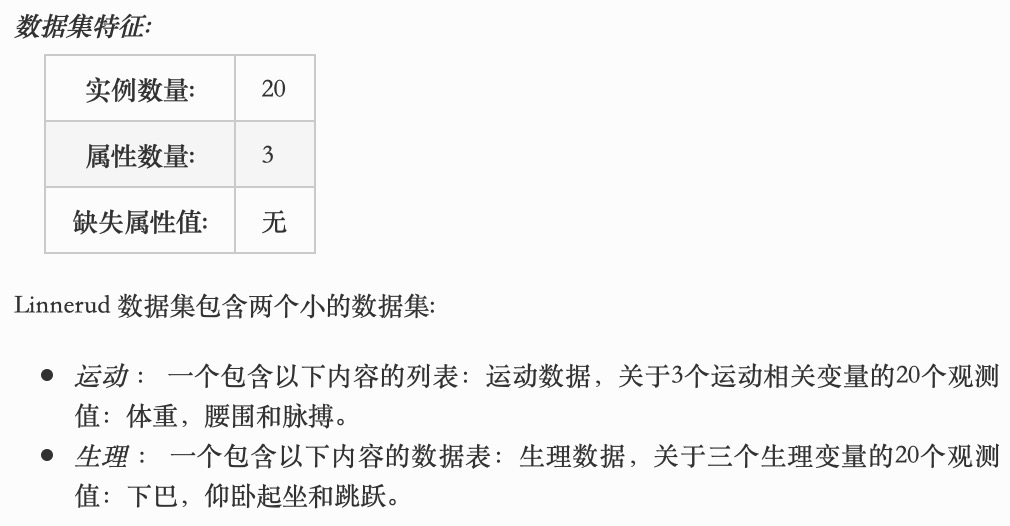
boston house-prices
Iris
diabetes
digitals
linnerud
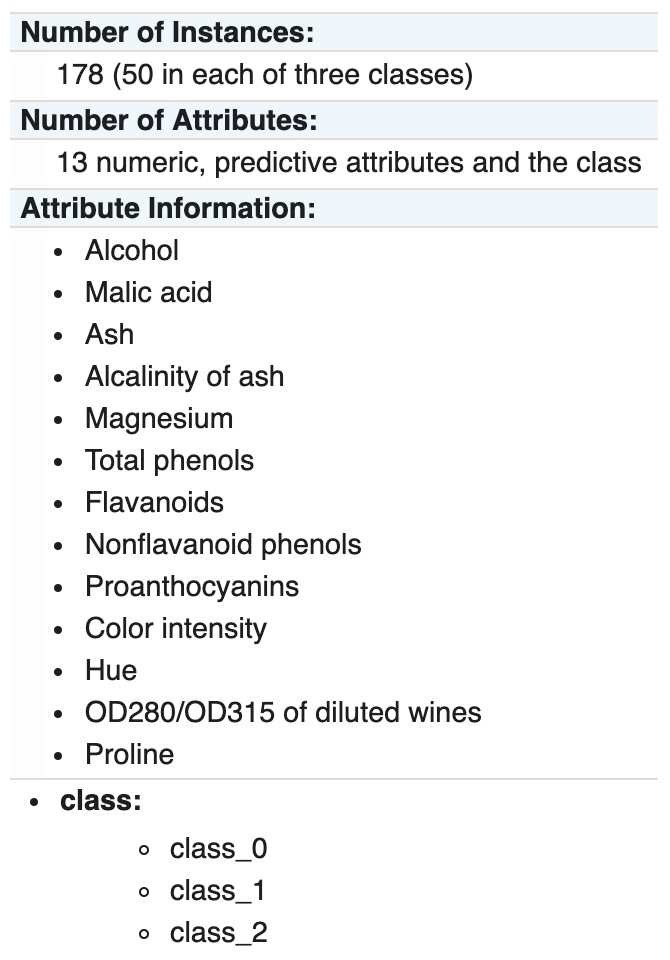
wine
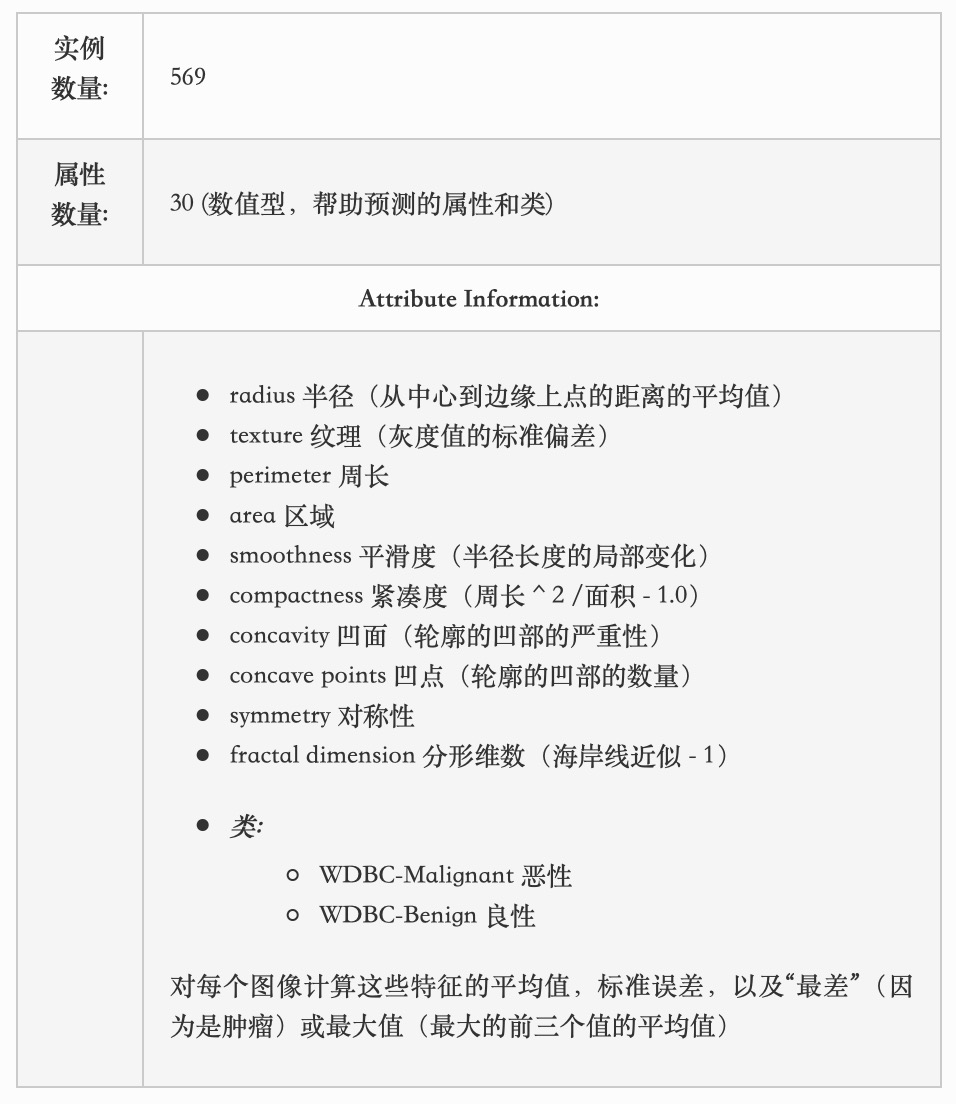
breast cancer
4. 真实数据
The Olivetti faces dataset
- description: a set of face images taken between April 1992 and April 1994 at AT&T Laboratories Cambridge
- classes: 40
- samples: 400
- dimensionality: 4096
- features: real, [0,1]
The Olivetti faces dataset
- description: comprises around 18000 newsgroups posts on 20 topics split in two subsets: one for training (or development) and the other one for testing (or for performance evaluation).
- classes: 20
- samples: 18846
- dimensionality: 1
- features: text
The Labeled Faces in the Wild face recognition dataset
- description: a collection of JPEG pictures of famous people collected over the internet
- classes: 5479
- samples: 13233
- dimensionality: 5828
- features: real, [0,255]
Forest covertypes
- description: 30×30m patches of forest in the US, collected for the task of predicting each patch’s cover type
- classes: 7
- samples: 581012
- dimensionality: 54
- features: int
RCV1 dataset
- description: Reuters Corpus Volume I (RCV1) is an archive of over 800,000 manually categorized newswire stories made available by Reuters, Ltd. for research purposes
- classes: 103
- samples: 804414
- dimensionality: 47236
- features: real, [0,1]
Kddcup 99 dataset
- description: created by processing the tcpdump portions of the 1998 DARPA Intrusion Detection System (IDS) Evaluation dataset, created by MIT Lincoln Lab
- classes: 总共分为了4个小类的数据,具体参见这里
- samples: 4898431
- dimensionality: 41
- features: discrete (int) or continuous (float)
California Housing dataset
- description: Reuters Corpus Volume I (RCV1) is an archive of over 800,000 manually categorized newswire stories made available by Reuters, Ltd. for research purposes
- samples: 20640
- dimensionality: 8
- features: real
- 和波斯顿房价数据的区别:这个是基于房屋本身属性的,而那个是基于城市地区属性的,这个其实更接近现实一点。
MedInc median income in block
HouseAge median house age in block
AveRooms average number of rooms
AveBedrms average number of bedrooms
Population block population
AveOccup average house occupancy
Latitude house block latitude
Longitude house block longitude
5. 生成数据
分类:单标签
函数:make_blobs
函数:make_classification
分类:多标签
函数:make_multilabel_classification
二分聚类
函数:make_biclusters,Generate an array with constant block diagonal structure for biclustering.
函数:make_checkerboard,Generate an array with block checkerboard structure for biclustering.
回归生成器
函数:make_regression,产生的回归目标作为一个可选择的稀疏线性组合的具有噪声的随机的特征
流行学习生成器
函数:make_s_curve,生成S曲线数据集
函数:make_swiss_roll,生成swiss roll数据集
6. 下载公开数据集:openml.org
- openml.org:是一个用于机器学习数据和实验的公共存储库,它允许每个人上传开放的数据集
- 函数:
sklearn.datasets.fetch_openml
>>> from sklearn.datasets import fetch_openml
>>> mice = fetch_openml(name='miceprotein', version=4)
>>>

# 查看数据集的信息和属性
# DESCR:自由文本描述数据
# details:字典格式的元数据
>>> print(mice.DESCR)
**Author**: Clara Higuera, Katheleen J. Gardiner, Krzysztof J. Cios
**Source**: [UCI](https://archive.ics.uci.edu/ml/datasets/Mice+Protein+Expression) - 2015
**Please cite**: Higuera C, Gardiner KJ, Cios KJ (2015) Self-Organizing
Feature Maps Identify Proteins Critical to Learning in a Mouse Model of Down
Syndrome. PLoS ONE 10(6): e0129126...

>>> mice.details
{'id': '40966', 'name': 'MiceProtein', 'version': '4', 'format': 'ARFF',
'upload_date': '2017-11-08T16:00:15', 'licence': 'Public',
'url': 'https://www.openml.org/data/v1/download/17928620/MiceProtein.arff',
'file_id': '17928620', 'default_target_attribute': 'class',
'row_id_attribute': 'MouseID',
'ignore_attribute': ['Genotype', 'Treatment', 'Behavior'],
'tag': ['OpenML-CC18', 'study_135', 'study_98', 'study_99'],
'visibility': 'public', 'status': 'active',
'md5_checksum': '3c479a6885bfa0438971388283a1ce32'}
7. 加载外部数据集
- 数据集已经准备好了,自行加载以输入模型
- 不同的工具包:
pandas.io,scipy.io,numpy - 杂项数据:
skimage.io,Imagio,scipy.misc.imread,scipy.io.wavfile.read
参考
Read full-text »
[CS229] 06: Logistic Regression
2018-10-29
06: Logistic Regression
- 逻辑回归:分类,比如email是不是垃圾邮件,肿瘤是不是恶性的。预测y值(label),=1(positive class),=0(negative class)。
- 分类 vs 逻辑回归(逻辑回归转换为分类):
- 分类:值为0或1(是离散的,且只能取这两个值)。
- 逻辑回归:预测值在[0,1之间]。
- 阈值法:用逻辑回归模型,预测值>=0.5,则y=1,预测值<0.5,则y=0.
- 逻辑回归函数(假设,hypothesis):
- 公式:\(\begin{align}h_\theta(x) = \frac{1}{1+\exp(-\theta^\top x)}\end{align}\)
- 分布:
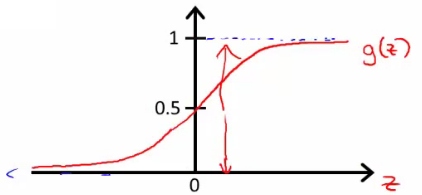
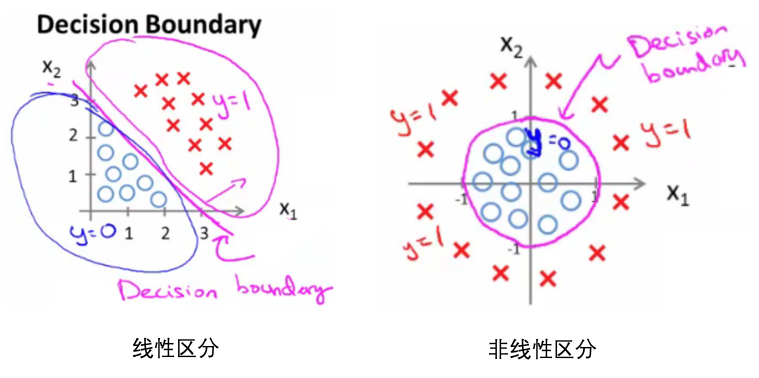
- 决策边界(decision boundary):区分概率值(0.5)对应的theta值=0,所以函数=0所对应的线。
- 损失函数:
- 问题:
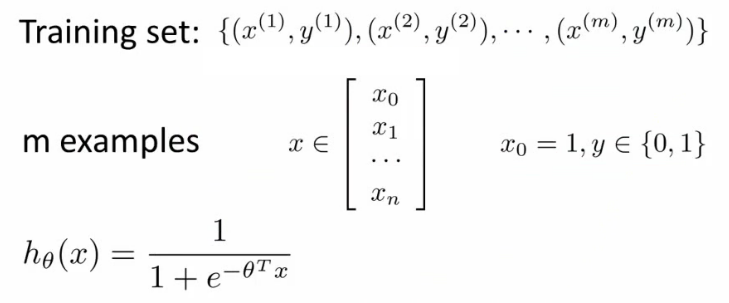
- 如果延续线性函数的损失函数,则可写成如下,但是当把逻辑函数代入时,这个损失函数是一个非凸优化(non-convex,有很多局部最优,难以找到全局最优)的函数。

- 因此,需要使用一个凸函数作为逻辑函数的损失函数:

- 把所有训练样本的误差合在一起:\(\begin{align}J(\theta) = -\left[ \sum_{i=1}^m y^{(i)} \log h_\theta(x^{(i)}) + (1-y^{(i)}) \log (1-h_\theta(x^{(i)})) \right]\end{align}\)
- 问题:
- 多类别分类:
- 多类别分类:softmax regression多元回归:
- 参考Softmax Regression @ UFLDL Tutorial和Softmax Regression简介
- 同义词: Multinomial Logistic, Maximum Entropy Classifier, or just Multi-class Logistic Regression
- 这里提供了一个关于二元和多元逻辑回归的比较(包括其提到的例子可以看一下):
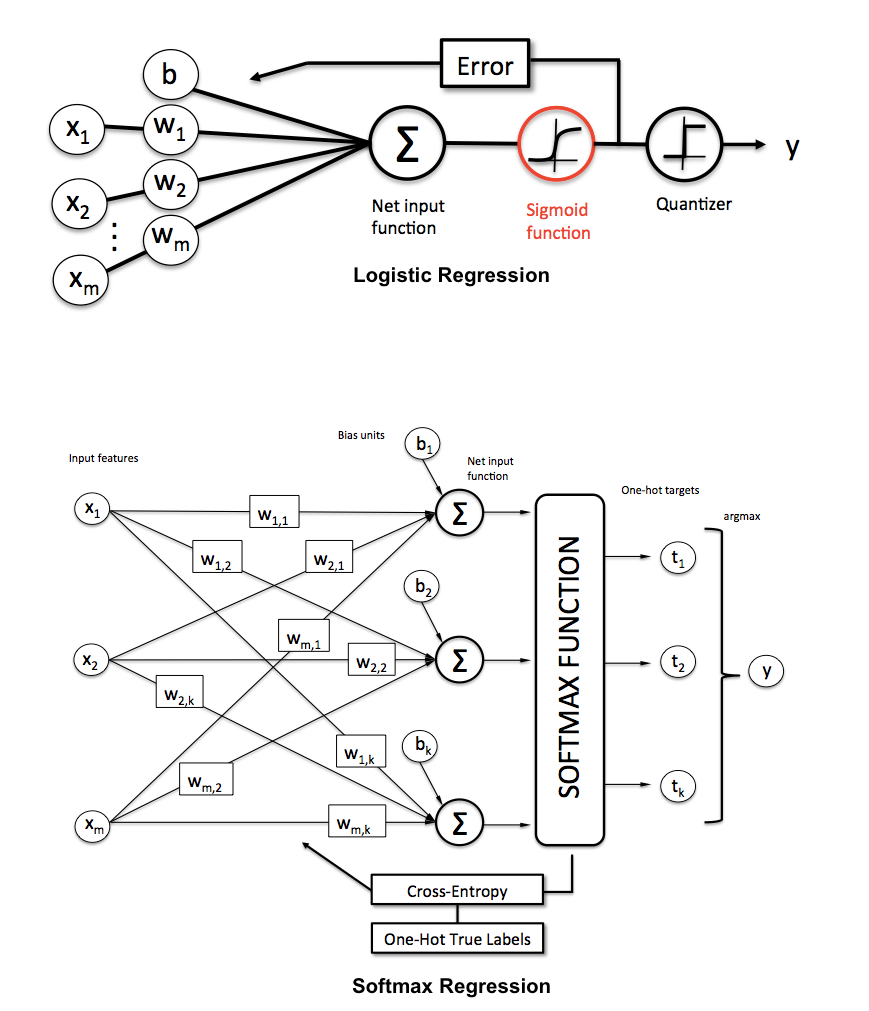
- 因为是多类别,所以(模型)输出是每个类别的概率(对于某个样本和参数\(\theta\),输出属于每个类别的概率):\(\begin{align} h_\theta(x) = \begin{bmatrix} P(y = 1 | x; \theta) \\ P(y = 2 | x; \theta) \\ \vdots \\ P(y = K | x; \theta) \end{bmatrix} = \frac{1}{ \sum_{j=1}^{K}{\exp(\theta^{(j)\top} x) }} \begin{bmatrix} \exp(\theta^{(1)\top} x ) \\ \exp(\theta^{(2)\top} x ) \\ \vdots \\ \exp(\theta^{(K)\top} x ) \\ \end{bmatrix} \end{align}\)
- 损失函数:和逻辑回归类似,只是这里是对于K个类别的加和:\(\begin{align}
J(\theta) &= - \left[ \sum_{i=1}^m (1-y^{(i)}) \log (1-h_\theta(x^{(i)})) + y^{(i)} \log h_\theta(x^{(i)}) \right] \\
&= - \left[ \sum_{i=1}^{m} \sum_{k=0}^{1} 1\left\{y^{(i)} = k\right\} \log P(y^{(i)} = k | x^{(i)} ; \theta) \right]
\end{align} \\\) 这里
1{.}叫做指示函数(indicator function),如果括号内容为真,则值为1,为假则值为0. - 类别概率:\(\begin{align}P(y^{(i)} = k \| x^{(i)} ; \theta) = \frac{\exp(\theta^{(k)\top} x^{(i)})}{\sum_{j=1}^K \exp(\theta^{(j)\top} x^{(i)}) }\end{align}\),某个样本所有类别的概率和为1.
- 这里的参数优化使用梯度下降法,梯度更新如下:\(\begin{align} \nabla_{\theta^{(k)}} J(\theta) = - \sum_{i=1}^{m}{ \left[ x^{(i)} \left( 1\{ y^{(i)} = k\} - P(y^{(i)} = k | x^{(i)}; \theta) \right) \right] } \end{align}\)
Read full-text »
Latest articles
Links
- ZhangLab , RISE database , THU life , THU info
- Data analysis: pandas , numpy , scipy
- ML/DL: sklearn , sklearn(中文) , pytorch
- Visualization: seaborn , matplotlib , gallery
- Github: me
